

All-inclusive design — building on-site food and drink into the room rate — is spreading from onsen ryokan to city hotels. Free drinks at dinner, lounge access after check-in, a late-night noodle service: a stay with nothing left to settle at checkout is, for the guest, an experience with a predictable bill, and for the operator, a way to lock in per-guest spend at the moment of booking. In 2026, with labour and food costs still climbing, how far has this design spread, and how much of it actually shows up in the rate? This article tests that question against three data sets: guest-review mention data, price gaps by meal type (paired comparisons within the same property), and prevailing ADR.
Metric Definitions Used in This Article
- ADR (average daily rate): An estimated settled rate (tax-exclusive equivalent), calculated by applying a property-type correction coefficient to the lowest published plan level each property lists on OTAs and similar channels (2 guests per room, per-room rate, tax-inclusive). Cross-checked against property-level disclosures from listed hotel REITs (91 properties, most recent 3 months), the median error is approximately 7%. These are estimates and differ from each property’s actual transacted prices and accounting figures. Area-level ADR is the median across the properties covered (the level of a typical property in that area).
- Listed price: The selling price as published on OTAs and similar channels (2 guests per room, per-room rate, tax-inclusive). Used for plan-level comparisons.
- Meal premium: Calculated only where a single property sells plans across multiple meal types, as the average price gap between meal types within that property (paired comparison). It is not a comparison across properties.
- Mention rate: The share of guest reviews that touch on a given topic. It is not a rating score. A high mention rate means the element is talked about frequently; it does not directly indicate higher or lower satisfaction.
- Data sources: MetroEngines Research (prices, ADR) / HotelBank Editorial Team research (review mention data)
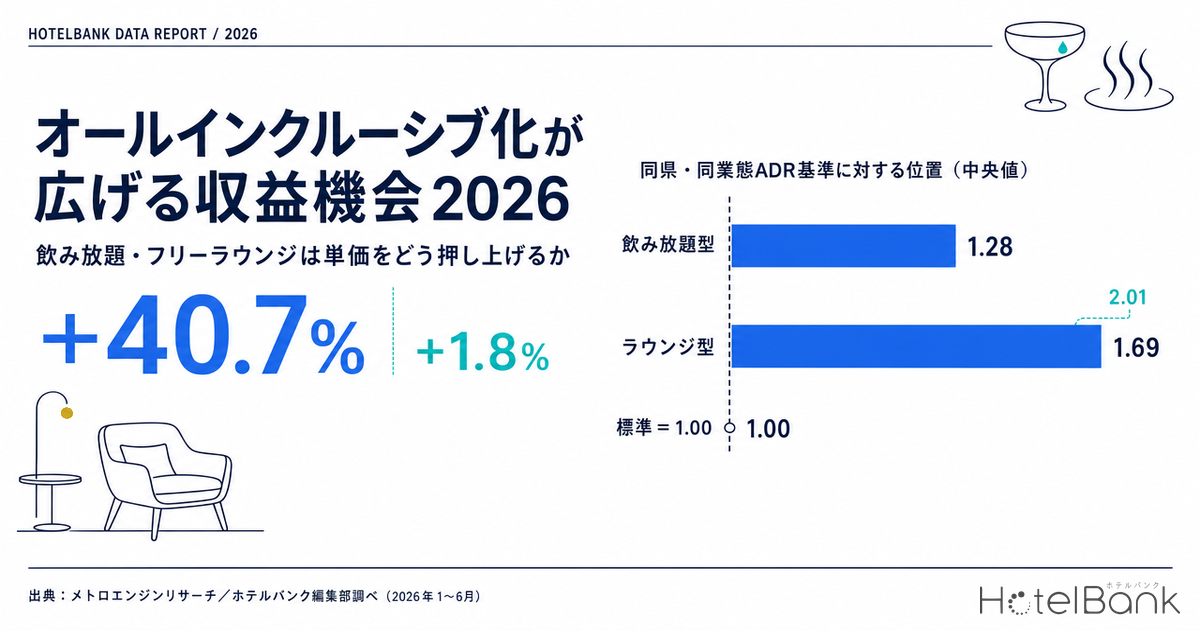
- — +40.7% — Two-meal plans run a median +40.7% above room-only (a gap of roughly ¥9,500). Paired comparison within the same property, June 2026, 2,041 properties. Including meals builds the foundation of the rate.
- — +1.8% — Yet putting “free drinks” in the plan name lifts the price only a median +1.8% over the same property’s other two-meal plans (Shizuoka, 97 properties). At plan level, the uplift is small.
- — 1.28x / 1.69x — The gap appears at property level. Against the median estimated settled ADR for the same prefecture and property type, free-drink properties sit at 1.28x and lounge properties at 1.69x (January–June 2026).
- — Every property above benchmark — Among lounge-type business hotels, all 23 properties that could be matched came in above the benchmark for their prefecture and property type (median 1.62). A direction with likely repeatability for limited-service hotels.
- — Onsen towns vs cities — Free-drink properties cluster in onsen regions (Hokkaido 18, Kanagawa 12, Gunma 12), while lounge properties concentrate in urban markets (Tokyo 30, Kanagawa 28).
“Free drinks included” in onsen towns, “free lounge” in cities — two distinct types
Start with where inclusive on-site food and drink is actually being talked about. The HotelBank Editorial Team analysed guest reviews from the past 24 months and tallied, by prefecture, the properties with mentions of “free drinks / free-flow beverages.” Of the 44 prefectures for which the tally completed, 41 had at least one qualifying property (196 properties in total). Mentions of an “on-site lounge,” by contrast, covered 38 prefectures and 200 properties.
The geographic split between the two is clear. Free-drink properties are heavily weighted toward prefectures with onsen destinations: Hokkaido (18 properties), Kanagawa (12), Gunma (12), Tochigi (11) and Mie (10). Lounge properties, by contrast, concentrate in urban markets: Tokyo (30), Kanagawa (28) and Hiroshima (15). Even within the same idea of “bundling on-site consumption into the rate,” onsen ryokan implement it as free-flow alcohol centred on dinner, while city hotels implement it as lounge service running from check-in into the evening.
Source: HotelBank Editorial Team research (analysis of guest reviews over the past 24 months; free drinks N=196 properties / lounge N=200 properties)
Two constraints apply to this tally. First, there is a cap on the number of records retrieved per prefecture, and Tokyo’s lounge count (30 properties) has hit that cap, so the true property count is higher. Second, Kyoto, Nara and Toyama (free drinks) and Oita, Nagano, Shizuoka and six other prefectures (lounge, nine in total) did not complete processing and fall outside this population. The figures in this section should therefore be read not as a full national count but as the distribution across the range that could be tallied. Even so, the onsen-versus-urban divide holds consistently down into the mid-ranking prefectures, which are less exposed to the cap.
The “two-meal premium” as foundation — a median +40.7% over room-only
So how much does folding on-site consumption into the room rate actually add to price? Start with the underlying effect of including meals. Here the analysis is limited to properties selling room-only, breakfast-included and two-meal plans simultaneously, using a paired comparison that measures the price gap within each property (June 2026, 2 guests per room, all 47 prefectures).
The result is unambiguous. Two-meal plans run a median +40.7% above room-only (median gap of roughly ¥9,500, across 2,041 properties). Set against breakfast-only, which adds just +8.3% (about ¥1,600, 4,739 properties), it is clear that including dinner is the main driver of price. Measured from a breakfast-included baseline, two-meal plans still sit +34.9% higher (about ¥8,100, 2,102 properties). Which property types and regions actually convert dinner inclusion into earnings varies considerably, and the prefecture-level figures later in this article give a first indication of where that happens.
Source: Compiled by HotelBank Editorial Team from MetroEngines Research (June 2026, paired comparison within the same property)
By property type the gap is starker still. City hotels show the largest two-meal premium over room-only at +54.2% (about ¥14,000, 380 properties), followed by business hotels at +42.7% (about ¥6,200, 797 properties) and resort hotels at +33.8% (about ¥12,300, 370 properties). The relatively smaller percentage for resorts reflects a higher room-only baseline and therefore a larger denominator; in absolute terms, roughly ¥12,300 puts them second only to city hotels.
By prefecture, the largest two-meal premiums are in Nara (+70.1%), Kyoto (+64.5%), Kochi (+63.3%), Ishikawa (+61.8%) and Osaka (+60.4%). The smallest are in Yamaguchi (+23.9%), Okinawa (+25.8%), Fukushima (+26.8%) and Tochigi (+27.3%). The former can be read as markets where room-only urban inventory and meal-inclusive properties coexist within the same prefecture, producing a two-tier price structure; the latter as onsen-type markets where two meals are the standard and little gap opens up against room-only. The latter case is also the flip side of meal inclusion having already saturated, which implies the next increment of uplift lies “beyond the meal.” How the depth of each prefecture’s meal premium relates to its mix of property types is what the prefecture-level chart further below sets out.
At plan level the gap is small — the uplift shows up in property design
This brings us to the core question: does “free drinks included” stack on top of the two-meal premium? Taking Shizuoka Prefecture, we separated two-meal plans with check-in in the first half of August 2026 by property, and compared the listed prices of plans whose names feature free drinks, free-flow beverages or all-inclusive against two-meal plans without such wording — within the same property (pairs were formed at the 97 properties selling both).
The result: a median +1.8%, mean +5.6%. Even when free drinks are named explicitly in the plan title, the nominal price gap against the same property’s other two-meal plans is minimal. At plan level, free drinks function less as an “option that raises price” and more as a selling point within the same price band.
Does that mean going all-inclusive does not move the rate? No. The gap appears not at plan level but in property-level positioning. The next section confirms this from prevailing ADR.
Position by prevailing ADR — ryokan +48.6% over benchmark, and every lounge-type business hotel above it
To see where properties associated with inclusive on-site food and drink sit in the market, we use estimated settled ADR. Each property’s estimated settled ADR for January–June 2026 is compared against the median estimated settled ADR for the same prefecture and the same property type (=1.00). This strips out differences of property type and region, and shows how far above the standard a property sits.
Free-drink properties (186 could be matched) have an overall median of 1.28 — that is, 28% above the typical level for their prefecture and property type. Within that, ryokan rank highest, with a median of 1.49 across 113 properties (median ADR of about ¥19,100 against a benchmark of about ¥13,600), and 76% of properties above the benchmark. Resort hotels come in at 1.11 (43 properties) and business hotels at 1.15 (24 properties).
Lounge properties (146) sit higher still, with an overall median of 1.69: ryokan 2.01 (67 properties), city hotels 1.65 (33 properties), and business hotels 1.62, where all 23 properties that could be matched exceeded the benchmark. Properties carrying the fixed cost of a lounge are clearly holding a higher price band than the typical business hotel in the same trade area.
Source: Compiled by HotelBank Editorial Team from MetroEngines Research (January–June 2026 average; free drinks N=186 properties / lounge N=146 properties)
Lined up by grade, the gradient is distinctly stepped. Free-drink properties run from luxury 1.65 (66 properties) through high-grade 1.26 (33 properties) and upper 1.14 (51 properties), with economy 0.98 (20 properties) and budget 0.93 (15 properties) hovering around the benchmark. Lounge properties show luxury 2.06 (73 properties), high-grade 1.66 (26 properties), upper 1.42 (33 properties), economy 1.46 (8 properties) and budget 1.34 (6 properties) — the difference from free-drink properties being that even the lower grades stay above the benchmark.
Source: Compiled by HotelBank Editorial Team from MetroEngines Research (median ratio against the median estimated settled ADR for the same prefecture and property type, set at 1.00)
One caveat on interpretation should be stated explicitly. These figures do not demonstrate causation — they do not show that introducing free drinks or a lounge raises ADR by this much. Properties whose inclusive food and drink gets discussed in reviews skew toward those already investing in the whole stay experience, so a selection bias is present. What can be read here is a relationship of co-occurrence: designing on-site consumption into the room rate and sustaining a price band above the standard for the property type do in fact occur together.
Most-mentioned properties — free-drink types in onsen towns
Below are the properties whose on-site free drinks and free-flow beverages guests actually talk about most, ordered by mention count. All of them place inclusive on-site consumption at the centre of the stay’s value.
| Property | Location | Type | Rooms | Mentions | Mention rate | ADR | vs same pref./type |
|---|---|---|---|---|---|---|---|
| Suginoi Hotel, Beppu Onsen (別府温泉 杉乃井ホテル) | Oita | Resort | 791 | 80 | 2.55% | ¥25,735 | 1.33 |
| Dogashima New Ginsui (堂ヶ島 ニュー銀水) | Shizuoka | Resort | 123 | 74 | 7.7% | ¥22,342 | 1.23 |
| Awara Onsen Mimatsu (あわら温泉美松) | Fukui | Ryokan | 84 | 71 | 9.13% | ¥17,996 | 1.19 |
| Aishinkan (愛真館) | Iwate | Ryokan | 113 | 69 | 12.43% | ¥14,608 | 1.69 |
| Ito Hotel Juraku (伊東ホテルジュラク) | Shizuoka | Resort | 99 | 66 | 6.7% | ¥34,352 | 1.89 |
| Anda no Mori Izu Ippeki Lake (森と温泉リゾート アンダの森 伊豆いっぺき湖) | Shizuoka | Resort | 68 | 64 | 4.22% | ¥29,590 | 1.63 |
| Hotel Urashima (ホテル浦島) | Wakayama | Ryokan | 681 | 62 | 3.61% | ¥24,180 | 1.84 |
| Nikko Kinugawa Hotel Mikazuki (日光きぬ川ホテル三日月) | Tochigi | Ryokan | 259 | 61 | 7.12% | ¥36,346 | 2.22 |
| Yusai, Kurokawa Onsen (黒川温泉 湯峡の響き 優彩) | Kumamoto | Ryokan | 55 | 60 | 4.55% | ¥33,739 | 2.01 |
| Yufuin Sansuikan (ゆふいん山水館) | Oita | Ryokan | 85 | 59 | 8.04% | ¥27,957 | 1.53 |
| Hakone Ashinoko Hanaori (箱根・芦ノ湖 はなをり) | Kanagawa | Resort | 154 | 58 | 2.87% | ¥32,683 | 1.36 |
| Oarai Hotel (大洗ホテル) | Ibaraki | Resort | 93 | 55 | 7.12% | ¥36,977 | 4.38 |
Source: HotelBank Editorial Team research (mention data, past 24 months) / MetroEngines Research (ADR, January–June 2026 average)
By mention rate, Aishinkan (Tsunagi Onsen, Iwate) leads at 12.43% — roughly one review in eight touches on the property’s drink service. Reaching that level at a mid-sized 113 rooms shows that how a stay gets talked about is determined by design rather than scale. At the other end, the 791-room Suginoi Hotel, Beppu Onsen has a modest mention rate of 2.55% but the highest absolute count at 80 mentions, the sheer volume that only a large property generates.
Most-mentioned properties — urban lounge types
Lounge properties span a wider range of types. High mention counts come not only from urban city hotels but also from business hotels and onsen ryokan.
| Property | Location | Type | Rooms | Mentions | Mention rate | ADR | vs same pref./type |
|---|---|---|---|---|---|---|---|
| Mitsui Garden Hotel Hiroshima (三井ガーデンホテル広島) | Hiroshima | Business | 281 | 125 | 7.88% | ¥12,202 | 1.62 |
| Nagoya Kanko Hotel (名古屋観光ホテル) | Aichi | City | 369 | 82 | 7.3% | ¥28,964 | 2.25 |
| Grandia Housen (グランディア芳泉) | Fukui | Ryokan | 111 | 77 | 7.04% | ¥40,045 | 2.65 |
| The Prince Park Tower Tokyo (ザ・プリンス パークタワー東京) | Tokyo | City | 603 | 72 | 2.9% | ¥65,702 | 2.43 |
| Hotel Associa Shin-Yokohama (ホテルアソシア新横浜) | Kanagawa | Business | 203 | 66 | 5.85% | ¥25,139 | 2.69 |
| Hotel Intergate Tokyo Kyobashi (ホテルインターゲート東京京橋) | Tokyo | Business | 200 | 61 | 3.34% | ¥21,855 | 1.52 |
| Minakami Hotel Juraku (みなかみホテルジュラク) | Gunma | Ryokan | 96 | 61 | 7.21% | ¥23,026 | 1.51 |
| Nagoya Prince Hotel Sky Tower (名古屋プリンスホテル スカイタワー) | Aichi | City | 170 | 57 | 4.23% | ¥38,276 | 2.98 |
| Hotel Sakurai (ホテル櫻井) | Gunma | Ryokan | 179 | 52 | 3.3% | ¥31,142 | 2.04 |
| Kutsurogi-Jyuku Shintaki (くつろぎ宿 新滝) | Fukushima | Ryokan | 81 | 49 | 9.74% | ¥17,840 | 1.63 |
| Grand Nikko Tokyo Daiba (グランドニッコー東京 台場) | Tokyo | City | 882 | 49 | 1.73% | ¥43,260 | 1.60 |
| Richmond Hotel Yamagata Ekimae (リッチモンドホテル山形駅前) | Yamagata | Business | 219 | 46 | 5.08% | ¥10,426 | 1.56 |
Source: HotelBank Editorial Team research (mention data, past 24 months) / MetroEngines Research (ADR, January–June 2026 average)
The three business hotels in this table deserve attention. Mitsui Garden Hotel Hiroshima is the most-discussed property overall, with 125 mentions and a 7.88% mention rate, and sits at 1.62 against the benchmark for its prefecture and property type. Hotel Associa Shin-Yokohama is at 2.69 and Richmond Hotel Yamagata Ekimae at 1.56. Being limited-service yet holding a lounge — a device that creates time spent on property — is what separates these hotels from the business-hotel field in the same trade area. For the urban limited-service segment, this is a direction with likely repeatability.
The logic under cost inflation, and the headroom in thinner areas
Japan’s lodging market in 2026 continues to pass rising labour and energy costs through to room rates. Research by Tokyo Shoko Research also finds room-rate increases widely across listed hotel companies. In this environment, designing on-site consumption into the room rate is rational on three counts.
First, per-guest spend can be fixed at the point of booking. On-site food and beverage revenue no longer depends on same-day consumption behaviour, which makes revenue easier to forecast. Second, beverage costs are easier to control on the procurement side. Unlike labour costs, where increases are hard to avoid, there is still room to adjust the cost ratio through the design of what is offered. Third, checkout operations get simpler. Fewer add-on settlements lighten the front-desk workload, which functions as a real cost saving when staffing is hard to secure. That said, how far rising food costs are squeezing the economics of the two-meal model is a separate question, and one that needs to be quantified on its own terms by property type and region.
Regionally, free-drink properties are concentrated in the onsen areas of Hokkaido, northern Kanto (Gunma, Tochigi), Izu (Shizuoka), Mie and Kyushu, while a fair number of prefectures show only one or two qualifying properties within the range that could be tallied. In particular, prefectures with a small two-meal premium (Yamaguchi +23.9%, Fukushima +26.8%, Tochigi +27.3%) are markets where meal inclusion has already standardised, leaving fertile ground for beverages and lounges as the next axis of differentiation. Conversely, prefectures with a large two-meal premium (Nara +70.1%, Kyoto +64.5%, Osaka +60.4%) carry heavy room-only inventory and still have headroom in meal inclusion itself.
Source: Compiled by HotelBank Editorial Team from MetroEngines Research (June 2026, paired comparison within the same property; 45 prefectures, 2,020 property-observations)
The same holds for urban lounge properties. Of the 38 prefectures that could be tallied, Tokyo, Kanagawa, Hiroshima, Mie and Yamagata account for roughly 40% of the total, and many prefectures containing a government-designated city still show only a handful of qualifying properties. Given that limited-service properties with lounges are almost uniformly above the benchmark for their type, these areas can be positioned as markets with remaining opportunity for new entry and repositioning.
⚠ Note on prices for future dates: The plan-level comparison in this article (check-in in the first half of August 2026) is a tally of selling prices published on OTAs and similar channels as of the survey date, and will shift as the check-in date approaches through the addition of new plans and price adjustments. Please note that current levels will not necessarily become the transacted prices.
Conclusion — less “raise it with a plan,” more “take the position by design”
To summarise what this analysis shows. Inclusive on-site food and drink is spreading in two distinct forms: the free-drink type in onsen towns and the lounge type in cities. On price, meal inclusion itself creates a substantial foundation — a median +40.7% for two-meal plans over room-only — but layering “free drinks” on top of that as a plan name produces a nominal price gap within the same property of only +1.8% at the median.
At property level, though, the picture changes. Properties associated with inclusive on-site food and drink sit at 1.28x the standard for their prefecture and property type in the free-drink case and 1.69x in the lounge case, and every lounge-equipped business hotel that could be matched came in above the benchmark. Going all-inclusive functions less as a technique for pricing up an individual plan and more as a design for repositioning the whole property into a higher price band — that is this article’s reading.
With costs still rising, there is a clear logic to absorbing on-site consumption into the room rate and fixing per-guest spend up front. Areas where qualifying properties remain thin, and the “beyond the meal” design in onsen towns where meal inclusion has already standardised, both remain revenue opportunities from 2026 onward.
Data caveats for this article
- Mention rate is the share of reviews touching on a topic, not a rating score. A higher or lower mention rate does not mean higher or lower satisfaction.
- The review-mention tally is subject to a cap on records retrieved per prefecture and may understate actual counts in areas with many properties. Prefectures where processing did not complete (free drinks: Kyoto, Nara, Toyama / lounge: Oita, Nagano, Shizuoka and others, nine in total) are excluded from the population. Please read this as the distribution across the range that could be tallied, not as a national figure.
- The ADR comparison does not demonstrate causation. Properties whose inclusive on-site food and drink is discussed in reviews carry a selection bias, and the relationship is interpreted as co-occurrence.
- The meal premium is a price gap by meal type within the same property (paired comparison). Because ryokan rarely sell room-only plans and pairs are hard to form, this tally is centred on hotel property types.
Related Reading
References and Sources
■ Data sources
Estimated settled ADR (average of monthly estimated settled rates, January–June 2026); paired within-property comparison by meal type (June 2026, 2 guests per room, all 47 prefectures); plan-level listed-price comparison (Shizuoka, check-in in the first half of August 2026, 97 properties); and a tally of guest-review mentions over the past 24 months (free drinks N=196 properties / lounge N=200 properties).
■ Calculation assumptions
ADR is an estimated settled rate derived by applying a property-type correction coefficient to the lowest published plan level at each property (2 guests per room, per room, tax-inclusive). “vs same pref./type” is the property’s estimated settled ADR for January–June 2026 divided by the median estimated settled ADR for the same prefecture and same property type (=1.00). The meal premium is calculated only where a single property sells multiple meal types side by side; no comparison is made across properties.
■ Limitations and caveats
Estimated settled ADR is an estimate with a median error of approximately 7% when cross-checked against property-level disclosures from listed hotel REITs (91 properties, most recent 3 months), and differs from actual transacted prices. The review-mention tally is subject to a cap on records retrieved per prefecture, and prefectures where the tally did not complete (free drinks: Kyoto, Nara, Toyama / lounge: nine prefectures in total) are excluded from the population. The relationship between ADR and inclusive on-site food and drink is co-occurrence rather than causation, and carries a selection bias.
■ Price and ADR data
- MetroEngines Research — estimated settled ADR (January–June 2026, median by prefecture × property type), paired comparison by meal type (June 2026, all 47 prefectures, 2,041 property-observations), plan-level listed-price comparison (Shizuoka, check-in in the first half of August 2026, 97 properties)
■ Review mention data
- HotelBank Editorial Team research — analysis of guest reviews over the past 24 months (mentions of free drinks / free-flow beverages N=196 properties / mentions of on-site lounge N=200 properties)
■ Public statistics and industry reports