

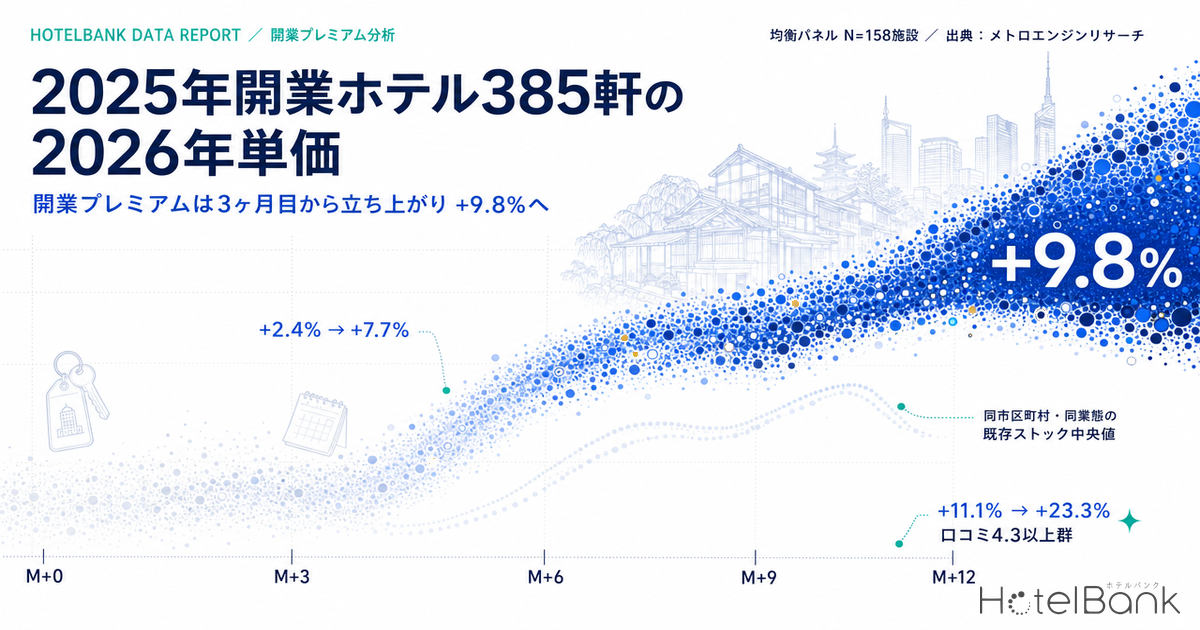
We tracked 385 accommodation properties that opened in Japan in 2025 — those with 20 or more guest rooms that have remained continuously listed on the major OTAs — and aggregated the movement of their estimated settled ADR on a relative-month basis (M+0 through M+12) anchored on their opening month. The focus is not the absolute rate but how much of a mark-up each property is able to hold over the existing stock in the same municipality and the same property type — in other words, the durability of the opening premium. To put the conclusion first: the premium does not peak immediately after opening. The median starts to build from the third month after opening, and by months 10 through 13 it had reached more than three times the level seen right after opening.
Metric Definitions Used in This Article
- ADR (Average Daily Rate): An estimated settled rate (tax-exclusive equivalent) calculated by applying a property-type correction factor to the cheapest plan level each property publishes on OTAs (double occupancy, per-room rate, tax-inclusive). Cross-checked against property-level actuals disclosed by listed hotel REITs (91 properties, most recent three months), the median error is approximately 7%. These are estimates and differ from each property’s actual transacted prices and accounting figures. Area-level ADR is the median across the properties covered (the level of a typical property in that area).
- Opening premium: The percentage gap obtained by dividing a property’s estimated settled ADR in a given month by the median estimated settled ADR of the existing stock in the same municipality and the same property type. It captures both the property’s positioning (grade differential) and its subsequent price trajectory; throughout this article we read it consistently on a median basis to limit the influence of outliers.
- Relative month (M+n): Months elapsed with the opening month as M+0. M+12 is the same month one full year after opening.
- Data sources: MetroEngines Research (estimated settled ADR) / MetroEngines Research & Consulting (opening data on an OTA-listing-confirmed basis)
- — The opening premium does not peak right after opening. The median across the 158-property balanced panel starts to build from the third month after opening and reaches +9.8% at M+12.
- — The fork concentrates at M+3. For the 80 properties (51%) that widened their mark-up by more than +3pt and the 53 (34%) that narrowed it by more than −3pt alike, the direction was set in the third month after opening.
- — Properties with 100+ rooms open at +13.4%; those with 20–49 rooms gain +7.2pt later. Box size changes how fast the ramp comes, and the 50–99 room band still has headroom for a mark-up.
- — The 56 properties with review scores of 4.3 or higher roughly doubled their mark-up, from +11.1% to +23.3%. The 35 below 4.3 stayed around the area standard (correlation, not causation).
- — 2026 openings currently stand at 1,369 properties. Rate design in the third month after opening and the initial pace of review formation become the single biggest variables determining second-year rates.
Of 1,741 properties that opened in 2025, rates can be tracked for 385
First, how the population was built. New openings in 2025 identified by MetroEngines Research & Consulting on an OTA-listing-confirmed basis number 1,741 properties, with an average of 24 rooms. By property type, the count runs to 747 vacation rentals, 265 business hotels, 122 guesthouses, 113 cottages, 99 resort hotels, 98 hostels and 59 ryokan. Vacation rentals accounting for more than 40% of the count is a recent structural feature shared with the 2026 opening cohort.
As the 24-room average indicates, however, the center of gravity on a count basis sits with very small boxes. Tracking monthly rate movements in a stable way requires a certain sales volume, so this article narrows the field to properties with 20 or more guest rooms — 385 at this stage. Of the 747 vacation rentals, only two clear the 20-room threshold, so they effectively drop out of the property-type comparison. Where this article refers to “property type” below, the scope is the five types of business hotel, resort hotel, city hotel, ryokan and capsule hotel.
From there we narrow further in stages: 323 properties for which actual estimated settled ADR values (on a confirmed-month basis) could be obtained, 224 that could be matched against a median for existing stock in the same municipality and property type, and a balanced panel of 158 covering at least 70% of M+0 through M+12. The population shrinks at each stage because this is an aggregation over the range listed on the major OTAs, not a full census.
| Narrowing stage | Properties | Condition |
|---|---|---|
| 2025 opening cohort | 1,741 | OTA-listing-confirmed basis, 24 rooms on average |
| 20 or more guest rooms | 385 | Most vacation rentals and cottages drop out here |
| Has confirmed months of estimated settled ADR | 323 | Still listed as of June–August 2026 |
| Comparison against existing stock possible | 224 | At least five comparison properties in the same municipality and property type |
| Balanced panel (the main subject of this article) | 158 | Covers at least 70% of M+0 through M+12 |
Source: MetroEngines Research & Consulting (OTA-listing-confirmed basis) / MetroEngines Research
If the set of properties changes from one relative month to the next, seasonal factors and composition effects mix together and the reading of “rates rose” or “rates fell” stops working. Every curve in this article is therefore drawn on a balanced panel that follows the same 158 properties throughout. In addition, relative months in which the number of observed properties in the panel fell below 60% of the series median (157 properties) were excluded as thin months. In practice the months excluded were M+13 onward (a sharp drop from 81 properties to 12), leaving M+0 through M+12 — the range covered by the listings — as the analysis window.
The opening premium builds from month three — median +2.4% to +7.7%
Lining up the monthly median premium for the 158-property balanced panel produces the opposite shape to what one might assume. The opening month M+0 is +1.6%, the next month +2.7% and the month after that +2.2% — the first three months after opening sit at roughly the area standard. Movement appears at M+3, where the figure jumps to +7.3%, after which it runs in a +5% to +10% range and reaches +9.8% at M+12.
Source: Compiled by the HotelBank Editorial Team from MetroEngines Research (balanced panel N=158 properties)
Smoothed into windows, the median right after opening (M+0 to M+2) is +2.4%, and months 10 through 13 — M+9 to M+12 — come to +7.7%. The median of the per-property difference was +3.1pt. In other words, the standard profile for the 2025 opening cohort is not “take a high rate at opening and then give it back,” but rather “launch at the area standard level, then start reaching for a mark-up around the turn of the first quarter.” Pricing that prioritizes opening-commemoration plans and early awareness-building is concentrated in the first three months, with rates stacked up once occupancy becomes readable — a shape that mirrors the operational sequence directly.
To check that this result does not depend on how the comparison set is drawn, we recalculated with the minimum number of existing-stock properties set to 5, 8 and 10. Panel size changes to 158, 137 and 127 properties, but the median right after opening comes to +2.4% / +2.6% / +2.6% and months 10 through 13 to +7.7% / +7.0% / +7.6% — essentially unchanged. The shape of the curve is stable with respect to the thickness of the comparison set.
Checking absolute levels as well, the panel median estimated settled ADR moves from roughly ¥10,900 right after opening to roughly ¥11,200 in months 10 through 13. The increase itself is not large, but because the comparison set over the same period (existing stock in the same municipality and property type) is gradually easing downward, the gap widens in relative position. The value of a new opening tends to show up less in the rise of the absolute rate than in where it sits against the area’s level.
51% widened the mark-up, 34% narrowed it — the interior is polarized
The median pointing upward does not mean every property moved in the same direction. Splitting the 158 properties by the premium difference between the period right after opening and months 10 through 13 produces a clear division: 80 properties (51%) expanded by more than +3pt, 25 (16%) were flat within ±3pt, and 53 (34%) contracted by more than −3pt. The number sitting above the area standard in months 10 through 13 was 93 properties (59%).
Source: Compiled by the HotelBank Editorial Team from MetroEngines Research (balanced panel N=158 properties)
For the 53 properties whose mark-up narrowed, taking the first relative month in which they fell below their immediate post-opening level for two consecutive months gives a median of M+3; 26 of the 53 concentrate at M+3. The point that properties whose premium grows and those whose premium shrinks share the same fork in the third month is suggestive. At the quarter mark after opening, the decision to switch from initial promotion to normal operation enters the picture. Whether the swing there is up or down largely determines the position for the following year.
Put the other way round, the opening premium neither evaporates automatically nor persists automatically. What matters is what has been put in place around M+3 — this is a story about opportunity.
By room count — 100+ rooms mark up from the start, 20–49 rooms grow later
Splitting by room count into three bands separates the curves clearly. The 100+ room band (74 properties) enters at an already high +13.4% in the opening month, holds a +9% to +14% range and lands at +12.8% at M+12 — a profile that combines a fast ramp with a high level. Large projects tend to land on prime sites in front of stations or in commercial districts, and their specifications are new, so the gap against existing stock shows up in price from the first month of operation.
By contrast, the 20–49 room band (44 properties) tracks at roughly ±0% through the third month after opening, then builds from M+4 to reach +12.3% at M+12. The median difference from right after opening to months 10 through 13 was +7.2pt, the largest of the three groups. Small boxes are the type that stack their mark-up over time. The 50–99 room band (40 properties) has moved steadily in line with the area standard, meaning the mark-up the other two groups are capturing remains as untapped headroom.
Source: Compiled by the HotelBank Editorial Team from MetroEngines Research (20–49 rooms N=44, 50–99 rooms N=40, 100+ rooms N=74)
| Room count | Properties | Right after opening M+0 to M+2 |
Months 10–13 M+9 to M+12 |
Difference (median by property) |
|---|---|---|---|---|
| 20–49 rooms | 44 | −1.4% | +6.8% | +7.2pt |
| 50–99 rooms | 40 | −2.1% | −0.2% | +4.4pt |
| 100+ rooms | 74 | +9.5% | +11.6% | +1.1pt |
Source: Compiled by the HotelBank Editorial Team from MetroEngines Research (median percentage gap against the median for existing stock in the same municipality and property type)
Narrowing to business hotels alone does not change the structure: 20–49 rooms (28 properties) go from −11.1% to +3.2%, 50–99 rooms (32 properties) from −0.1% to −0.8%, and 100+ rooms (58 properties) from +18.5% to +14.9%. The difference in how the ramp arrives by size holds across property types.
By property type — resort hotels gain the most, ryokan reach the highest level
The panel breaks down by property type into 118 business hotels, 16 resort hotels, 14 city hotels and 10 ryokan. Because samples outside business hotels are small, we compare them across the two windows of right-after-opening and months 10 through 13 rather than by monthly curve.
Source: Compiled by the HotelBank Editorial Team from MetroEngines Research (business N=118, resort N=16, city N=14, ryokan N=10)
The largest gain came from resort hotels, moving from −7.4% right after opening to +1.5% in months 10 through 13. On the median of per-property differences the figure was +12.6pt, the largest of the four types (the difference between window medians and the median of per-property differences do not coincide). Resorts find it hard to arrive at optimal rate design without going once around the seasons of their opening year; pricing for peak periods clicks into place in the second year. The highest level reached was ryokan at +9.5%, followed by city hotels at +8.2% and business hotels at +7.7%. All four property types reach positive territory by months 10 through 13 — a common thread.
The monthly curve for the 118 business hotels lifts in stages, from +5.2% at M+0 to +7.9% at M+3, +11.0% at M+5 and +11.6% at M+7, ending at +10.9% at M+12. With a thicker sample the shape is smoother, showing that the main driver of the overall curve is the business hotel group. The combined 40-property series for resorts, city hotels and ryokan sits at roughly 0% from M+0 to M+4, then builds gently to +1% to +5% from M+5. The less business-oriented the type, the longer the ramp takes — a tendency consistent with the behavior of small boxes seen in the room-count breakdown.
Looking at individual properties, those that widened their mark-up substantially share a clear trait. yugen kyoto shijo in Shimogyo-ku, Kyoto (58 rooms) went from +53% right after opening to +266% in months 10 through 13; &Here OSAKA NAMBA in Chuo-ku, Osaka (89 rooms) from +89% to +219%; and HANARE by Tokyu Stay in Nakagyo-ku, Kyoto (42 rooms) from +70% to +169%. Oshu Hiraizumi Onsen Ryokan ITSUMU (奥州・平泉温泉旅館 ITSUMU) in Oshu, Iwate (42 rooms) also grew from +118% to +215%. All are compact boxes of 29 to 89 rooms with a product character clearly distinct from the standard property-type category for their area. They are concrete evidence that where distinctiveness stands up, small scale can be more than offset through price.
Source: Compiled by the HotelBank Editorial Team from MetroEngines Research (percentage gap against the median for existing stock in the same municipality and property type; room counts on an OTA-listing-confirmed basis)
Fukuoka’s seven properties — median from +2.6% to +23.9%
Within the 2025 opening cohort, Fukuoka Prefecture accounts for 62 properties (seven of which sit in the balanced panel at 20+ rooms). The median premium for these seven moved from +2.6% right after opening to +23.9% in months 10 through 13, well ahead of the national median (+2.4% to +7.7%). Four of them are concentrated in Chuo-ku, Fukuoka City, where supply moving in step with the urban restructuring driven by Tenjin Big Bang and Hakata Connected is delivering results on the pricing side as well. Rate growth across the area as a whole has entered a slowing phase, and we break down its components in Fukuoka’s estimated settled ADR slows from +14.4% to +3.6%.
| Property | Rooms | Area | Right after opening | Months 10–13 |
|---|---|---|---|---|
| ONE FUKUOKA HOTEL | 41 | Chuo-ku, Fukuoka City | +180% | +184% |
| BAND HOTEL HAKATA | 29 | Chuo-ku, Fukuoka City | +83% | +136% |
| The Gate Hotel Fukuoka by HULIC (ザ・ゲートホテル福岡 by HULIC) | 171 | Chuo-ku, Fukuoka City | +2% | +42% |
| Hotel Reference Kokura Ekimae (ホテルリファレンス小倉駅前) | 52 | Kokurakita-ku, Kitakyushu City | +11% | +24% |
| Iyashidokoro Hotel Kanraku Kurume Ekimae (いやし処ほてる寛楽 久留米駅前) | 85 | Kurume City | +3% | +12% |
Source: Compiled by the HotelBank Editorial Team from MetroEngines Research (the five of Fukuoka Prefecture’s seven balanced-panel properties in positive territory in months 10–13; percentage gap against the median for existing stock in the same municipality and property type)
Worth noting is the 171-room The Gate Hotel Fukuoka by HULIC, which starts from an area-standard position of +2% right after opening and lifts to +42% in months 10 through 13. Large projects do not necessarily enter at a high rate from the first month; this shows that a design that runs the launch period at the area standard and stacks rates once awareness has formed is equally viable.
Review formation and rate retention — the 4.3-and-above group doubles its mark-up
As shown in our earlier article “New hotel review scores rise +0.38pt in two months,” ratings for newly opened properties build rapidly right after opening. In this cohort too, aggregating the 264 properties whose reviews begin in or after the opening month, the median monthly score rises gently from 4.23 in the opening month to 4.33 in the third month, 4.35 in the eighth month and 4.40 in the tenth. Across the 218 properties that can be compared within themselves, the average right after opening (M+0 to M+2) of 4.25 compares with 4.36 in months 6 through 11 — a median of +0.08pt, with 59% of properties improving their score.
Source: HotelBank Editorial Team research (264 properties in the 2025 opening cohort whose reviews begin in or after the opening month; months with three or more reviews aggregated)
Overlaying the pricing side reveals a clear correspondence. Within the balanced panel, the 56 properties with a review score of 4.3 or higher in months 6 through 11 saw their median premium move from +11.1% right after opening to +23.3% in months 10 through 13 — roughly doubling the mark-up. The 35 properties that did not reach 4.3, meanwhile, tracked around the area standard (−4.9% to −4.6%); their median per-property difference of +4.3pt is an improvement, but the gap in level actually widens from right after opening through months 10 to 13.
This is of course a correlation and does not demonstrate that reviews causally push rates up. The natural reading is that properties with strong products to begin with earn both high ratings and high rates at the same time. The practical implication is nonetheless clear: how far ratings have accumulated ahead of the M+3 pricing fork is linked to the size of the subsequent headroom for a mark-up. Resources put into review formation in the first quarter after opening are also preparation for pricing strategy.
Source: Compiled by the HotelBank Editorial Team from MetroEngines Research (reviews 4.3 and above N=56, below 4.3 N=35)
Three conditions for extending the opening premium
What emerges from the second year of the 158-property 2025 opening cohort is that the opening premium is not “an asset you hold at opening that erodes with time.” On a median basis the mark-up builds from the third month and is wider, not narrower, a year later. On that basis, the conditions separating the group that grew from the group that stayed flat can be organized into three.
First, the design of M+3. For the 80 properties that widened their mark-up and the 53 that narrowed it alike, the fork concentrated in the same third month after opening. What matters is whether the timing of the transition away from opening-commemoration plans has been designed in advance, and whether it has been decided which demand dates revert to normal rates. Put the other way round, drawing a rate calendar covering three months before opening makes it possible to take this fork actively.
Second, setting expectations according to scale. Properties with 100+ rooms can enter at around +13% from the opening month, while those with 20–49 rooms start the first three months at roughly the area standard. For a small box, seeing no premium right after opening is within expectations, and building the annual revenue plan on the premise of reaching +12% from M+4 onward fits reality better. The 50–99 room band moves steadily in line with the area standard, making it the territory where the mark-up the other two groups are capturing remains as untapped headroom.
Third, front-loading review formation. The group that reached a review score of 4.3 or higher in months 6 through 11 widened its mark-up from +11.1% to +23.3%. Ratings accumulate fastest right after opening, and that period overlaps with M+3, the pricing fork. Investment in operational quality in the early opening period feeds directly into the second-year rate position.
That said, supply accumulating does not necessarily push down an area’s rates. In Does new hotel supply cut ADR?, verified across all 47 prefectures, supply pressure moved rates only in prefectures with thin stock. New openings in 2026 currently stand at 1,369 properties (OTA-listing-confirmed basis, 26 rooms on average), and since listings appear several months before opening the count is expected to rise further. If the 2026 opening cohort follows the same path, then for properties now in the final stage of opening preparation, rate design in the third month after opening and the initial pace of review formation are the single biggest variables determining second-year rates.
Methodology and caveats
The subject is the 385 accommodation properties with 20 or more guest rooms among those confirmed to have opened in 2025. Opening dates are on an OTA-listing-confirmed basis and may include rebrands of existing properties and reopenings following full renovation. In the review aggregation, properties with reviews dating from two months or more before the opening month are excluded, which limits the inclusion of rebrand cases.
Estimated settled ADR uses only confirmed months (on an actuals basis) and includes no estimates derived from listed prices for future months. Comparison sets for existing stock are limited to cells where estimated settled ADR can be calculated for five or more properties in the same municipality and property type. The comparison set does include the new properties under analysis themselves, but because it is median-based the effect is limited, and sensitivity analysis raising the minimum property count to 8 and 10 did not change the conclusions.
Note that the aggregation in this article is an analysis over the range listed on the major OTAs and is not a full census. Properties not listed on OTAs, and those operated primarily through direct sales, are not included. On the macro supply-demand backdrop, the Japan Tourism Agency’s Overnight Travel Statistics Survey puts the 2025 room occupancy rate at 61.8% (+2.2pt year on year), a continuing improvement — worth adding as the underlying condition that allows newly opened properties to reach for a mark-up.
Related Articles
- New Hotel ADR Ramp-Up: 91 Japan Openings Split Into 4 Pricing Types
- New Hotel Reviews Rise +0.38pt in 2 Months: 1,728 Japan 2025 Openings
- 1,002 New Japan Openings H1 2026: ADR 1.14x, Ryokan Lag +18.8pt
- Does New Hotel Supply Cut ADR? Only Below 13,000 Rooms, 47 Prefectures
- Hotel Supply Pressure Ranking 2026-2027: Ozu Kumamoto Tops at 30.8%
- Fukuoka Settled ADR Slows +14.4% to +3.6% — Breakfast Premium Next?
- Hotels at Year 10: The Renovation Gap Is +13.6% Below 100 Rooms
References & Sources
■ Market data
- MetroEngines Research — estimated settled ADR (2025 opening cohort, 385 properties / balanced panel 158 properties; confirmed months from January 2025 to August 2026)
- MetroEngines Research & Consulting — new opening data (OTA-listing-confirmed basis; 1,741 properties in 2025 / 1,369 properties in 2026)
- HotelBank Editorial Team research — monthly aggregation of guest review scores (264 properties)
■ Government statistics and public data