

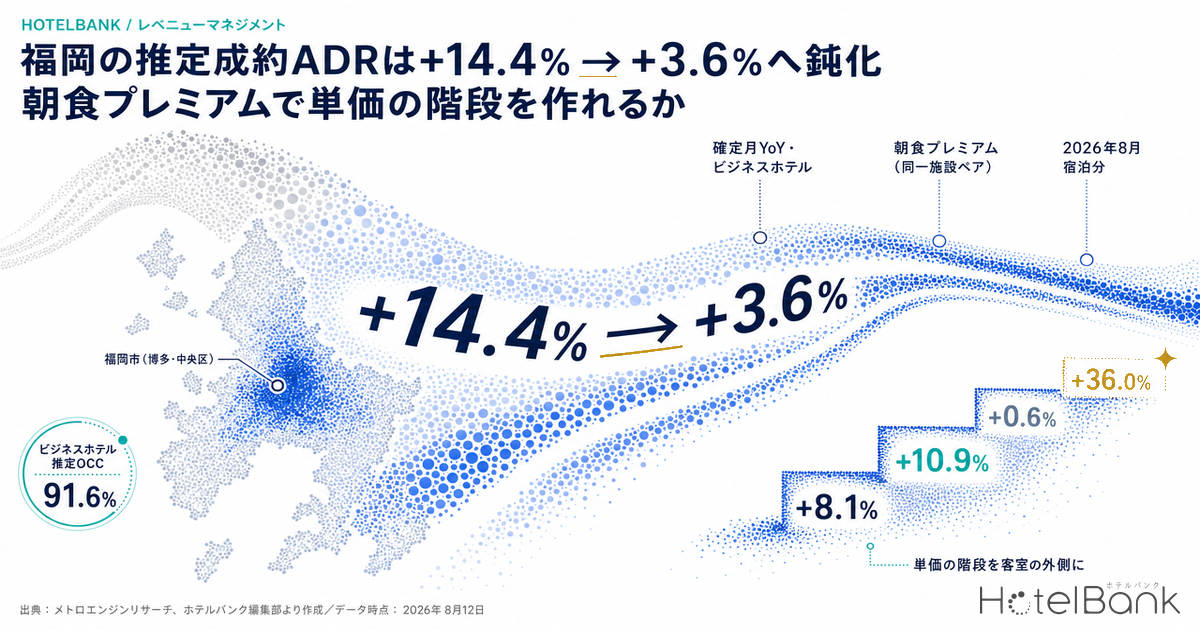
In Fukuoka Prefecture, the estimated settled ADR for business hotels rose +14.4% year on year in January 2026 (N=338 properties), but by July 2026 — the most recent finalized month — that growth had fallen to +3.6% (N=340 properties). City hotels followed the same path, from +28.8% (N=38 properties) to +3.1% (N=40 properties). The angle of the growth curve has clearly flattened. Occupancy, however, has not weakened. Estimated OCC (OTA listed-inventory basis) for July 2026 stood at a high 91.6% for business hotels and 91.0% for city hotels in the prefecture. Rooms are selling, yet rate growth alone is thinning out — a phase that signals limited remaining headroom for pushing room rates higher, and one in which the question becomes whether the next step up in unit price can be built outside the guest room, in ancillary products.
This article therefore isolates only those properties that sell both room-only and room-with-breakfast plans within the same hotel, and looks at the differential ratio within each property — the breakfast premium. As of August 2026, city hotels in Fukuoka Prefecture post +18.6% (30 paired properties), above the national median of +14.4%, while business hotels come in at +8.1% (145 paired properties), below the national median of +9.9% and ranking 33rd of 47 prefectures, on par with Mie and Kagawa. Within a single prefecture, the two segments are building their pricing staircases in opposite ways.
Scope: city hotels in Fukuoka Prefecture (estimated settled ADR N=40 properties) and business hotels (N=340 properties); breakfast premium measured on same-property pairs, 30 city and 145 business properties (August 2026). The price metric in this article is estimated settled ADR (the transacted price level estimated from OTA and other sales data, tax-exclusive equivalent), and occupancy is an estimate on an OTA listed-inventory basis. Definitions for both appear at the end of the article. Ryokan are excluded from the analysis because half-board is their default and their price structure differs. Data as of August 12, 2026.
- — +14.4%→+3.6% YoY growth in estimated settled ADR for Fukuoka business hotels decelerated between January and July 2026. City hotels moved from +28.8% to +3.1% (finalized months in both cases).
- — 91% range Estimated OCC (OTA listed-inventory basis) for July 2026 was 91.6% for business hotels and 91.0% for city hotels. Inventory is not going unsold, which leaves little room to push through on rate alone.
- — +8.1% vs +9.9% The breakfast premium (same-property pairs, August 2026 stays) puts business hotels 1.8pt below the national median, 33rd of 47 prefectures. City hotels sit at +18.6%, 10th of 44 prefectures.
- — +10.9% / +0.6% The prefecture-wide +8.1% is not a Fukuoka City number. Hakata Ward is +10.9% and Chuo Ward +11.3%, against Kokurakita Ward at +0.6%. Benchmark against your location band, not the prefecture.
- — +36.0% Breakfast is not the top step. Half-board versus room-only runs +36.0% for business hotels (37 paired properties) and +44.4% for city hotels (17 paired properties) within the prefecture.
Occupancy stays high while rate growth flattens out
Start with the estimated settled ADR for Fukuoka business hotels, comparing finalized months year over year. In 2025 the line climbed from the ¥9,000 range in January to ¥12,400 in November. In 2026 it built from ¥10,300 in January to ¥11,700 in April, then came in at ¥10,000 in June and ¥10,400 in July — levels still above the prior year, but with the size of the upside narrowing.
Source: MetroEngines Research, compiled by the HotelBank Editorial Team
Converted to year-on-year terms, the deceleration is even clearer. Business hotels posted double-digit growth at +14.4% in January and +18.9% in April, then fell to +6.5% in June and +3.6% in July. City hotels went from a large +28.8% in January to +2.2% in April, +1.2% in June and +3.1% in July — essentially flat from spring onward. Averaged across January to July, business hotels are up +9.9% and city hotels +9.7%, so the first half built a substantial cushion; but over the last two months, both segments are stuck in single digits. For how to reset price ranges after a phase in which all six months of the first half beat the prior year, see Fukuoka Settled ADR +10.9% in H1 2026 While Osaka Falls 32.8% in June.
Source: MetroEngines Research, compiled by the HotelBank Editorial Team
| Stay month | Business 2025 | Business 2026 | YoY | City 2025 | City 2026 | YoY |
|---|---|---|---|---|---|---|
| January | ¥9,033 | ¥10,332 | +14.4% | ¥15,198 | ¥19,571 | +28.8% |
| February | ¥10,510 | ¥11,076 | +5.4% | ¥15,840 | ¥17,736 | +12.0% |
| March | ¥9,890 | ¥10,983 | +11.1% | ¥15,408 | ¥17,937 | +16.4% |
| April | ¥9,874 | ¥11,738 | +18.9% | ¥17,506 | ¥17,899 | +2.2% |
| May | ¥10,456 | ¥11,497 | +10.0% | ¥17,717 | ¥18,846 | +6.4% |
| June | ¥9,414 | ¥10,030 | +6.5% | ¥15,818 | ¥16,011 | +1.2% |
| July | ¥10,023 | ¥10,382 | +3.6% | ¥16,106 | ¥16,608 | +3.1% |
Source: MetroEngines Research, compiled by the HotelBank Editorial Team / N = 338–341 business and 38–40 city properties (2026); 324–331 business and 36–37 city properties (2025)
Demand itself is not weak. Averaging estimated OCC (OTA listed-inventory basis) for July 2026 by day of week, business hotels in the prefecture ran 95.9% on Saturdays, 92.5% on Thursdays and 92.5% on Tuesdays, against 86.0% on Mondays and 86.8% on Sundays. City hotels show the same shape, at 94.9% on Saturdays and 92.4% on Fridays versus 86.1% on Mondays — inventory disappears from the back half of the week into the weekend in both segments. The month’s high was Saturday, July 18, at 98.3% for business hotels; the low was Sunday, July 5, at 82.7%. In other words, inventory is selling well, and in a phase where pushing through on rate has become difficult, what remains is the design question of how to add to per-night unit price outside the guest room.
Breakfast premium — city hotels rank nationally, business hotels sit below the median
The breakfast premium used here is the differential between room-only and room-with-breakfast within the same hotel, expressed as a ratio. Rather than a simple average across all properties, it extracts only those properties that actually sell both room-only and room-with-breakfast plans as pairs, and aggregates the difference inside each property. Because differences in property class, location and price band cannot contaminate the figure, it is the metric closest to “how big a step up am I actually building when I attach breakfast at my own hotel.” Ryokan are excluded from this comparison, since half-board is their default and their price structure is fundamentally different.
As of August 2026, Fukuoka Prefecture city hotels sit at +18.6% (30 paired properties), 4.2pt above the national median of +14.4% (44 prefectures with five or more pairs), ranking 10th of 44. Business hotels, by contrast, are at +8.1% (145 paired properties), 1.8pt below the national median of +9.9% (47 prefectures), ranking 33rd of 47 (+8.1% puts them level with Mie and Kagawa). This is a market with the fourth-largest number of business hotel pairs in the country at 145 properties, yet the height of its staircase sits in the lower half.
Source: MetroEngines Research, compiled by the HotelBank Editorial Team
Lining up four months, city hotels have been stable in the 17–19% band, from +17.3% in May 2026 (27 paired properties) to +18.6% in August (30 paired properties). Business hotels, meanwhile, have stepped down: +10.2% in May (132 pairs) and +10.2% in June (137 pairs), then +9.1% in July (146 pairs) and +8.1% in August (145 pairs). In a phase where room rate growth is slowing, the business segment is seeing the ancillary ratio thin out at the same time.
Placing Fukuoka alongside other large markets clarifies its position. Seven markets nationwide have more than 100 business hotel pairs: Tokyo at +13.3% (361 pairs), Aichi at +13.0% (143 pairs), Osaka at +10.9% (164 pairs) and Hokkaido at +9.4% (196 pairs), against Fukuoka at +8.1% (145 pairs), Kanagawa at +6.9% (102 pairs) and Shizuoka at +5.0% (132 pairs). Fukuoka ranks fifth of the seven, short of the three major metropolitan areas and Hokkaido. Prefecture-level earning power from breakfast and dinner varies widely across Japan, and the picture above is the practical way to locate where your own prefecture sits.
| Area | Business hotels | Paired properties | City hotels | Paired properties |
|---|---|---|---|---|
| Fukuoka | +8.1% | 145 | +18.6% | 30 |
| Tokyo | +13.3% | 361 | +17.2% | 65 |
| Osaka | +10.9% | 164 | +17.1% | 57 |
| Aichi | +13.0% | 143 | +10.2% | 24 |
| Hokkaido | +9.4% | 196 | +18.1% | 50 |
| National median | +9.9% | 47 prefectures | +14.4% | 44 prefectures |
Source: MetroEngines Research, compiled by the HotelBank Editorial Team / The national median is the median across prefecture segments with five or more paired properties
The prefecture-wide +8.1% is not “the Fukuoka City number”
This is the point that matters most in practice: using the prefecture-level aggregate as your own benchmark leads to the wrong call. Breaking August 2026 stays down to the municipal and ward level, the business hotel breakfast premium is +10.9% in Hakata Ward (56 paired properties) and +11.3% in Chuo Ward (28 paired properties) — both 2 to 3pt above the prefecture-wide +8.1%. Kokurakita Ward, by contrast, is at +0.6% (15 paired properties), meaning the gap between room-only and room-with-breakfast has all but vanished. The main reason the prefecture average sits below the national median lies not in central Fukuoka City but in the structure of the rest of the prefecture.
| City / ward | Business hotels | Paired properties | All hotels | Paired properties |
|---|---|---|---|---|
| Hakata Ward | +10.9% | 56 | +12.3% | 63 |
| Chuo Ward | +11.3% | 28 | +12.6% | 35 |
| Kokurakita Ward | +0.6% | 15 | +10.5% | 19 |
| Kurume City | +8.8% | 7 | +16.1% | 11 |
| Fukuoka Prefecture total | +8.1% | 145 | +11.4% | 184 |
Source: MetroEngines Research, compiled by the HotelBank Editorial Team / Only cities and wards with five or more paired properties are listed. “All hotels” is the total of hotel-format properties including city and business hotels (ryokan excluded)
The staircase does not end at breakfast. For the same August 2026 stays, the premium for half-board (breakfast plus dinner) over room-only is +44.4% at city hotels (17 paired properties) and +36.0% at business hotels (37 paired properties). Measured as the increment on top of room-with-breakfast, half-board adds +21.0% at city hotels (17 pairs) and +28.4% at business hotels (51 pairs). Business hotels also show a +18.7% premium over room-only for dinner-only plans (12 pairs). Pair counts here are far smaller than for breakfast, and the number of properties in the prefecture operating a two-meal model is limited — but it is worth noting that designs which do not stop at the single breakfast step genuinely exist. For a detailed example of the same paired-property method used to break the step heights down by segment, see Oita Meal Premiums: Business Breakfast +10.6%, Half-Board +39.3%.
What the step is worth per month — three scenarios and a two-axis model
Now to translate these figures into a form that connects to your own P&L. The base amount is the average room-only rate of ¥18,740 (total for two people in one room) for Fukuoka Prefecture business hotels on August 2026 stays (145 same-property pairs). The uplift is calculated as “base amount × breakfast premium rate × breakfast-inclusive attach rate.” The premium rate is the observed market value; the attach rate is a variable you should replace with your own property’s actuals when reading.
Three scenarios are set for the premium rate. The pessimistic case is +6.0%, assuming the decline of the last four months (from +10.2% in May 2026 to +8.1% in August, roughly 0.7pt per month) continues for another three months. The base case holds the prefecture’s observed +8.1%. The optimistic case is a recovery to the national median of +9.9%. Hakata Ward’s observed +10.9% is shown alongside as an upper reference point.
| Scenario | Assumption | Premium rate | Uplift per room-night | 100 rooms × 30 nights |
|---|---|---|---|---|
| Pessimistic | Decline of the last four months (-0.7pt/month) continues for three months | +6.0% | ¥450 | ¥1,350,000 |
| Base | Prefecture’s observed value for August 2026 stays holds | +8.1% | ¥607 | ¥1,821,000 |
| Optimistic | Recovery to the national median level | +9.9% | ¥742 | ¥2,226,000 |
Source: MetroEngines Research, compiled by the HotelBank Editorial Team / Base amount and premium rates are observed values for August 2026 stays; the 40% attach rate and the levels of the three scenarios are modelling assumptions
The gap between pessimistic and optimistic is ¥292 per room-night, or ¥876,000 per month at 100 rooms × 30 nights. That spread opens on the ancillary side alone, without moving the room rate at all. Next, take premium rate and breakfast attach rate as two axes to see the sensitivity.
| Premium rate \ Attach rate | 20% | 30% | 40% | 50% | 60% |
|---|---|---|---|---|---|
| Kokurakita Ward, observed +0.6% | ¥22 | ¥34 | ¥45 | ¥56 | ¥67 |
| Pessimistic (decline continues) +6.0% | ¥225 | ¥337 | ¥450 | ¥562 | ¥675 |
| Prefecture observed (base) +8.1% | ¥304 | ¥455 | ¥607 | ¥759 | ¥911 |
| National median (optimistic) +9.9% | ¥371 | ¥557 | ¥742 | ¥928 | ¥1,113 |
| Hakata Ward, observed (upper reference) +10.9% | ¥409 | ¥613 | ¥817 | ¥1,021 | ¥1,226 |
Source: MetroEngines Research, compiled by the HotelBank Editorial Team / Premium rates are observed values for August 2026 stays (Kokurakita Ward 15 pairs, prefecture 145 pairs, Hakata Ward 56 pairs, national median across 47 prefectures); the attach rate is a modelling variable
There are two ways to read this. First, raising the attach rate by 20pt and raising the premium rate by 2pt have almost the same effect (at the prefecture’s observed +8.1%, moving the attach rate from 40% to 60% takes you from ¥607 to ¥911; holding the attach rate at 40% and moving from +8.1% to +10.9% takes you from ¥607 to ¥817). Whether you start with how you sell or how you price is determined by your breakfast seating capacity and food cost. Second, at Kokurakita Ward’s +0.6%, stacking the attach rate all the way to 60% still yields only ¥67 per room-night. The order of operations is to confirm that the rate itself stands up before moving the attach rate.
For revenue managers running city and business hotels in Fukuoka — implications and action plan
(1) Rebuild your plan on the assumption that the “push on rate” phase has ended for now. On a finalized-month YoY basis, business hotel estimated settled ADR growth narrowed from +14.4% in January to +3.6% in July, and city hotels from +28.8% to +3.1%. Levels in the first half remain above the prior year, so this is no justification for discounting — but budgets for the remaining months built on the premise of a market that absorbs double-digit increases deserve a review against the single-digit readings of the last two months.
(2) Occupancy is already there. Prioritize measures that add a step to unit price over measures that fill rooms. Estimated OCC (OTA listed-inventory basis) for July 2026 was 91.6% for business hotels and 91.0% for city hotels, and even the weakest day of the week, Monday, ran 86.0% (business). There is little need to discount inventory to fill it, while the prefecture-wide breakfast premium for business hotels is +8.1%, below the national median of +9.9%. If the gap between room-only and room-with-breakfast at your property is thinner than the prefecture’s +8.1%, the upside is likely to be on the product design side first.
(3) Benchmark against your location band, not the prefecture. Within the same August 2026 stays, Hakata Ward is +10.9% and Chuo Ward +11.3% against Kokurakita Ward at +0.6% — the height of the staircase varies enormously inside one prefecture. If a property in central Fukuoka City judges itself “good enough” against the prefecture’s +8.1%, it risks leaving the staircase one step lower than the surrounding market.
(4) The gap between segments is itself a map of your own headroom. Within a single prefecture, city hotels at +18.6% (above the national median of +14.4%) coexist with business hotels at +8.1% (below the national median of +9.9%). That gap cannot be explained by differences in breakfast food cost alone; it points to room for operational variables such as how the price is presented, service hours and seating design. The staircase a higher segment manages to build in the same market is worth examining even from a different segment.
(5) Breakfast is not the top step. Against room-only, half-board runs +44.4% at city hotels (17 pairs) and +36.0% at business hotels (37 pairs), and as an increment on top of room-with-breakfast it is +21.0% for city and +28.4% for business. Pair counts are limited, so this cannot be generalized — but the option of not stopping the design at the breakfast step genuinely exists within the prefecture.
| Horizon | Action | Trigger | Objective |
|---|---|---|---|
| Today–this week | Recalculate your own room-only vs. room-with-breakfast differential ratio for the same date and same room type | If the ratio you calculate falls below the prefecture’s business hotel +8.1% (145 pairs) | Confirm the gap between the market’s staircase and your own in numbers first |
| Today–this week | Switch your location-band benchmark from the prefecture value to the city/ward value | If your property is in Hakata or Chuo Ward and your comparison base is still the prefecture’s +8.1% (those wards run +10.9% / +11.3%) | Avoid the error of judging yourself “good enough” against a base below local reality |
| Within two weeks | Cross-check breakfast plan attach rate against your breakfast service capacity ceiling | If breakfast seating hits its ceiling on the high estimated-OCC days of July 2026 (business hotels: Saturday 95.9%, Thursday 92.5%) | Understand the physical selling ceiling before moving price |
| Within two weeks | Consider a design that varies breakfast-plan messaging intensity by day of week | If the July 2026 estimated OCC gap between Monday 86.0% / Sunday 86.8% and Saturday 95.9% is reproduced at your property | Defend unit price with something other than rate on days when inventory loosens |
| Toward next month | Redraw the autumn–year-end pricing calendar to cover plan composition, not room rate alone | If the fact that the latest finalized month narrowed to +3.6% (business) and +3.1% (city) is not yet built into your assumptions for the remaining months | Replace a rate-dependent unit price plan with a design that includes ancillaries |
| Toward next month | Identify whether a step above breakfast (dinner, in-house spend and so on) is feasible | If your breakfast premium already exceeds the prefecture value and no next step exists at your property (half-board in the prefecture: city +44.4%, business +36.0%) | Weigh the option of not stopping the staircase at one step, referenced against levels that actually exist |
Source: MetroEngines Research, compiled by the HotelBank Editorial Team
Conclusion — three yardsticks
Fukuoka’s situation offers three reusable yardsticks for judging whether it is time to switch how you build unit price.
Yardstick 1: measure rate headroom by the angle of finalized-month YoY. Not whether the level is above last year, but how far the growth rate has narrowed. In Fukuoka, business hotels went from +14.4% in January to +3.6% in July, and city hotels from +28.8% to +3.1%. When the angle flattens, it is a signal to look for variables other than rate.
Yardstick 2: if occupancy stays high while growth slows, the problem is product design, not demand. Estimated OCC for July 2026 was 91.6% for business hotels and 91.0% for city hotels. The combination of nothing going unsold and unit price failing to grow points to a phase in which you should question the composition of what you sell, not the ceiling on your pricing.
Yardstick 3: measure the ancillary staircase with “same-property pairs × your own location band,” not the prefecture value. Fukuoka Prefecture business hotels are at +8.1% overall, but the range runs from +10.9% in Hakata Ward and +11.3% in Chuo Ward to +0.6% in Kokurakita Ward. What your property should compare itself against is not the prefecture average but the level among properties facing the same design decisions in the same trade area.
About the data
• Definition of estimated OCC: occupancy on an OTA listed-inventory basis = 100 − 100 × unsold rooms listed on OTAs ÷ total guest rooms. This is an estimate based on the absorption of inventory sold on OTAs, and its definition differs from actual room occupancy (it reads higher). The estimated OCC in this article is the average of daily values for July 2026 stays in Fukuoka Prefecture (business hotels: 29 days with sufficient observation, 303–317 properties observed / city hotels: 30 days, 35–36 properties).
• Definition of estimated settled ADR: the transacted price level (tax-exclusive equivalent) estimated from OTA and other sales data (lowest-plan levels × segment-specific coefficients, ensembled across multiple channels). Past months are finalized values; the current and future months are estimates based on sales conditions at the present time. Cross-checking against published operating results gives a median error of 6.6%. Year-on-year comparisons are calculated only between finalized months; estimates from August 2026 onward are not used for comparison against the prior year.
• Definition of the breakfast premium: the value obtained by extracting only those properties that sell both room-only and room-with-breakfast (and half-board) plans within the same hotel, and expressing the differential inside each property as a ratio. It is a paired comparison in which differences in property attributes cannot intrude, and it differs from a simple average across all properties. The aggregation covers the city, business, resort and deluxe hotel formats; ryokan are excluded because half-board is their default and their price structure differs. “All hotels” in this article refers to the total of those hotel formats. Figures for August 2026 stays are based on sales conditions at the present time and may change.
• Breakdown of N: for estimated settled ADR, Fukuoka Prefecture business hotels N=338–341 properties (2026) and N=324–331 properties (2025); city hotels N=38–40 properties (2026) and N=36–37 properties (2025). For the breakfast premium on August 2026 stays: city hotels 30 pairs, business hotels 145 pairs, all hotels 184 pairs. The national median is the median across prefecture segments with five or more pairs (47 for business, 44 for city). City and ward figures cover only those with five or more pairs.
• Data as of: August 12, 2026. Sales conditions and inventory change daily, so the figures in this article are a snapshot at the time of retrieval.
■ Data sources
MetroEngines Research proprietary aggregation (time series of OTA public rates and listed inventory). Estimated settled ADR is from monthly area aggregation (Fukuoka Prefecture, city and business hotel segments, finalized months from January 2025 to July 2026); the breakfast premium is from same-property pair aggregation by meal condition (May–August 2026 stays, at both prefecture and city/ward granularity, with Tokyo, Osaka, Aichi, Hokkaido, Kanagawa and Shizuoka plus all 47 prefecture segments as comparison references); estimated OCC is the daily OTA listed-inventory absorption rate (Fukuoka Prefecture, July 2026 stays). Retrieved August 12, 2026.
■ Modelling assumptions
The uplift figures in Tables 5 and 6 use the ¥18,740 average room-only rate (total for two people in one room) for Fukuoka Prefecture business hotels on August 2026 stays (145 same-property pairs) as the base amount, calculated as “base amount × breakfast premium rate × breakfast attach rate.” Of the three scenarios, the pessimistic case is +6.0%, assuming the decline of the last four months (roughly 0.7pt per month) continues for three months; the base case holds the prefecture’s observed +8.1%; the optimistic case assumes recovery to the national median of +9.9%. The breakfast attach rate (20–60%) is not a market observation but a modelling variable to be replaced with your own property’s actuals. The 100 rooms × 30 nights conversion is a simple full-occupancy calculation and does not factor in occupancy.
■ Limitations and caveats
Estimated settled ADR is an estimate carrying a median error of 6.6% against published operating results, and estimated OCC reads higher than actual room occupancy because it is based on OTA listed inventory. The breakfast premium depends on the extraction condition “properties that actually sell both room-only and room-with-breakfast,” and segments with few pairs (Kurume City with 7 properties, dinner-only with 12, city hotel half-board with 17 and so on) are easily influenced by a small number of properties. Figures for August 2026 stays are based on sales conditions at the present time and may change. This article describes observed market results and does not demonstrate causation; nor does a higher or lower breakfast premium in itself imply superior or inferior profitability. Ryokan are excluded throughout because half-board is their default and their price structure differs.