

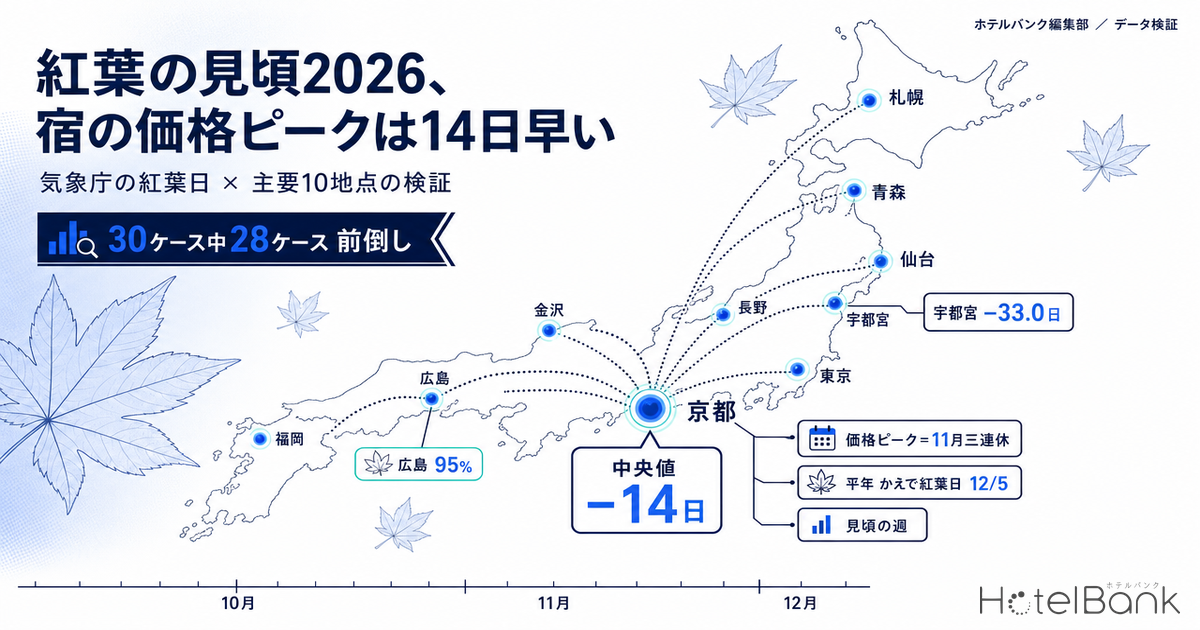
The date the autumn leaves reach their best and the date hotel prices peak are not the same day. Cross-referencing the Japan Meteorological Agency’s (JMA) phenological observation of the maple leaf-colouring date — recorded continuously at weather stations nationwide — against the daily listed-price curve of each station’s lodging market for three years, from 2024 to 2026, the price peak stood a median of 14 days earlier than the leaf-colouring date. In 28 of 30 cases (10 locations x 3 years) the price peak came first. This article quantifies that gap location by location, using the meteorological observation date as the anchor, and examines how much room there is to shift the pricing calendar later.
Metric Definitions Used in This Article
- Maple leaf-colouring date (かえで紅葉日): In the JMA’s phenological observation programme, the first day on which the leaves of each weather station’s specimen maple tree are observed to have turned essentially entirely red. The normal value is the 30-year average for 1991-2020 (the JMA publishes its “deviation from normal” against the 2020 normals, and the normals used here were reconstructed from each year’s observation date and its deviation). The specimen species varies by location — yamamomiji, oomomiji, itayakaede and others.
- Listed price: The average of all plans published by each property on OTAs and other channels (double occupancy, per-room rate, tax included). The daily curves in this article take the average listed price for the given check-in date at each property within the target catchment, then the median across properties. A centred 7-day moving average covering the three days before and after is applied to remove day-of-week effects. Listed price is not referred to as ADR.
- ADR (average daily rate): An estimated settled rate (tax-excluded equivalent) calculated by applying category-specific adjustment coefficients to the cheapest plan level each property publishes on OTAs (double occupancy, per-room rate, tax included). Against property-level actuals disclosed by listed hotel REITs (184 property-months, April-May 2026), the median error is 7.5% (6.0% for the business and city hotel categories), and 6.6% at the area median across the ensemble of both OTAs (verification covered the business, city, resort, ryokan and capsule categories). These are estimates and differ from any individual property’s actual transacted rates or accounting figures. Area-level ADR is the median of the target properties (the level of a typical property in that area).
- Occupancy (estimated, based on OTA listed inventory): The share of sold rooms against total rooms in the area, estimated from inventory offered for sale on OTAs. It is an estimate based on how that OTA inventory is being taken up and differs from a property’s true overall occupancy. LT (lead time) = days remaining until the check-in date. LT0 = same day.
- Catchment definition: Lodging properties located within a 5 km radius of each weather station’s coordinates.
- Data sources: Japan Meteorological Agency, “Phenological Observation Information” / MetroEngines Research
- — The price peak arrives a median of 14 days earlier than the JMA maple leaf-colouring date. In 28 of 30 cases (10 locations x 3 years) it came first.
- — The main driver is not the leaf-colouring front but where November’s three-day weekend falls. In 2024 Tokyo, Kanazawa and Hiroshima all peaked on 5 November; in 2025 and 2026 the same three peaked on 19-21 November.
- — Kyoto’s price peak has moved within a span of just two days over three years (24-25 November). Its maple leaf-colouring date, meanwhile, shifted by more than ten days: 20 December, then 10 December, against a normal of 5 December.
- — In the leaf-viewing week, Kyoto sits at 74% of its peak level (73-75% in all three years). That contrasts with Hiroshima at 95% and Kanazawa at 93%, markets whose pricing tracks the weather event — and the room to redesign is proportional to that low level, not to the size of the gap in days.
- — Estimated settled ADR for November 2026 is above the same month last year at all ten locations. Note, however, that 2025 is a completed actual month while 2026 is a listing-based estimate, so the year-on-year figures are a guide skewed to the upside rather than a measured rate of change.
What exactly is the JMA’s “maple leaf-colouring date”, and when is it recorded?
The scope of phenological observation was sharply narrowed in 2021. Animal phenology was discontinued entirely, and plant phenology was consolidated into six items: plum, cherry, hydrangea, japanese pampas grass, ginkgo and maple. Put the other way round, the maple leaf-colouring date and the ginkgo leaf-yellowing date are still observed at weather stations nationwide, making them one of the few standardised “autumn indicators” that can be compared across locations and across years.
One caveat: this observation date tends to fall later than what tourism sites call the “best viewing period”. The leaf-colouring date is the day the specimen tree’s leaves have turned essentially entirely red, which does not necessarily coincide with when famous mountain spots begin to turn, or when temples and shrines in the city centre are at their busiest. The analysis that follows therefore does not read the price peak arriving before the leaf-colouring date as “pricing being late” in itself; it looks instead at how stable the distance between the two is at each location.
There is a second premise this article does not assume: the general claim that “autumn colours are getting later every year”. Across these ten locations, the 2024 deviation from normal ran from +1 to +20 days — later at every location — whereas 2025 ranged from -5 to +9 days, back close to normal. In 2025 Tokyo was five days earlier than normal on 23 November, Aomori three days earlier on 10 November, and Sendai one day earlier on 20 November. What the data supports is not a monotonic delay but a large year-to-year swing.
| Observation location | Normal (1991-2020) | 2024 observed | Deviation | 2025 observed | Deviation |
|---|---|---|---|---|---|
| Sapporo (Hokkaido) | 28 Oct | 11 Nov | +14 days | 6 Nov | +9 days |
| Aomori (Aomori) | 13 Nov | 15 Nov | +2 days | 10 Nov | -3 days |
| Sendai (Miyagi) | 21 Nov | 22 Nov | +1 day | 20 Nov | -1 day |
| Utsunomiya (Tochigi) | 20 Nov | 6 Dec | +16 days | 28 Nov | +8 days |
| Nagano (Nagano) | 12 Nov | 2 Dec | +20 days | 19 Nov | +7 days |
| Kanazawa (Ishikawa) | 24 Nov | 3 Dec | +9 days | 25 Nov | +1 day |
| Tokyo (central) | 28 Nov | 3 Dec | +5 days | 23 Nov | -5 days |
| Kyoto (Kyoto City) | 5 Dec | 20 Dec | +15 days | 10 Dec | +5 days |
| Hiroshima (Hiroshima) | 22 Nov | 2 Dec | +10 days | 27 Nov | +5 days |
| Fukuoka (Fukuoka) | 1 Dec | 6 Dec | +5 days | 1 Dec | 0 days |
The price peak runs a median of 14 days ahead of the leaf-colouring date — 28 of 30 cases
Now the price side. For each of the ten locations we took the daily listed price (median across properties) for the cluster of properties within a 5 km radius of the weather station, from 1 October to 15 December in 2024, 2025 and 2026. Because the year-end and New Year period is a demand event independent of autumn colours, the aggregation window is cut off on 15 December. A centred 7-day moving average was applied to remove day-of-week effects, and the day on which its maximum falls was defined as the autumn price peak date.
The result points overwhelmingly in one direction. Measured against the normal leaf-colouring date, the price peak came earlier than the leaf-colouring date in 28 of the 30 cases (10 locations x 3 years), with a median gap of -14 days and a mean of -16.6 days. Measured against each year’s actual observation date, 19 of the 20 cases in 2024 and 2025 came first, and the median widens to -26 days. Because the colours were late at every location in 2024, the gap on an actual-date basis comes out larger.
The differences between locations are not small. Hiroshima at -7.3 days and Kanazawa at -9.0 days (three-year averages) sit close to the leaf-colouring date, while Utsunomiya at -33.0 days, Sendai at -27.7 days and Aomori at -25.0 days are roughly a month apart. The catchments of Utsunomiya and Sendai are not the famous leaf-viewing spots themselves but urban markets in prefectural capitals, where the price peak forms in the academic-conference and tournament season of October or around the early-November holiday weekend. The structure that emerges is one in which leaf-viewing demand arises at the surrounding tourist destinations, and city hotels absorb the overflow later.
| Observation location / catchment | Normal leaf-colouring date | 2024 price peak | 2025 price peak | 2026 price peak | 3-year avg gap | Classification |
|---|---|---|---|---|---|---|
| Sapporo (Hokkaido) | 28 Oct | 10 Oct | 9 Oct | 30 Oct | -11.7 days | Earlier |
| Aomori (Aomori) | 13 Nov | 25 Oct | 18 Oct | 14 Oct | -25.0 days | Much earlier |
| Sendai (Miyagi) | 21 Nov | 14 Oct | 20 Nov | 8 Oct | -27.7 days | Much earlier |
| Utsunomiya (Tochigi) | 20 Nov | 4 Nov | 15 Oct | 4 Oct | -33.0 days | Much earlier |
| Nagano (Nagano) | 12 Nov | 16 Oct | 13 Oct | 20 Nov | -16.3 days | Earlier |
| Kanazawa (Ishikawa) | 24 Nov | 5 Nov | 21 Nov | 19 Nov | -9.0 days | Roughly aligned |
| Tokyo (central) | 28 Nov | 5 Nov | 20 Nov | 19 Nov | -13.3 days | Earlier |
| Kyoto (Kyoto City) | 5 Dec | 25 Nov | 24 Nov | 24 Nov | -10.7 days | Earlier |
| Hiroshima (Hiroshima) | 22 Nov | 5 Nov | 20 Nov | 19 Nov | -7.3 days | Roughly aligned |
| Fukuoka (Fukuoka) | 1 Dec | 19 Nov | 20 Nov | 19 Nov | -11.7 days | Earlier |
The pricing calendar is anchored to November’s three-day weekend, not to the leaf-colouring front
Look closely at how the peak dates line up and the nature of the gap becomes clear. In 2024, Tokyo, Kanazawa and Hiroshima all peaked on 5 November; in 2025 and 2026 the same three peaked on 19-21 November. This is not the movement of the leaf-colouring front but the position of the public holidays. In 2024 Culture Day fell on a Sunday, making 4 November a substitute holiday and creating a 2-4 November long weekend; in 2025 Labour Thanksgiving Day fell on a Sunday, giving a 22-24 November long weekend; in 2026 it falls on a Monday, giving 21-23 November. In every case the peak of the 7-day moving average sits in the week containing that long weekend. How the holidays themselves move daily prices is examined across seven autumn-colour areas in Culture Day 2026 Falls Tuesday: Demand Peaks on Holiday Eve, +9.3pt.
Kyoto shows this pattern most sharply. Its price peak fell on 25 November 2024, 24 November 2025 and 24 November 2026 — a span of just two days across three years. The maple leaf-colouring date, by contrast, moved considerably: 20 December 2024, 10 December 2025, against a normal of 5 December. The weather side shifted by more than ten days; the price side barely moved at all.
Overlaying the 2026 curves for Kanazawa, Fukuoka and Sapporo also shows that locations divide between those that peak on the same 21-23 November long weekend and those that do not. Kanazawa and Fukuoka form a clear peak on the long weekend, but Sapporo’s 2026 peak falls on 30 October, almost exactly on the 28 October normal for maple colouring. Hokkaido’s autumn colours come early, in late October, making it one of the few locations where the timing of the leaves and the market’s autumn demand coincide.
In the leaf-viewing week, how far back towards the peak have prices come?
The size of the gap in days is not enough for an operating decision. What matters is how far the price level has fallen in the week containing the leaf-colouring date. For each location we therefore calculated the level over the seven days centred on the normal leaf-colouring date as a percentage of that year’s autumn peak week (three-year average).
Hiroshima at 95%, Kanazawa at 93%, Sendai at 93% and Nagano at 92% hold close to peak level even in the leaf-viewing week. The peak date itself may come early, but the price curve is gentle and the level has not fallen away by the time leaf-viewing demand arrives.
Kyoto, by contrast, is at 74% — the widest divergence of the ten locations (Aomori is treated as a reference value because its property count is thin). And the figure repeats: 73% in 2024, 75% in 2025, 74% in 2026. That reads as structural rather than incidental. By the week of 5 December, the normal leaf-colouring date, roughly a quarter of the November long-weekend peak level has been given up. Measured against 10 December, the actual observation date in 2025, the ratio falls to 61%. The relationship is one in which by the time the specimen tree has fully turned, Kyoto prices are back to their ordinary level. Where the demand concentrated on the long weekend goes when Kyoto city cannot absorb it is tracked through the forward ADR of Otsu, Kusatsu and Uji in a companion analysis.
Autumn 2026 levels — estimated settled ADR is above last year at all ten locations
Alongside the question of the gap, it is worth confirming the level of prices in autumn 2026 itself. Comparing the estimated settled ADR for November in the ward or city that represents each catchment against the same month a year earlier, all ten locations are up.
| Representative area | Nov 2025 ADR | N (properties) | Nov 2026 ADR | N (properties) | Year on year |
|---|---|---|---|---|---|
| Chuo-ku, Sapporo | ¥12,654 | 130 | ¥12,699 | 132 | +0.4% |
| Aomori City | ¥10,250 | 38 | ¥11,437 | 36 | +11.6% |
| Aoba-ku, Sendai | ¥10,624 | 71 | ¥11,362 | 68 | +6.9% |
| Utsunomiya City | ¥8,029 | 49 | ¥10,833 | 41 | +34.9% |
| Nagano City | ¥12,124 | 72 | ¥13,257 | 65 | +9.3% |
| Kanazawa City | ¥13,679 | 112 | ¥15,536 | 110 | +13.6% |
| Chiyoda-ku, Tokyo | ¥19,312 | 78 | ¥20,186 | 78 | +4.5% |
| Shimogyo-ku, Kyoto | ¥23,885 | 157 | ¥25,516 | 154 | +6.8% |
| Naka-ku, Hiroshima | ¥12,550 | 56 | ¥13,831 | 58 | +10.2% |
| Hakata-ku, Fukuoka | ¥15,784 | 142 | ¥18,236 | 140 | +15.5% |
The largest increases are Utsunomiya City (+34.9%), Hakata-ku in Fukuoka (+15.5%) and Kanazawa City (+13.6%). Utsunomiya, however, has gone from 49 properties in the calculation base to 41, which leaves it more exposed to turnover in the sample and calls for some discount in reading it. Shimogyo-ku in Kyoto is up 6.8% and central Tokyo (Chiyoda-ku) 4.5% — the higher the rate level, the gentler the increase. Chuo-ku in Sapporo is essentially flat at +0.4%, reflecting Hokkaido’s seasonal shape, in which a high October level is followed by a demand trough in November. For the prefecture-by-prefecture pattern of which autumn month carries the rate peak, Japan Autumn ADR 2026: 20 Prefectures Peak in Nov, Kyoto +81.8% classifies all 47 prefectures into September-peaking, October-peaking, November-peaking and flat types.
On the inventory side, observation of late-November dates has only just begun. For a 21 November 2026 check-in (the first day of the long weekend) across Kyoto Prefecture as a whole, occupancy at a lead time of 89 days (estimated, based on OTA listed inventory) stood at 81.4% (52,709 rooms across 976 properties, of which 750 properties were observed). Early-December dates are still beyond a lead time of 90 days and outside the observation window, so this article does not compare inventory take-up beyond the long weekend numerically.
How far could the leaf-viewing week recover? Three cases and a sensitivity grid
The leaf-viewing-week level shown in the previous section (the listed-price level over the seven days containing the normal leaf-colouring date, divided by that year’s autumn peak week) ranges from 64% to 95% across the ten locations. Using that observed range itself as the yardstick makes it possible to frame “how far could it recover” in a market with a wide divergence, such as Kyoto, without importing any new assumptions. Everything below is arithmetic on the observed values of the ten locations, rearranged; it does not forecast future prices or bookings.
| Case | Leaf-viewing-week level (vs peak) | Basis for the assumption | Listed-price level index vs current |
|---|---|---|---|
| Pessimistic (floor) | 74% | Kyoto’s 73% in 2024, 75% in 2025 and 74% in 2026 simply repeat | 1.00 |
| Mid | 89% | Median of the ten locations (90% across the nine excluding thinly-sampled Aomori) | 1.20 |
| Optimistic (ceiling) | 92% | Average of the three weather-event-aligned locations (Hiroshima 95%, Kanazawa 93%, Sapporo 88%) | 1.24 |
Source: Compiled by the HotelBank Editorial Team from the Japan Meteorological Agency, “Phenological Observation Information” and MetroEngines Research (leaf-viewing-week level is the three-year average for 2024-2026. The index moves only the listed-price level of the leaf-viewing week and holds rooms sold constant).
The meaning of the range is clear. If Kyoto’s leaf-viewing week were to recover to the median of the ten locations, the listed-price level in that week would be 1.20 times the current one. Put the other way round, Kyoto is currently selling that stretch at the lowest level of the ten. This is not an argument that it “ought to” recover — only a reference point for where other markets are selling in the same week. The sensitivity table below indexes the outcome when the current level and the level reached are moved independently.
| Current \ Reached | 80% | 85% | 90% | 95% | 100% |
|---|---|---|---|---|---|
| 74% | 1.08 | 1.15 | 1.22 | 1.28 | 1.35 |
| 80% | — | 1.06 | 1.12 | 1.19 | 1.25 |
| 85% | — | — | 1.06 | 1.12 | 1.18 |
| 90% | — | — | — | 1.06 | 1.11 |
| 95% | — | — | — | — | 1.05 |
Source: Compiled by the HotelBank Editorial Team (cells where the level reached is at or below the current level are shown as “—”. Current levels for the ten locations: Kyoto 74%, Utsunomiya 87%, Sapporo 88%, Fukuoka 88%, Tokyo 90%, Nagano 92%, Sendai 93%, Kanazawa 93%, Hiroshima 95%, Aomori 64% (thinly sampled, reference value)).
There are two ways to read it. First, the lower the current level, the larger the index for the same level reached — Kyoto going from 74% to 90% gives 1.22, and 95% gives 1.28. Second, in Hiroshima, Kanazawa and Sendai, already in the 90s, recovering to the ceiling still only yields 1.05 to 1.11. The room to redesign is proportional to how low the leaf-viewing-week level is, not to the size of the gap in days. Utsunomiya may have a 33-day gap, but with a leaf-viewing-week level of 87% there is nowhere near as much room as that number of days would suggest.
In practice — how much room is there to shift the pricing calendar later?
From the data so far, the locations sort into three types, and the moves available differ for each.
| Type | Locations | Characteristics in the data | Room to reconsider the pricing calendar |
|---|---|---|---|
| Weather-event aligned | Hiroshima, Kanazawa, Sapporo | Three-year average gap of -7 to -12 days. Leaf-viewing week holds a high 88-95% of peak | The current calendar is broadly aligned with the weather event. Look for upside in building the long-weekend peak higher still |
| Long-weekend anchored | Kyoto, Fukuoka, Tokyo | The peak is pinned to November’s three-day weekend. The normal leaf-colouring date falls 10-13 days later, and the leaf-viewing week sits at 74-90% of peak | Room to design higher-rate inventory to remain available from the week after the long weekend through to the normal leaf-colouring date. Kyoto especially so |
| Linked to surrounding destinations | Utsunomiya, Sendai, Nagano, Aomori | Three-year average gap of -16 to -33 days. The peak date moves substantially between years, or is fixed in October | Price design tied to the leaf-viewing announcements of surrounding destinations rather than the city alone. Weekly rather than daily design suits better |
Kyoto is where the most concrete move is available. Its price peak has been fixed on 24-25 November for three consecutive years, while the normal leaf-colouring date is 5 December. Those eleven days are the stretch in which the hotels’ pricing calendar and the specimen tree’s colouring have come apart. In 2025 the actual leaf-colouring date slipped to 10 December, and that week’s level had fallen to 61% of peak. Put the other way round, from the week after the November long weekend through the first week of December there is still headroom in the rates being offered to travellers whose purpose is the autumn colours.
In practice the design can be set out in three steps. First, keep the long weekend (21-23 November in 2026) at the top rate band as now. Second, hold the following week (24-30 November) at a rate band only one step down, as “an extension of the peak”, rather than dropping straight back to the base level. Third, design 1-7 December, which contains the normal leaf-colouring date, as a separate plan band combining breakfast and dinner or multi-night benefits rather than room-only. The approach maintains the average rate by changing the unit of sale, rather than raising the rate directly.
Fukuoka and Tokyo take the same shape. Fukuoka’s normal leaf-colouring date is 1 December, 12 days after its price peak (19-20 November). Tokyo’s is 28 November, nine days after its peak (19-20 November). In both, the week after the long weekend through to month-end is where the main event in the weather calendar coincides with the trough in the pricing calendar. Once December begins, however, year-end party and Christmas demand builds on a separate track, so where to place the switch between the two is a market-by-market design question.
That said, it would be wrong to read mechanically that the larger the gap, the greater the room. Utsunomiya’s price peak has moved across a 31-day span, from 4 October to 4 November, over three years, and Sendai’s across 43 days, from 8 October to 20 November — low year-to-year repeatability. In markets like these, weekly operation linked to leaf-viewing information from surrounding destinations is easier to handle than finely-tuned daily design. Aomori is stable in the sense that its peak falls on 14-25 October in all three years, but with only 21-31 properties in the aggregate it is easily swayed by high-rate plans at a small number of properties.
Summary
Cross-referencing three years of the JMA’s maple leaf-colouring dates against hotel price peaks, the price peak ran a median of 14 days ahead of the leaf-colouring date, and came first in 28 of 30 cases. The main driver is not the leaf-colouring front but where November’s three-day weekend falls. Kyoto’s price peak is fixed within a two-day span from 2024 to 2026, while its leaf-colouring date moved ten days, from 20 December to 10 December.
Looking at what percentage of the peak level remains in the week of the normal leaf-colouring date, some markets stay close to the weather event — Hiroshima at 95%, Kanazawa at 93% — while Kyoto, at 74% (73-75% in all three years), repeats a structural divergence. In markets where travellers moving for the autumn colours and the peak of the pricing calendar do not fall in the same week, room to redesign remains in the stretch from the week after the long weekend through to the normal leaf-colouring date.
The leaf-colouring date does, however, swing by around ten days in either direction from year to year. In 2024 all ten locations were later than normal; in 2025 Tokyo, Aomori and Sendai were earlier. Rather than fixing the calendar and running the same dates every year, re-measuring the distance between the JMA observation date and your own area’s historical price curve each year gets closer to pricing that matches what is actually happening.
Related reading
- Culture Day 2026 Falls Tuesday: Demand Peaks on Holiday Eve, +9.3pt
- Japan Autumn 2026 Hotel Price Range: 3.3x CV Gap Across 47 Prefectures
- Japan Hotel ADR Swings Up to 4.9x by Season: 633 Municipalities Ranked
- Autumn School Trips: Weekday Rate Floors in 5 Areas, Nagasaki +1.6pt
- Tochigi Hotel ADR: 3.6x City Gap, Nasu ¥20,192 vs Utsunomiya ¥7,349
- Japan Autumn ADR 2026: 20 Prefectures Peak in Nov, Kyoto +81.8%
⚠ Note on prices for future dates: The October-December 2026 figures in this article are estimates based on rates published on OTAs and other channels as at the time of the survey (24 August 2026), and will move as the check-in date approaches. Please note that rates currently set high may fall in last-minute adjustments, and that levels may shift as new plans are added.
References and Sources
■ Data sources
Leaf-colouring dates are from the Japan Meteorological Agency’s phenological observations (maple leaf-colouring date). The lodging side uses MetroEngines Research daily listed prices, estimated settled ADR, and estimated inventory take-up based on OTA listed inventory. Daily listed price takes the average listed price for the given check-in date at each property within a 5 km radius of each weather station, then the median across properties. Estimated settled ADR is the monthly median for the ward or city representing each catchment.
■ Calculation assumptions
The autumn price peak date is defined as the day on which the maximum falls after applying a centred 7-day moving average (three days either side) to the daily curve from 1 October to 15 December. The gap is measured against the normal leaf-colouring date (1991-2020 normals); values measured against each year’s observed date are noted alongside in the text. The leaf-viewing-week level is the level over the seven days centred on the normal leaf-colouring date divided by that year’s autumn peak week. Three-year averages are simple averages of 2024, 2025 and 2026. The indices in Tables 5 and 6 are arithmetic that moves only the listed-price level of the leaf-viewing week, holding rooms sold constant.
■ Limitations and caveats
Listed prices are the rates each property publishes on OTAs and other channels, not transacted rates. The October-December 2026 figures are estimates based on listings as at the time of the survey (24 August 2026) and will move as the check-in date approaches. The year-on-year comparison in Table 3 places November 2025 on a settled actual-month basis and November 2026 on a listing-snapshot estimate basis, and the difference in basis skews it to the upside. Aomori is treated as a reference value, with only 21-31 properties in the aggregate. The specimen tree’s leaf-colouring date tends to fall later than the “best viewing period” announced by tourist destinations, and the two do not coincide. Tables 5 and 6 set out observed levels in other markets as reference points and do not indicate that Kyoto will reach those levels.
■ Weather and phenological observation
- Japan Meteorological Agency, “Phenological Observation Information — Maple Leaf-Colouring Date (2024-2025)”
- Japan Meteorological Agency, “Phenological Observation Information” (list of observed items and stations)
- Japan Meteorological Agency, “Maple Leaf-Colouring Date, Normal Values (2020 normals)”
■ Lodging price and inventory data
- MetroEngines Research — daily listed prices (10 catchments, October-December 2024-2026), estimated settled ADR (monthly), occupancy (estimated, based on OTA listed inventory)
■ Related official statistics