

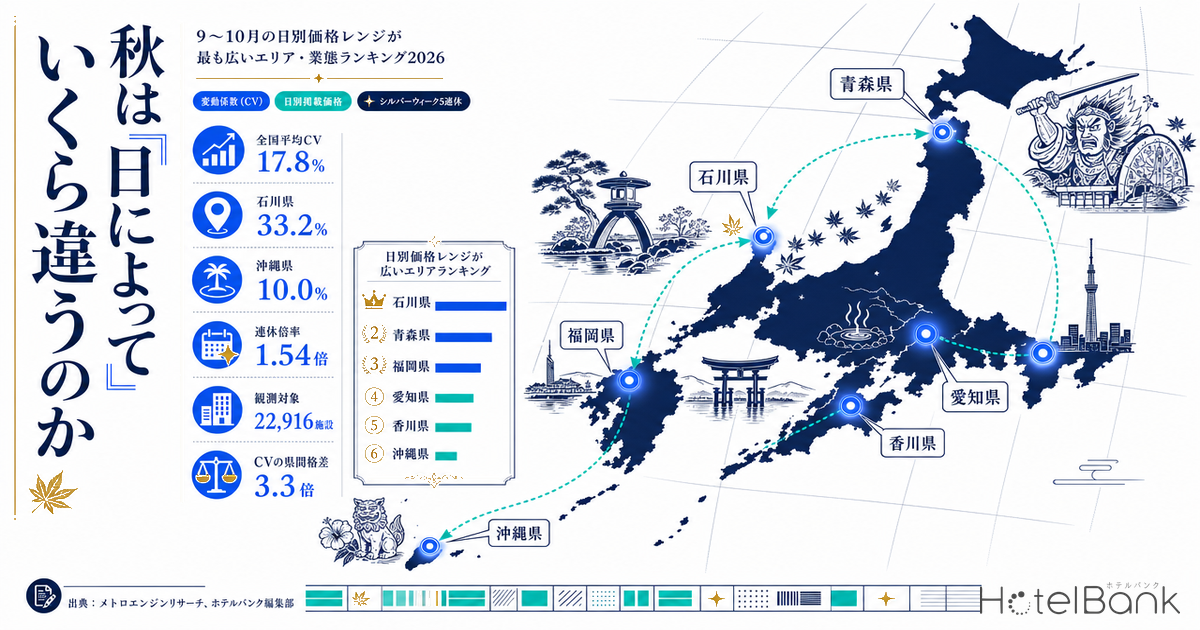
In autumn 2026, Japanese accommodation rates move sharply not by the month but by the day. September 19 (Sat) through September 23 (Wed, Autumnal Equinox Day) forms a five-day holiday run — the first in 11 years — and another three-day weekend follows on October 10 (Sat) through October 12 (Mon, Sports Day). Even within the same month and the same area, there are markets where weekday and holiday rates differ by more than a factor of two.
For this analysis we aggregated daily listed prices across 22,916 properties (approximately 1.38 million rooms) in all 47 prefectures of Japan over the 57 days from September 1 to October 27, 2026, and quantified how far prices swing within the period using the coefficient of variation (CV). By using the full width of the range — including holiday runs, weekends and weekday troughs — rather than a single day-of-week premium, we can separate markets that are successfully capturing demand peaks from those that still have headroom in pricing flexibility.
Metric Definitions Used in This Article
- ADR (Average Daily Rate): An estimated settled rate (tax-exclusive equivalent) calculated by applying category-specific adjustment coefficients to the lowest-priced plan level published by each property on OTAs and other channels (double occupancy, per-room rate, tax-included). Cross-checked against property-level disclosures by listed hotel REITs (91 properties, most recent 3 months), the median error is approximately 7%. These are estimates and differ from each property’s actual transaction prices and accounting figures. Area-level ADR is the median of the covered properties (the level of a typical property in that area).
- Listed price: The all-plan average of selling prices published on OTAs and other channels (double occupancy, per-room rate, tax-included). All daily price movement and range analysis in this article is based on listed prices. Because the level and basis differ from estimated settled ADR, the two are not compared directly.
- Coefficient of variation (CV): Calculated as standard deviation ÷ mean × 100 for the daily listed prices over the 57-day observation window. A higher value indicates that prices move more sharply from day to day. Prefecture-level and category-level CV is calculated from the series of daily aggregate values for that market (property-count-weighted average listed price). The national average CV of 17.8% in this article is the property-count-weighted average of the CV of each of the 47 prefectures (a simple average of the 47 published prefecture CVs would be 18.6%, and the median 17.6% — the level differs depending on whether weighting is applied).
- OCC (occupancy rate): The share of sold rooms against total rooms in the area (an estimate based on OTA sales inventory). To allow comparison across dates, all figures are fixed at the 90-days-before-stay point (LT90).
- LT (lead time): Days remaining until the check-in date. LT0 = same day.
- Data source: MetroEngines Research
- — The coefficient of variation (CV) of daily listed prices ranges from 33.2% in Ishikawa to 10.0% in Okinawa — a 3.3x spread. A single national average of 17.8% cannot capture the structure of autumn pricing.
- — Silver Week (Sep 19–23), the first five-day holiday run in 11 years, forms the largest price peak in 31 of the 47 prefectures. An ordinary Saturday was the peak in only two prefectures: the autumn range is set by where the holiday runs fall, not by day of week.
- — The weekend premium is in reality concentrated in the single Saturday night (index 134 for Saturday and 103 for Sunday against a weekday base of 100). The value of a holiday run lies in extending demand to days other than Saturday.
- — By category, CV is 29.4% for city hotels and 24.6% for business hotels versus 16.9% for ryokan. A sales format built around one night with two meals makes daily rate revisions difficult, leaving ryokan with pricing headroom.
- — The correlation between CV and occupancy is positive at +0.35 (N=47 prefectures). Peak-day occupancy in the high-range group is 74.1% (at LT90), showing that widening the range and selling out inventory are compatible.
Read autumn pricing through the swing — nationally ¥24,500 on weekdays, ¥37,500 over holiday runs
Start with the national picture. Weighting 22,916 properties across 47 prefectures by property count, the listed price on weekdays (Mon–Thu, excluding holiday runs) is approximately ¥24,500. Against that, Saturday runs at approximately ¥32,800, or 1.34x weekdays, and Silver Week (stays of Sep 19–22) reaches approximately ¥37,500, or 1.54x. The October holiday run (stays of Oct 10–11) is also lifted to almost the same level at 1.49x.
That national average, however, smooths away too much. Prefecture by prefecture, the CV of daily prices ranges from 33.2% in Ishikawa to 10.0% in Okinawa — a 3.3x spread. The median is 17.6%. In other words, “how much autumn accommodation rates differ from day to day” is not a uniform national phenomenon; each market has a structurally different profile.
Source: MetroEngines Research; compiled by the HotelBank Editorial Team
At the top sit Ishikawa (33.2%), Aomori (29.7%), Fukuoka (28.5%), Aichi (26.8%) and Kagawa (26.2%). Notably, none are the giant metropolitan markets: the list is led by regional core cities and prefectures in Hokuriku and Shikoku. At the bottom, by contrast, are Okinawa (10.0%), Kagoshima (10.5%) and Nagano (12.3%) — prefectures weighted toward resorts and hot-spring destinations.
| Rank | Prefecture | CV | Weekday listed price | Saturday multiple | SW multiple | Oct holiday multiple | Highest ÷ lowest | Properties |
|---|---|---|---|---|---|---|---|---|
| 1 | Ishikawa | 33.2% | ¥23,300 | 1.58x | 2.27x | 1.89x | 3.17x | 350 |
| 2 | Aomori | 29.7% | ¥22,700 | 1.52x | 1.39x | 2.13x | 2.91x | 179 |
| 3 | Fukuoka | 28.5% | ¥20,600 | 1.84x | 1.77x | 1.87x | 2.50x | 617 |
| 4 | Aichi | 26.8% | ¥21,000 | 1.50x | 1.91x | 1.34x | 2.58x | 533 |
| 5 | Kagawa | 26.2% | ¥23,300 | 1.21x | 1.97x | 1.41x | 2.91x | 287 |
| 6 | Miyagi | 24.8% | ¥20,900 | 1.57x | 1.81x | 1.69x | 2.34x | 333 |
| 7 | Tottori | 23.6% | ¥19,600 | 1.43x | 1.83x | 1.73x | 2.29x | 179 |
| 8 | Kochi | 23.2% | ¥17,900 | 1.39x | 1.86x | 1.62x | 2.41x | 171 |
| 9 | Osaka | 22.6% | ¥16,200 | 1.51x | 1.60x | 1.65x | 2.12x | 711 |
| 10 | Hiroshima | 22.5% | ¥21,900 | 1.43x | 1.74x | 1.66x | 2.18x | 396 |
| 11 | Nara | 22.3% | ¥26,900 | 1.30x | 1.60x | 1.95x | 2.53x | 182 |
| 12 | Tokyo | 21.9% | ¥26,400 | 1.43x | 1.38x | 1.60x | 2.24x | 1337 |
| 13 | Kyoto | 21.9% | ¥32,200 | 1.27x | 1.33x | 1.65x | 2.29x | 1022 |
| 14 | Toyama | 21.8% | ¥21,000 | 1.37x | 1.75x | 1.50x | 2.30x | 197 |
| 15 | Saga | 19.2% | ¥24,500 | 1.42x | 1.64x | 1.60x | 1.87x | 173 |
In Ishikawa, the weekday listed price is approximately ¥23,300 while the Silver Week average reaches approximately ¥52,900 — 2.27x. The ratio between the highest and lowest day reaches 3.17x. In Aomori, the October holiday run formed a peak at 2.13x weekdays, exceeding Silver Week. Markets differ clearly in where in autumn they choose to capture demand.
Inside the swing — the first five-day run in 11 years is the largest peak in 31 of 47 prefectures
First, the calendar. In autumn 2026, September 21 (Mon) is Respect for the Aged Day and September 23 (Wed) is Autumnal Equinox Day, making September 22 (Tue), sandwiched between them, a “Citizens’ Holiday.” The result is a five-day run from September 19 (Sat) to September 23 (Wed) — the first long holiday of this kind since 2015, 11 years ago. In October, the 12th (Mon) is Sports Day, giving a three-day run from the 10th to the 12th. In November, the 23rd (Mon) is Labor Thanksgiving Day, giving a three-day run from the 21st to the 23rd, but Culture Day (November 3) falls on a Tuesday and does not form a long weekend.
The effect of this calendar on prices was unambiguous. Of the 47 prefectures, Silver Week was the largest price peak in 31, the October holiday run was the largest in 14, and an ordinary Saturday was the largest in only two. Most of the autumn range is determined not by day of week but by where the holiday runs fall.
| Segment | Listed price (national, property-count weighted) | Index (weekday = 100) |
|---|---|---|
| Weekday (Mon–Thu, excl. holiday runs) | ¥24,500 | 100 |
| Sunday (excl. holiday runs) | ¥25,400 | 103 |
| Friday (excl. holiday runs) | ¥26,800 | 109 |
| Saturday (excl. holiday runs) | ¥32,800 | 134 |
| October holiday run (stays of Oct 10, Oct 11) | ¥36,400 | 149 |
| Silver Week (stays of Sep 19–22) | ¥37,500 | 154 |
What is striking is the position of Sunday. An ordinary Sunday outside holiday runs sits at 103 against weekdays — essentially indistinguishable from a weekday. Given that Saturday is at 134, the “weekend premium” is better described as concentrated in the single Saturday night. Holiday runs matter precisely because they extend demand to days other than Saturday.
Let us line up a wide-range market and a narrow-range market by their daily trajectories. Indexed to a median of 100, Ishikawa spikes to a maximum of 261 (September 20), whereas Okinawa peaks at only 137 and traces an almost flat waveform across the 57 days.
Source: MetroEngines Research; compiled by the HotelBank Editorial Team
In Ishikawa’s waveform, the four Silver Week nights stand out sharply, while the weekdays immediately before and after fall to levels below the national average. Going after the peak while clearly cutting prices on weekdays — the practice of drawing demand peaks and troughs with price — is observable even at the level of a prefecture-wide aggregate.
Okinawa, by contrast, holds a high listed-price level throughout September and October, and even holiday runs stay at 1.36x weekdays. In a resort market where demand is readable through the year, the underlying structure appears to be that a consistent level can be maintained without swinging prices widely within the month.
Different categories move prices differently — city hotels 29.4%, ryokan 16.9%
Next, by property category. Weighting area × category cells by property count, CV is highest for city hotels at 29.4%, followed by business hotels at 24.6%, resort hotels at 18.5% and ryokan at 16.9%. Even when selling the same autumn, how prices are moved divides clearly by category.
Source: MetroEngines Research; compiled by the HotelBank Editorial Team
| Category | CV | Weekday listed price | Saturday multiple | SW multiple | Oct holiday multiple | OCC (LT90) | Areas covered | Properties |
|---|---|---|---|---|---|---|---|---|
| Business hotels | 24.6% | ¥14,000 | 1.49x | 1.65x | 1.64x | 65.1% | 47 | 6,543 |
| City hotels | 29.4% | ¥22,500 | 1.57x | 1.69x | 1.64x | 75.8% | 26 | 847 |
| Resort hotels | 18.5% | ¥35,300 | 1.30x | 1.66x | 1.47x | 66.2% | 24 | 1,227 |
| Ryokan | 16.9% | ¥30,200 | 1.29x | 1.57x | 1.46x | 62.5% | 46 | 5,720 |
City hotels and business hotels show high Saturday multiples of 1.57x and 1.49x respectively, with only a small gap to their holiday-run multiples. They are translating a two-layer structure — business demand on weekdays, leisure demand on weekends and holiday runs — directly into price. Occupancy (at LT90) is also highest of all categories for city hotels at 75.8%: they are moving prices widely while still working through inventory.
Ryokan, on the other hand, show a Saturday multiple of 1.29x against an SW multiple of 1.57x — a profile that gains more from holiday runs than from weekends. With a sales format built around one night with two meals, fine-grained daily rate revisions are hard to execute, and switching rate cards by season or by holiday period remains the mainstream practice; this is likely what the low CV reflects. In the Japan Tourism Agency’s Overnight Travel Statistics Survey for calendar 2025, the room occupancy rate for ryokan was 38.2% (versus 75.3% for business hotels, 74.1% for city hotels and 56.9% for resort hotels) — a wide gap between categories, and a sign that ryokan retain substantial room to capture demand peaks through price.
| Category | Wide-range areas (highest CV) | Narrow-range areas (lowest CV) |
|---|---|---|
| Business hotels | Kagawa 49.6% / Nara 48.5% / Ishikawa 48.4% / Aomori 39.3% | Okinawa 12.0% / Fukushima 11.3% / Wakayama 9.2% |
| City hotels | Aichi 47.9% / Chiba 32.4% / Kyoto 32.1% / Hokkaido 31.5% | Hyogo 25.3% / Osaka 24.1% / Tokyo 19.2% |
| Resort hotels | Mie 27.4% / Hyogo 27.0% / Tochigi 23.2% / Nagasaki 22.4% | Hokkaido 14.1% / Wakayama 13.2% / Okinawa 13.2% |
| Ryokan | Kagawa 35.4% / Kochi 28.9% / Tottori 28.8% / Ehime 24.8% | Miyazaki 12.1% / Kumamoto 11.8% / Nagano 11.5% |
Business hotels show the widest internal dispersion of any category. Against Kagawa at 49.6%, Nara at 48.5% and Ishikawa at 48.4%, Wakayama sits at 9.2%. Even within the same business-hotel category, range differences of more than fivefold are observed between markets. Business hotels in Kagawa run from ¥11,900 on weekdays to ¥49,500 on the highest day — a 4.16x spread — indicating that capturing holiday demand through price is functioning across the prefecture as a whole.
A wider range does not come at the cost of occupancy
The concern that “moving prices too much means losing sales” is ever-present. We therefore examined the relationship between CV and occupancy (fixed at the 90-days-before-stay point) across the 47 prefectures.
Source: MetroEngines Research; compiled by the HotelBank Editorial Team
The correlation coefficient is +0.35 (N=47 prefectures; test of no correlation t=2.51, df=45, p≈0.016). It is a weak but statistically significant (5% level) positive correlation: markets with a wider price range tend, if anything, to show higher occupancy. Average occupancy (fixed at 90 days before stay, LT90) is 68.3% for the top 16 prefectures by CV versus 65.6% for the bottom 16 — the top group is 2.7 points higher. At the very least, the relationship “widening the range lowers occupancy” is not confirmed in prefecture-level aggregates.
| Segment | Average CV | Weekday occupancy | Peak-day occupancy | Difference |
|---|---|---|---|---|
| High-range group (top 16 prefectures by CV) | 24.2% | 65.9% | 74.1% | +8.2pt |
| Low-range group (bottom 16 prefectures by CV) | 13.9% | 63.6% | 71.0% | +7.4pt |
Looking at individual cases, Ishikawa runs from 59.6% weekday occupancy (fixed at 90 days before stay, LT90) to 71.2% on peak days (+11.6pt), and Kagawa from 66.2% to 76.1% (+10.0pt). Even on days when prices were lifted by more than a factor of two, inventory is consumed faster than on weekdays. Rather than price increases suppressing demand, the picture is one of using price to capture the days on which demand concentrates in the first place.
The upside left in narrow-range markets: pricing flexibility
The results so far point to a clear opportunity in narrow-range markets. Okinawa (CV 10.0%), Kagoshima (10.5%), Nagano (12.3%) and Gunma (13.9%) are all weighted toward resorts and hot-spring destinations, and all are markets with stable year-round drawing power. It is precisely because demand is readable throughout the year that a levelled pricing approach has been viable.
On top of that stable base, layering staged pricing limited to holiday runs and weekends would create room to build rate while maintaining occupancy. In fact, Okinawa’s Silver Week multiple is 1.36x, 0.18 points below the national average (1.54x), and Nagano’s is 1.43x. Lifting to the national average multiple (1.54x) would correspond to a rate increase of +13.2% for Okinawa and +7.7% for Nagano across the four Silver Week nights alone (see the sensitivity analysis below). Peak-day occupancy (fixed at 90 days before stay, LT90) of 69.7% in Okinawa and 73.5% in Nagano — above their weekday levels — further supports the case that there is headroom to add to price.
For reference, we also set out the monthly level of estimated settled ADR. The daily range analysis is based on listed prices, but where actual settled levels sit needs to be checked with a separate yardstick.
| Prefecture | Daily CV | Sep 2026 est. settled ADR | Oct 2026 est. settled ADR | Nov 2026 est. settled ADR | Sample (Sep) |
|---|---|---|---|---|---|
| Ishikawa | 33.2% | ¥14,008 | ¥14,284 | ¥14,881 | N=233 |
| Aomori | 29.7% | ¥12,846 | ¥14,883 | ¥10,851 | N=170 |
| Fukuoka | 28.5% | ¥13,163 | ¥14,312 | ¥14,900 | N=453 |
| Aichi | 26.8% | ¥14,044 | ¥13,312 | ¥11,403 | N=473 |
| Kagawa | 26.2% | ¥10,651 | ¥10,923 | ¥10,629 | N=155 |
| Tokyo | 21.9% | ¥14,861 | ¥18,721 | ¥18,915 | N=1086 |
| Kyoto | 21.9% | ¥13,950 | ¥21,413 | ¥25,878 | N=560 |
| Osaka | 22.6% | ¥10,187 | ¥11,599 | ¥11,915 | N=625 |
| Nagano | 12.3% | ¥14,001 | ¥14,456 | ¥14,047 | N=754 |
| Okinawa | 10.0% | ¥12,554 | ¥12,391 | ¥11,788 | N=498 |
| Kagoshima | 10.5% | ¥9,576 | ¥9,538 | ¥9,846 | N=301 |
Kyoto steps up sharply in monthly level, from ¥14,000 in September to ¥25,900 in November. In a market where the autumn-foliage peak concentrates in the second half of November, the monthly level itself moves on top of the daily range (CV 21.9%), so a September–October observation window alone cannot capture the full picture of autumn. Nara traces a similar shape, from ¥13,100 in September to ¥18,200 in November.
Conversely, in markets where the monthly level is roughly flat — Kagawa (¥10,700 in September to ¥10,600 in November) or Okinawa (¥12,600 to ¥11,800) — incremental revenue depends not on the monthly level but on which days within the month are captured. These are markets in which the design of the daily range directly determines autumn revenue.
Sensitivity analysis — how much does the autumn level move when holiday and Saturday multiples change?
Let us apply the headroom left in narrow-range markets to the actual calendar. The 57-day observation window (September 1 to October 27, 2026) is composed of 31 weekdays, 6 Sundays, 8 Fridays, 6 Saturdays, 2 October holiday-run days and 4 Silver Week days. Applying the national average day-type indices (weekday 100 / Sunday 103 / Friday 109 / Saturday 134 / October holiday run 149 / Silver Week 154) to this composition gives an average listed-price index of 110.7 across the 57 days. The table below shows the effect on that 57-day average of moving only the Silver Week multiple and the Saturday multiple.
| SW multiple \ Saturday multiple | 1.20x | 1.30x | 1.34x (national average) | 1.45x | 1.55x |
|---|---|---|---|---|---|
| 1.36x(Okinawa level) | 97.5 | 98.5 | 98.9 | 99.9 | 100.9 |
| 1.43x(Nagano level) | 98.0 | 98.9 | 99.3 | 100.3 | 101.3 |
| 1.50x | 98.4 | 99.4 | 99.7 | 100.8 | 101.7 |
| 1.54x(national average) | 98.7 | 99.6 | 100.0 | 101.0 | 102.0 |
| 1.60x | 99.0 | 100.0 | 100.4 | 101.4 | 102.4 |
Two things can be read from this. First, moving only the Silver Week multiple has a limited effect. Lifting from Okinawa’s 1.36x to the national average of 1.54x raises the four Silver Week nights themselves by +13.2%, and from Nagano’s 1.43x by +7.7%, but the contribution to the 57-day average is only +1.15% and +0.70% respectively. Four nights account for a mere 7.0% of the 57 days.
Second, the Saturday multiple has the larger effect. There are 6 Saturdays in the observation window, and lifting from 1.34x to 1.45x — just 0.11 points — moves the 57-day average by +1.0%. Holiday runs are limited in number of days, whereas Saturday comes every week. A design built on “capturing holiday runs” and one built on “accumulating on Saturdays” work very differently at the level of the whole season.
Put differently, for a narrow-range market seeking to build rate, pricing the four holiday nights is the easiest place to start but on its own will not move the season. Only by designing the full range — including the 6 Saturdays and 8 Fridays — does the difference become meaningful at the level of the 57-day average. Note that this table applies the national average day-type indices to each market and does not reflect the actual day-of-week profile or depth of demand in individual prefectures.
Conclusion — design autumn pricing by the day, not by the month
Viewing autumn 2026 accommodation prices through daily data for 22,916 properties across 47 prefectures, three points stand out.
First, the width of the range differs entirely by market. CV spans a 3.3x gap from 33.2% in Ishikawa to 10.0% in Okinawa, and the national average of 17.8% alone cannot capture reality. Second, what creates the autumn range is not the day of week but the holiday run. Silver Week, the first five-day run in 11 years, forms the largest peak in 31 of 47 prefectures and reaches 1.54x weekdays on a national average basis. Given that an ordinary Sunday sits at just 103 against weekdays, the weekend premium is in reality concentrated in the single Saturday night, and holiday runs function as a device that spreads demand to the days outside it.
Third, a wider range does not come at the cost of occupancy. The correlation between CV and occupancy is positive at +0.35, and peak-day occupancy in the high-range group (fixed at 90 days before stay, LT90) is 74.1% (N=47 prefectures). Moving price and selling out inventory are compatible, at least at the prefecture level.
A narrow range is itself evidence of stable drawing power. By layering staged pricing for holiday runs and weekends on top of that base, room remains to build rate while maintaining occupancy. Autumn revenue design has entered a stage where it must be built up from the pricing of each of the 57 individual days, not from a monthly average.
⚠ Note on prices for future dates: The daily listed prices and estimated settled ADR in this article are all estimates based on selling prices published on OTAs and other channels as of the survey date (July 29, 2026), and will change as check-in dates approach. Please note that prices set high at present may fall through last-minute discounting, and that plans not currently listed may be added and shift the level.
On the observation window: The daily analysis covers the 57 days from September 1 to October 27, 2026. Because booking-curve data is used only within a lead time of 90 days, dates from October 28 onward (including all of November), which fall 91 or more days beyond the survey date, are outside the scope of the daily analysis. The November autumn-foliage peak is referenced only through monthly estimated settled ADR.
Related Reading
- RM Tools & Price Dispersion: Tokyo/Osaka ADR Volatility by Hotel Type
- Japan Hotel ADR Polarization 2026: 57.6pt Prefecture×Category Gap
References and Sources
■ Data sources
A proprietary database collecting and aggregating daily listed prices published on OTAs and other channels for 22,916 properties (approximately 1.38 million rooms) across all 47 prefectures of Japan over the 57 days from September 1 to October 27, 2026 (survey date: July 29, 2026). Occupancy is estimated from the consumption of OTA sales inventory and fixed at the 90-days-before-stay point (LT90) to allow comparison across dates. Estimated settled ADR is an estimate derived by applying category-specific adjustment coefficients to listed levels; cross-checked against property-level disclosures by listed hotel REITs (91 properties, most recent 3 months), the median error is approximately 7%. Official statistics referenced are the Japan Tourism Agency’s Overnight Travel Statistics Survey and the Cabinet Office’s “National Holidays.”
■ Calculation assumptions
Coefficient of variation (CV) = standard deviation ÷ mean × 100 of daily listed prices over the 57-day observation window. Prefecture and category aggregates are all property-count-weighted averages; category aggregation covers only area × category cells with 15 or more properties (25 or more for within-category area comparisons). All multiples use the weekday (Mon–Thu, excluding holiday runs) listed price of the same market as the denominator. The sensitivity analysis applies the national average day-type indices to the actual day composition of the 57-day observation window (31 weekdays, 6 Sundays, 8 Fridays, 6 Saturdays, 2 October holiday-run days, 4 Silver Week days) and varies only the Silver Week multiple and the Saturday multiple.
■ Limitations and caveats
Listed prices and estimated settled ADR differ in level and basis and are therefore not compared directly. September through November are all future dates, and actual conditions will change as plans are added and prices revised at short notice. Because the daily analysis is limited to data within a lead time of 90 days, dates from October 28, 2026 onward (including all of November) are outside the scope of the daily analysis, and November is referenced only through monthly estimated settled ADR. Occupancy is an estimate based on OTA sales inventory and differs from each property’s actual occupancy and accounting figures. The sensitivity analysis is a hypothetical calculation applying the national average day-of-week profile to each market and does not reflect the demand structure of individual markets. The correlation analysis is an aggregate at the prefecture level (N=47) and does not demonstrate causation at the property level.
■ Market data
- MetroEngines Research — daily listed prices (47 prefectures nationwide, 22,916 properties, approx. 1.38 million rooms, September 1 – October 27, 2026), estimated settled ADR, occupancy estimates (OTA sales inventory basis)
■ Government statistics and official data
- Japan Tourism Agency, “Overnight Travel Statistics Survey” (calendar 2025 annual figures, final; room occupancy rate by facility type)
- Japan Tourism Agency press release, “Overnight Travel Statistics Survey (April 2026 second preliminary figures, May 2026 first preliminary figures, and calendar 2025 annual final figures)”
- Cabinet Office, “National Holidays” (confirmation of 2026 public holidays and Citizens’ Holidays)