

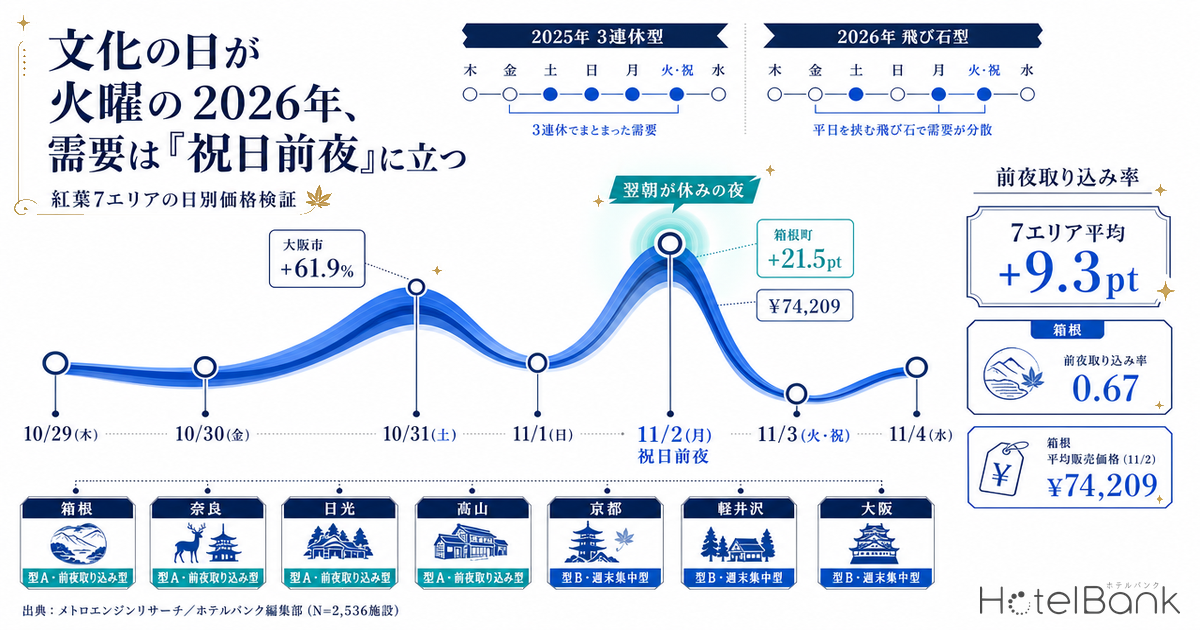
Culture Day 2026 falls on Tuesday, November 3. The day before, November 2, is an ordinary Monday workday, and before that comes a normal weekend running from Saturday, October 31 through Sunday, November 1. There is no three-day weekend — the holiday sits on its own, detached from the weekend. In 2025, November 3 fell on a Monday, giving a clean three-day weekend from Saturday, November 1 through Monday, November 3. When a public holiday shifts by a single day, which night does accommodation demand move to? We aggregated property-level daily listed prices across seven areas with clear autumn foliage demand to find out.
Metric Definitions Used in This Article
- Listed price: The average of the selling prices each property publishes on OTAs and similar channels. Per-room rate for two guests sharing one room (tax included), averaged across all plans from room-only through meal-inclusive. Area-level figures are calculated by taking each property’s daily average price and then the median within the area (the level of a typical property in that area). This differs from the price actually transacted.
- Normal-week baseline: The listed-price level for the same area and same day of the week during a week containing no public holiday (October 8–21, 2026). We calculate how many percent higher the target day is than the same weekday in the normal week, then subtract the lift applied to that week as a whole (the seven-day median). The residual is what we call the “deviation (pt).”
- Eve-capture ratio: With the weekday level of that week indexed to 100, this ratio shows what share of Saturday’s uplift is matched by the uplift on the eve of the holiday. The closer to 1.00, the more demand is spread across the holiday eve rather than concentrated on the weekend alone.
- Estimated settled ADR: An estimated transacted rate (tax-exclusive equivalent) calculated by applying segment-specific adjustment coefficients to the lowest-plan level each property publishes on OTAs and similar channels. Cross-checked against property-level results disclosed by listed hotel REITs, the median error is approximately 7%. It is an estimate and differs from each property’s actual transacted prices and accounting figures. Area-level values are the median across target properties. In this article it is used only for the monthly level comparison (the year-on-year table near the end) and not for the daily analysis.
- LT (lead time): Days remaining until the check-in date. LT0 is the check-in day itself.
- Data source: MetroEngines Research
- — The only day that came in above the same weekday of the normal week across all seven areas was Monday, November 2 — the eve of the holiday (average +9.3pt). Saturday, October 31, the highest point on the within-week curve, came in at an average of −2.4pt: an ordinary Saturday.
- — Hakone’s eve-capture ratio of 0.67 is the highest of the seven areas. The median listed price on the eve of the holiday reaches roughly ¥74,200, approaching Saturday’s ¥80,100.
- — The seven areas split into eve-capture types (Hakone, Nara, Nikko) and weekend-concentrated types (Takayama, Kyoto, Karuizawa, Osaka). What separates them is whether the holiday overlaps the window of peak foliage or a major local event.
- — The holiday night itself came in at 95.6 in 2025 and 100.5 in 2026 — the lowest of the six days surrounding the holiday in both years. Because the next morning is a workday, the holiday is used for day trips rather than overnight stays.
Counting the “nights followed by a day off” reveals the shape of the calendar
When thinking about accommodation demand, what matters more than the holiday itself is whether the morning after that night is a day off. Stay on a Friday night and Saturday morning is free. Stay on a Sunday night and Monday morning means going back to work for most people. Accommodation demand builds on the former.
Lining up the 2025 and 2026 calendars from this angle makes the structural difference clear.
| 2025 (three-day weekend) | Next morning | 2026 (split holiday) | Next morning |
|---|---|---|---|
| Fri, Oct 31 stay | Day off | Fri, Oct 30 stay | Day off |
| Sat, Nov 1 stay | Day off | Sat, Oct 31 stay | Day off |
| Sun, Nov 2 stay = holiday eve | Day off | Sun, Nov 1 stay | Workday |
| Mon, Nov 3 (holiday) stay = holiday night | Workday | Mon, Nov 2 stay = holiday eve | Day off |
| Tue, Nov 4 stay | Workday | Tue, Nov 3 (holiday) stay = holiday night | Workday |
In 2025 the “nights followed by a day off” ran three deep — Friday, Saturday, Sunday — and the Sunday night among them was the eve of the holiday. In 2026 the run breaks after Friday and Saturday, then Monday night rises again as a “night followed by a day off” with Sunday night in between. Monday, November 2, 2026 is a weekday night, yet the next morning is Culture Day and free. Whether demand rides on that night is what this article sets out to test.
The within-week curve across seven areas — the visible peak is Saturday, but
We selected seven areas where autumn foliage demand builds clearly and aggregated daily listed prices at the property level from Thursday, October 29 through Wednesday, November 4. Coverage is limited to properties for which prices were observable on all seven days in each area (Kyoto 1,196 properties, Osaka 595, Hakone 236, Nikko 156, Takayama 154, Karuizawa 103, Nara 96). The chart below indexes each area against its own weekday level for that week (the average of Thursday and Wednesday) set at 100.
Source: MetroEngines Research; compiled by the HotelBank Editorial Team (N=2,536 properties, listed prices as of early August 2026)
Saturday, October 31 is the highest day in every area. Osaka reaches 161.9 against its weekday level, Karuizawa 134.6 and Hakone 128.2 — the Saturday spike stands out. On this evidence alone, the conclusion would be that demand is concentrated on the weekend.
There is one trap in that reading, however. Saturday runs high every week, whether or not there is a holiday. Accommodation prices carry their own day-of-week rhythm, and reading the calendar effect requires subtracting it out.
Compared with the same weekday in a normal week, only one day actually moved
So we re-based the analysis on day-of-week levels from a normal week containing no holiday (October 8–21, 2026, same areas and same property sets). We calculate how many percent higher the target day’s price is than the same weekday in the normal week, then subtract the lift applied to that week as a whole (the seven-day median). What remains is the pure differential the calendar produced on that day alone.
Source: MetroEngines Research; compiled by the HotelBank Editorial Team (N=2,536 properties)
The result was unambiguous. The only day that moved positive across all seven areas is Monday, November 2. The swing runs from +21.5pt in Hakone down to +4.2pt in Takayama, averaging +9.3pt across the seven areas. By contrast, Saturday, October 31 averaged −2.4pt and Sunday, November 1 averaged −0.3pt — essentially unchanged from the same weekday in a normal week. Tuesday, November 3, the holiday itself, stops at an average of +2.1pt.
In other words, the Saturday that looked highest on the within-week curve was an ordinary Saturday, and the only day the calendar genuinely lifted was the Monday on the eve of the holiday. That aligns directly with the hypothesis set out at the start: demand builds on nights followed by a day off.
| Area | Thu 10/29 | Fri 10/30 | Sat 10/31 | Sun 11/1 | Mon 11/2 | Tue 11/3 (holiday) | Wed 11/4 |
|---|---|---|---|---|---|---|---|
| Hakone | -3.6 | -0.2 | -1.5 | +2.5 | +21.5 | -1.1 | +4.9 |
| Nara | +0.0 | -5.1 | -17.8 | -9.3 | +14.7 | +9.2 | +12.3 |
| Nikko | +1.4 | -2.1 | -2.8 | -4.3 | +5.7 | +5.2 | -1.6 |
| Takayama | -4.2 | -0.1 | +0.3 | +0.4 | +4.2 | -1.8 | -0.1 |
| Kyoto | +0.8 | -0.6 | -2.4 | +0.8 | +4.9 | +1.4 | -0.3 |
| Karuizawa | +0.8 | -6.7 | +1.4 | -1.2 | +7.7 | +2.8 | -5.8 |
| Osaka | +0.0 | +0.0 | +6.1 | +9.2 | +6.6 | -1.0 | -0.8 |
Source: MetroEngines Research; compiled by the HotelBank Editorial Team (N=2,536 properties)
One caveat applies to this calculation. The normal week used as the baseline (October 8–21) reaches check-in earlier than the target week, so the observed prices carry a somewhat shorter lead time. We therefore repeated the same calculation using October 19–28 — closer in lead time to the target week — as a second baseline. The November 2 deviation came out at +22.9pt (baseline 1) versus +20.1pt (baseline 2) in Hakone, +5.0pt versus +4.8pt in Kyoto, and +6.1pt versus +5.3pt in Nikko: essentially unchanged in every case. The table above shows the average of the two baselines.
Eve-capture and weekend-concentrated — two patterns
The holiday eve may rise, but by how much varies widely by area. Organizing the seven areas by the eve-capture ratio — with the weekday level of that week set at 100, what share of Saturday’s uplift is matched by the holiday eve’s uplift — splits them cleanly into two groups.
Source: MetroEngines Research; compiled by the HotelBank Editorial Team (N=2,536 properties)
Type A: eve-capture covers Hakone (0.67), Nara (0.32) and Nikko (0.31). Hakone stands out in particular: the median listed price for Monday, November 2 is roughly ¥74,200, approaching Saturday’s ¥80,100. That is +18.8% against the weekday level of about ¥62,500, and +21.5pt against the same Monday in a normal week — the largest gain of the seven areas. The travel pattern of leaving the Tokyo metropolitan area in the evening, staying one night, spending the whole of Culture Day out and returning that evening shows up directly in the pricing.
Type B: weekend-concentrated covers Takayama (0.28), Kyoto (0.22), Karuizawa (0.20) and Osaka (0.05). Osaka’s 0.05 is extreme: Saturday jumps to +61.9% above the weekday level while the Monday holiday eve stops at +2.8%. Urban accommodation markets carry a clear two-layer structure of weekend leisure and weekday business, making it hard for the intermediate demand of a holiday eve to take hold. Note also that October 31, 2026 is Halloween on a Saturday, which is likely one reason Saturday ran especially thick in Osaka with its large entertainment districts. Indeed, Osaka’s October 31 came in at +6.1pt even against a normal-week Saturday — the only clearly positive reading among the seven areas.
| Area | Properties covered | Weekday level | Sat 10/31 | Mon 11/2 (holiday eve) | Tue 11/3 (holiday) | Eve-capture ratio | Type |
|---|---|---|---|---|---|---|---|
| Hakone(Kanagawa) | 236 | ¥62,456 | ¥80,074 +28.2% | ¥74,209 +18.8% | ¥62,800 | 0.67 | Type A |
| Nara(Nara Pref.) | 96 | ¥33,050 | ¥39,280 +18.8% | ¥35,068 +6.1% | ¥32,848 | 0.32 | Type A |
| Nikko(Tochigi) | 156 | ¥38,848 | ¥45,062 +16.0% | ¥40,767 +4.9% | ¥40,176 | 0.31 | Type A |
| Takayama(Gifu) | 154 | ¥42,082 | ¥49,960 +18.7% | ¥44,321 +5.3% | ¥41,880 | 0.28 | Type B |
| Kyoto(Kyoto Pref.) | 1,196 | ¥43,978 | ¥51,922 +18.1% | ¥45,703 +3.9% | ¥44,108 | 0.22 | Type B |
| Karuizawa(Nagano) | 103 | ¥60,972 | ¥82,093 +34.6% | ¥65,253 +7.0% | ¥62,971 | 0.20 | Type B |
| Osaka(Osaka Pref.) | 595 | ¥19,038 | ¥30,822 +61.9% | ¥19,571 +2.8% | ¥18,462 | 0.05 | Type B |
Source: MetroEngines Research; compiled by the HotelBank Editorial Team (listed prices as of early August 2026, two guests per room, tax included)
Source: MetroEngines Research; compiled by the HotelBank Editorial Team
What decides the type is the overlap with peak foliage
What separates the two types? Lining up the peak foliage window in each area reveals the correspondence.
Hakone spans a large elevation range: color typically begins on Mount Kamiyama and Mount Kintoki in late October, with Sengokuhara, Motohakone and Lake Ashi reaching their peak in early November (Hakone Tourist Association). November 3 sits right at the center of that window. Nikko likewise spans a large elevation range, with the Irohazaka road and Lake Chuzenji peaking from mid-October to early November and the town center following afterward (Nikko City tourism site). In both areas, Culture Day coincides with the height of the foliage season.
Kyoto’s foliage runs on a different schedule: major spots such as Tofukuji and Eikando typically peak from mid to late November. November 3 is still at the early-coloring stage. Kyoto’s modest holiday-eve deviation of +4.9pt can be read as a sign that foliage demand itself has not yet fully arrived. Kyoto’s demand peak sits roughly three weeks after this week, which makes early November a period where properties still have pricing room.
Nara is a somewhat different case. Its November 2 deviation of +14.7pt is large, but the whole week is lifted by even more. The 78th Shosoin Exhibition runs at the Nara National Museum from Saturday, October 24 through Monday, November 9, 2026, placing the target week squarely inside that run (Nara National Museum). In Nara, Tuesday, November 3 comes in at +9.2pt and Wednesday, November 4 at +12.3pt, with the weekday side thick as well — the event, more than the calendar, is shaping demand. Given also that its 96 properties make it the smallest coverage of the seven areas, Nara’s figures need to be read with a wider margin than the others.
Overlaying the 2025 three-day weekend — the holiday night is always weak
To check whether the 2026 shape is unusual, we aggregated the same week in 2025 the same way. The chart below aligns the horizontal axis by how many nights before Culture Day each date falls and overlays the seven-area average index.
Source: MetroEngines Research; compiled by the HotelBank Editorial Team (2026: N=2,536 properties / 2025: N=2,311 properties)
What appears in both years is the dip on the holiday night. In 2025 the holiday night (Monday, November 3) came in at 95.6 against the weekday level, and in 2026 at 100.5 — the lowest reading of the six days in both cases. The reason is straightforward: stay on the night of the holiday and the next morning is a workday. The holiday is consumed as a day out, not as a night away.
The holiday eve, meanwhile, rises in both years. In 2025 the eve was a Sunday (already a weekend night) at 112.4; in 2026 the eve rose to 107.0 despite being a weekday Monday. Comparing the Saturdays of the two years (two nights before the holiday in 2025, three nights before in 2026) gives 115.8 in 2025 against 128.0 in 2026, so concentration onto Saturday is stronger in the split-holiday year. When a long weekend is broken up, demand splits into two peaks — Saturday and the holiday eve — is the picture the two-year comparison supports.
Note that the 2025 figures are averages of listed prices observed across the whole booking window, whereas the 2026 figures are averages of listed prices observed up to roughly 90 days before check-in; the observation conditions differ. For this reason we do not compare levels directly and compare only the within-week shape, each year against its own normal week.
Inventory observation is still at the entrance
Alongside price, we also checked how remaining inventory on OTAs is being drawn down. As of early August 2026, however, the target dates are still roughly 90 days from check-in, and observation of the inventory trend has only just begun.
The properties with confirmable inventory data in each prefecture containing the seven target areas were: Kanagawa 351–356, Nagano 290–291, Osaka 288–291, Tochigi 275–281, Gifu 247–252, Kyoto 178–179 and Nara 148–149 (all on a daily basis from October 31 to November 3, against a base population of 800 properties per prefecture). The spread in observed property counts across dates is at most six properties, showing no sign that thin observation on any single day is manufacturing a false trough or a false peak.
However, each property carries only zero to three observation points, which is not yet enough to compare drawdown speed day by day. Discussing demand strength from the pace of inventory depletion should become possible from early September onward, once lead time falls below 60 days. The conclusions here rest solely on the within-week curve of listed prices; corroboration from the inventory side must wait for further observation.
What this means for properties — where the pricing room sits
The results so far offer three implications for pricing in early November.
First, there is room to treat Monday, November 2 as a quasi-weekend rather than a weekday.All seven areas came in above the normal-week Monday, and some — Hakone above all — lift to a level approaching Saturday. Onsen areas and highland resorts two to three hours one way from the Tokyo or Keihanshin metropolitan areas are positioned to capture pre-holiday overnight demand. Put the other way, properties leaving this date priced the same as an ordinary Monday still have a straightforward opportunity to add.
Second, Sunday, November 1 and Tuesday, November 3 (the holiday) are days with high freedom in price design.Both stop at roughly the same level as the same weekday in a normal week (−0.3pt and +2.1pt respectively on the seven-area average), receiving almost no benefit from the calendar. These are days where occupancy can be built through angles other than rate — consecutive-night incentives, early-booking benefits and the like. A consecutive stay spanning November 1 into November 2 in particular bridges the Sunday night and the holiday eve, making it easy to build into an offer.
Third, the position relative to peak foliage decides how thick demand is.In areas such as Kyoto where the peak shifts to mid-November or later, the days around Culture Day amount to a run-up stretch. Rather than pushing this period through at peak-season rates, designing a rate ladder toward the main event from mid-November onward tends to accumulate more revenue across the season as a whole.
The level for November overall — year-on-year by area
Separately from the within-week shape, the level of November as a month is worth checking. Comparing the estimated settled ADR of each prefecture containing the seven target areas against the same month last year gives the following.
| Prefecture | November 2025 (actual) | November 2026 (estimated) | YoY |
|---|---|---|---|
| Gifu(Takayama) | ¥12,500 N=347 | ¥14,900 N=302 | +18.7% |
| Nagano(Karuizawa) | ¥12,400 N=773 | ¥14,000 N=663 | +12.9% |
| Tochigi(Nikko) | ¥12,400 N=382 | ¥14,000 N=325 | +12.8% |
| Nara(Nara City) | ¥16,600 N=135 | ¥17,800 N=112 | +7.3% |
| Kanagawa(Hakone) | ¥15,600 N=542 | ¥16,300 N=479 | +4.8% |
| Kyoto(Kyoto City) | ¥24,800 N=578 | ¥25,700 N=515 | +3.8% |
| Osaka(Osaka City) | ¥12,000 N=623 | ¥11,800 N=598 | −1.8% |
Source: MetroEngines Research; compiled by the HotelBank Editorial Team
The mountain and highland areas where foliage demand builds in early November show the larger gains (Gifu +18.7%, Nagano +12.9%), while urban areas sit around flat. Kanagawa and Tochigi — home to Hakone and Nikko, both classified as eve-capture types — are also above last year, so there is no sign at this point that the split calendar is eroding total demand. Note that the November 2026 figures are estimates based on the current listing situation and will move as check-in approaches.
Summary
With Culture Day 2026 landing on a Tuesday, listed prices show accommodation demand splitting into two peaks: Saturday, October 31 and the holiday eve of Monday, November 2. The within-week curve looks highest on Saturday, but the only day clearly above the same weekday in a normal week was the Monday holiday eve, positive across all seven areas at an average of +9.3pt.
The size of that swing varies widely by area, splitting Hakone (eve-capture ratio 0.67), Nara (0.32) and Nikko (0.31) into the eve-capture type and Takayama (0.28), Kyoto (0.22), Karuizawa (0.20) and Osaka (0.05) into the weekend-concentrated type. What creates the split is whether the holiday overlaps each area’s peak foliage or event window.
And what both years share is the structure in which the night of the holiday itself sinks to the lowest level among the nights surrounding it. Because the next morning is a workday, the holiday is used for day trips rather than overnight stays. This regularity holds in the 2025 three-day weekend and in the 2026 split calendar alike, showing that it is worth recounting which nights demand builds on every time the calendar changes.
A note on prices for future dates: The listed prices for October 29 – November 4, 2026 in this article are an aggregation of selling prices published on OTAs and similar channels as of early August 2026 (roughly 90 days before check-in), and they will move as check-in approaches. Prices set high at this point may fall at the last minute, and equally they may rise as inventory is drawn down. Please read this as an observation of the state of play as of early August 2026, not as a definitive forecast.
Related reading
- Hokkaido City Hotels: Only Aug 15 Trails at 78.7% OCC, 45 Days Out
- Listed vs Settled ADR Gap: Japan’s 46-Prefecture Upside Map 2026
- Yosakoi 2026: Kochi Aug 11 86.9% Sold Out at 45 Days, 45.0pt Gap
References and Sources
■ Data sources
Daily listed prices use as their base population the 2,536 properties for which prices were observable on every day of the target period across the seven target areas (Kyoto, Osaka, Hakone, Nikko, Takayama, Karuizawa and Nara); the 2025 comparison uses 2,311 properties. Each property’s daily average price is taken first, and the median within the area is then calculated. The monthly estimated settled ADR is an aggregate for each prefecture containing the seven target areas, with the number of properties covered shown as N= in the table.
■ Calculation assumptions
The “deviation (pt)” is the residual after finding how many percent higher the target day’s listed price is than the same weekday in a normal week and subtracting the lift applied to the target week as a whole (the seven-day median). Two normal-week baselines are used — October 8–21, 2026 (baseline 1) and October 19–28, closer in lead time to the target week (baseline 2) — and the table shows the average of the two. The eve-capture ratio is the ratio of the holiday eve’s uplift to Saturday’s uplift, with that week’s weekday level (the average of Thursday and Wednesday) set at 100.
■ Limitations and caveats
(1) Listed prices are not transacted prices; they are selling prices published as of early August 2026 (roughly 90 days before check-in) and will move toward the check-in date. (2) The 2025 figures are observation averages across the entire booking window and differ in observation conditions from 2026, so levels are not compared directly and only the within-week shape is compared. (3) Inventory is limited to zero to three observations per property and is not used to compare daily drawdown speed. (4) Nara has the smallest base population at 96 properties and overlaps the run of the Shosoin Exhibition, so it needs to be read with a wider margin than the other areas.
■ Market data
- MetroEngines Research — daily listed prices (October 29 – November 4, 2026; October 30 – November 5, 2025; normal-week baselines of October 8–21 and October 19–28, 2026 and October 8–21, 2025), monthly estimated settled ADR, and observation status of OTA-listed inventory
■ Calendar, events and tourism information
- Nara National Museum, “The 78th Annual Exhibition of Shosoin Treasures” (October 24 – November 9, 2026)
- Hakone Tourist Association, “Hakone Autumn Foliage Information”
- Nikko Tabi Navi (Nikko City Tourism Association), “Irohazaka and Lake Chuzenji Area: Congestion and Peak Timing”
- Kyoto Tourism Information, “Kyoto Autumn Foliage 2026: Peak Timing and Event Guide”
- 2026 (Reiwa 8) Japanese Public Holiday Calendar