

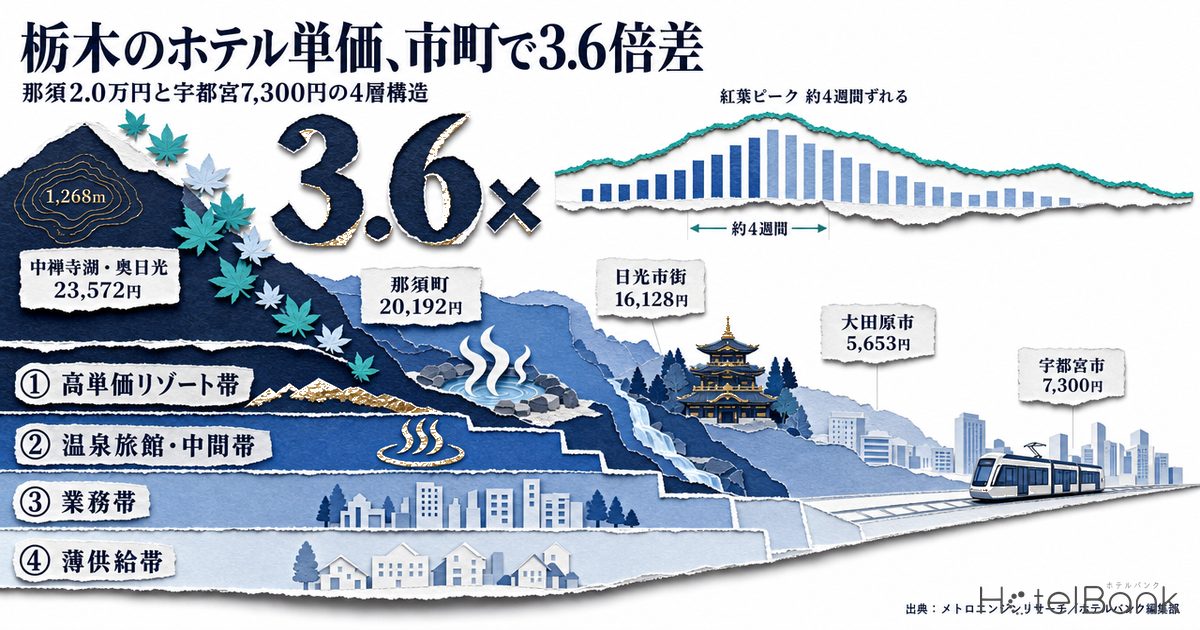
Tochigi’s lodging market is hard to read from a single prefecture-level average. A mountain resort at Oku-Nikko and a business hotel outside Utsunomiya Station both sit inside the same “Tochigi Prefecture.” Using MetroEngines Research municipality-level data, this article re-sorts the estimated settled ADR (average daily rate) of Tochigi’s 21 cities and towns over the most recent 12 months. What emerges is a four-tier structure with a roughly 3.6x spread between the top-ranked Nasu Town (¥20,192) and the bottom of the business tier (¥5,653). Within Nikko City alone, daily data further shows that the autumn-foliage price peak shifts by about four weeks depending on elevation.
Metric Definitions Used in This Article
- ADR (average daily rate): An estimated settled rate (tax-excluded equivalent) calculated by applying a property-type correction factor to the lowest published plan level each property lists on OTAs and similar channels (double occupancy, per-room rate, tax-included). Cross-checked against property-level results disclosed by listed hotel REITs, the median error is approximately 7%. It is an estimate and differs from each property’s actual settled rates and accounting figures. Area-level ADR is the median across the covered properties (the level of a typical property in that area).
- Published price: The average of all plans listed on OTAs and similar channels (double occupancy, per-room rate, tax-included). Because the basis differs from ADR, it applies only where the text explicitly says “published price.”
- Coverage period: The 12 months from August 2025 to July 2026. This period is calculated on the settled basis (reconciled against actuals). Months from August 2026 onward are on a published-snapshot basis and do not connect to it, so they are excluded from the ADR analysis in this article as a rule.
- Data source: MetroEngines Research
- — 3.57x — Nasu Town ¥20,192 versus Otawara City ¥5,653. The 14 municipalities where estimated settled ADR can be calculated reliably split into a four-tier structure, with an empty band between the ¥14,000s and the ¥7,000s.
- — Nikko City is not one market — Lake Chuzenji / Oku-Nikko ¥23,572, Kinugawa Onsen ¥20,003, central Nikko ¥16,128. The city-wide average of ¥18,135 is merely a value that happens to land between the three sub-markets.
- — About four weeks — The autumn-foliage price peak descends with elevation. In the daily index for autumn 2025, Oku-Nikko peaked on October 26, Kinugawa on November 21, and central Nikko on November 20.
- — 1.11x-1.36x — The annual swing in the business tier is less than half that of the resort tier (1.47x-1.65x). Room remains to add price on strong days of the week and event dates.
- — 3.6x is not an outlier — On the same basis, neighboring prefectures run at Fukushima 4.41x, Nagano 3.95x, Ibaraki 3.53x and Gunma 3.38x. What sets Tochigi apart is the dispersion inside Nikko City rather than the multiple itself.
Municipal ADR spans 3.6x — Tochigi’s lodging market is built from four tiers
Start with the overall picture. Lining up the 14 municipalities in Tochigi where estimated settled ADR could be calculated reliably (those with five or more covered properties) by their trailing 12-month average, the top runs Nasu Town ¥20,192, Nikko City ¥18,135, Nakagawa Town ¥17,422 and Nasushiobara City ¥14,043. From there the level drops a step to the business tier of Sakura City ¥7,818 and Utsunomiya City ¥7,349. The ratio against the lowest, Otawara City at ¥5,653, is roughly 3.6x.
This distribution is not a continuous gradient; it comes with distinct steps. Not a single municipality falls between the ¥14,000s and the ¥7,000s, which shows that the prefecture’s lodging market divides into four tiers: a high-rate resort tier, an onsen-ryokan / middle tier, a business tier, and a thin-supply tier. When discussing a trade area within the same prefecture, an average taken across these tiers offers little to base a decision on.
Source: MetroEngines Research; compiled by the HotelBank Editorial Team
The character of each tier is shown in the table below. Note the rightmost column, “annual swing.” This is the highest month divided by the lowest month across the 12 months, expressing how much the rate moves with the seasons. The resort tier moves 1.4x-1.7x, while the business tier stays within 1.1x-1.3x. Even inside a single prefecture, a tier where daily and monthly price design pays off coexists with a tier that holds a nearly flat level year-round.
| Tier | Municipalities | ADR band | Annual swing |
|---|---|---|---|
| 1. High-rate resort tier | Nasu Town (N=54), Nikko City (N=123) | ¥18,000-¥20,000 | 1.47x-1.65x |
| 2. Onsen-ryokan / middle tier | Nakagawa Town (N=5), Nasushiobara City (N=70) | ¥14,000-¥17,000 | 1.38x-1.49x |
| 3. Business tier | Utsunomiya City (N=50), Oyama City (N=19), Sano City (N=17), Ashikaga City (N=13), Moka City (N=11), Tochigi City (N=10) and others | ¥5,600-¥7,900 | 1.11x-1.36x |
| 4. Thin-supply tier | Mashiko, Motegi, Mibu, Haga, Nasukarasuyama, Shimotsuke, Kaminokawa, Shioya and Takanezawa | Case-by-case (discussed below) | — |
N is the number of properties covered in the estimated settled ADR calculation (maximum across the 12 months) / Source: MetroEngines Research; compiled by the HotelBank Editorial Team
This 3.6x spread is not unique to Tochigi in scale. Re-sorting neighboring prefectures on the same basis (12-month average estimated settled ADR, limited to municipalities with five or more covered properties), Fukushima runs 4.41x from Tenei Village ¥19,440 down to Hirono Town ¥4,408; Nagano runs 3.95x from Karuizawa Town ¥23,377 down to Ina City ¥5,912; Ibaraki is 3.53x (Oarai Town ¥18,911 to Joso City ¥5,362); and Gunma is 3.38x (Minakami Town ¥18,122 to Isesaki City ¥5,360). A structure that holds both mountain and onsen resorts and cities with business demand inside one prefecture is common across the northern Kanto and southern Tohoku regions, and Tochigi’s multiple sits mid-pack among them.
What characterizes Tochigi, therefore, is not the size of the multiple but its composition. The top two municipalities, Nasu Town and Nikko City, are trade areas of different character — a highland resort versus a shrine-and-temple gateway town with onsen — and inside Nikko City alone the range runs from ¥16,128 to ¥23,572, a 1.46x spread. That is why the prefecture’s tiers and the tiers inside a single administrative area have to be read on two levels.
The prefecture-wide seasonal shape is twin-peaked in August and November — the trough is June
With the municipal tiers established, look at the prefecture’s monthly trend as a year-over-year overlay. Tochigi’s ADR has two peaks, in August and November, and its deepest trough in June. June 2026 at ¥8,622 (N=406) is the only month in the trailing 12 to fall below ¥9,000. At the other end, August 2025 came in at ¥12,470 (N=394) and November 2025 at ¥12,366 (N=382).
The November peak also stands out year over year: November 2025 was up 6.9% against the same month a year earlier, the largest gain of any month in the past two years. On top of the summer holidays, a nationwide demand period, autumn foliage forms an independent peak specific to Tochigi — that is the signature of this prefecture’s seasonal shape. Having two clear peaks, cool-season escape and foliage, is a structure that is comparatively easy to work with in designing revenue across the year.
Source: MetroEngines Research; compiled by the HotelBank Editorial Team
Nikko City is not one market — three price levels across Oku-Nikko, the city center and Kinugawa
The limitation of municipal data is that administrative boundaries do not match trade areas. Nikko City is the textbook case: the 2006 municipal merger placed the shore of Lake Chuzenji at 1,268m elevation, the Kinugawa gorge at 426m, and the shrine gateway town at 596m inside a single city. So instead of administrative units, the city was carved up by radius search from a set of points and aggregated as three trade areas.
Source: MetroEngines Research; Geospatial Information Authority of Japan (elevation) / compiled by the HotelBank Editorial Team
The result is unambiguous: three distinct price levels exist inside the same Nikko City. On a trailing 12-month average, the Lake Chuzenji / Oku-Nikko area runs ¥23,572 (N=7-8 properties), Kinugawa Onsen ¥20,003 (N=37-39), and central Nikko around Toshogu Shrine ¥16,128 (N=21-24). The city-wide average of ¥18,135 is simply a value that happens to fall between these three.
The three areas differ not only in level but in the shape of their seasons. Lake Chuzenji / Oku-Nikko climbs to ¥33,303 in November 2025 and falls to ¥18,670 by February 2026 — a wide 1.78x range. Kinugawa Onsen, by contrast, stays within ¥17,811-¥23,839, a range of 1.34x. Kinugawa, centered on onsen ryokan, has a product mix that draws demand year-round, whereas the highland resort depends heavily on the season. Even within the same city, the revenue management levers are entirely different.
Source: MetroEngines Research; compiled by the HotelBank Editorial Team
The foliage price peak shifts about four weeks with elevation — autumn 2025 in daily data
Movements that monthly figures cannot capture come through in daily published prices. For the 61 days from October 1 to November 30, 2025, published prices for each of the three areas were indexed on a 7-day moving average (each area’s 61-day mean = 100). This normalizes level so that shape can be compared.
The peaks landed as follows. Lake Chuzenji / Oku-Nikko peaked on October 26 at an index of 121.3, then declined steadily to the low 80s by late November. Kinugawa Onsen peaked on November 21 (index 109.4) and central Nikko on November 20 (index 105.3) — both arriving about four weeks later than Oku-Nikko. The natural phenomenon of leaves turning at different times between a lakeshore at 1,268m and a gorge and gateway town at 400-600m is written directly into the price curve.
Source: MetroEngines Research; compiled by the HotelBank Editorial Team (N = 14 properties in Lake Chuzenji / Oku-Nikko, 44 in Kinugawa Onsen, 52 in central Nikko / median of daily observations)
The height of the peak differs too. Oku-Nikko spans 81-121 on the index, a 40-point range, while central Nikko stays between 93 and 105, just 13 points. The higher the elevation, the more concentrated foliage demand becomes, and the more day-level price design pays off. Central Nikko, conversely, holds a gentle, elevated plateau from October through November, which suits a design aimed at capturing a stable level across the whole period.
This structure means that even when properties market the same “Nikko autumn foliage,” the week where pricing weight belongs differs by nearly a month depending on location. For a property in Oku-Nikko the peak demand week is the fourth week of October; for properties in Kinugawa and the city center it is the third and fourth weeks of November. Forward pricing for foliage demand behaves the same way across other destinations as well, but the time lag inside a single area is what stands out here.
The business tier — centered on Utsunomiya at ¥7,349, southern Tochigi holds a narrow range
Turning to the third tier, the business band. Utsunomiya City’s ADR averages ¥7,349 over the trailing 12 months (N=50), with a high of ¥8,218 in May 2026 and a low of ¥6,696 in January 2026. The annual swing stays at just 1.23x. Oyama City is narrower still at 1.11x (¥6,287, N=19), the least seasonal market in the prefecture.
The upside in the business tier sits inside that narrowness. A small swing can be read as room still remaining to add price on high-demand days of the week and event dates. Utsunomiya in particular has seen development advance along the eastern corridor of the Haga-Utsunomiya LRT (Light Line), which opened in 2023. Haga Town has positioned an extension into its town center as a priority item in its 7th development plan, with a study group including outside experts scheduled to be set up around fiscal 2027. For the western extension, Utsunomiya City has already published a plan for opening in March 2036. Changes to transit corridors move the points where lodging demand originates.
On the supply side, one project appears in the Ministry of Land, Infrastructure, Transport and Tourism’s Building Construction Statistics: 300 guest rooms across 14 floors in Ikegami-cho, Utsunomiya City, with construction scheduled for completion in October 2028. Note, however, that plans on a building-confirmation basis typically surface one to two years before opening, so the current count should be read as a floor on the confirmed pipeline. The number is expected to rise as further applications are filed. The absorption capacity for this project is covered in detail in Utsunomiya 300-Room Hotel Plan: LRT, Business Demand & +5% Supply.
Nasu Town’s lodging tax takes effect in October — where do its properties sit in the tiers?
On October 1, 2026, Nasu Town becomes the first municipality in Tochigi to levy a lodging tax. The rate is a six-step flat schedule based on the accommodation charge per person per night, from ¥100 below ¥10,000 up to ¥3,000 at ¥100,000 and above. Children under 12 and pupils and students on school trips are exempt. The town projects first-year revenue of ¥114 million.
From the standpoint of municipal rate structure, the question worth answering is which tiers Nasu Town’s properties actually fall into. Converting published prices for October 2026 (double occupancy, per-room) to a per-person basis and counting properties by tax bracket gives the following.
| Accommodation charge bracket (per person, per night) | Tax | Properties | Share |
|---|---|---|---|
| Under ¥10,000 | ¥100 | 20 | 21.5% |
| ¥10,000-¥20,000 | ¥300 | 50 | 53.8% |
| ¥20,000-¥30,000 | ¥500 | 13 | 14.0% |
| ¥30,000-¥50,000 | ¥800 | 9 | 9.7% |
| ¥50,000-¥100,000 | ¥1,500 | 1 | 1.1% |
| ¥100,000 and above | ¥3,000 | 0 | 0.0% |
N=93 properties (properties in Nasu Town for which October 2026 published prices could be obtained) / Source: MetroEngines Research; Nasu Town, “Introduction of the Nasu Town Lodging Tax”
A majority, 53.8%, falls into the “¥10,000 to under ¥20,000 (¥300)” bracket, with a median of roughly ¥13,900 per person. Weighting by the distribution of properties in the town, the average tax works out to about ¥346 per person-night, equivalent to roughly 2.5% of the published price (on a double-occupancy basis). The distribution is nearly identical in shape to October 2025, before the tax takes effect (55.6% in the ¥10,000-¥20,000 band), so the tier composition itself has not moved.
The pricing question raised by a flat-bracket schedule is the existence of thresholds. At ¥9,999 per person the tax is ¥100 (an effective 1.00%), but one yen more, at ¥10,000, makes it ¥300 (3.00%). Likewise, at the ¥20,000 threshold the effective rate steps from 1.50% to 2.50%, and at ¥50,000 from 1.60% to 3.00%. The absolute differences, however, are ¥200-¥700 — not a level that drives product design. The more practical question, for the roughly 20% of properties that cross the ¥10,000-per-person line in peak season, is operational: how to present the change in tax display within the booking path. For the design philosophy behind the rates themselves, Nasu vs Morioka Lodging Tax Oct 1: Tiered 1.0-3.0% vs Flat ¥200 compares the tiered and flat approaches.
How to read the thin-supply tier — do not describe single-digit-property municipalities with a standalone average
Finally, a word on the fourth tier, whose figures this article deliberately kept out of the foreground. Of the 23 municipalities in Tochigi with obtainable lodging data, nine have fewer than five properties eligible for the estimated settled ADR calculation. Shioya Town and Takanezawa Town, for instance, each had published prices for exactly one property, and that value simply mirrors the product design of that single inn. Mashiko Town, Shimotsuke City, Haga Town and Nasukarasuyama City likewise have one covered property each.
Saying “the town’s average rate is X yen” for such municipalities does not establish a market level. In practice, the appropriate treatment is either to view them as part of a wider area combined with adjacent municipalities, or to switch to property-level analysis. Any municipal comparison table needs to be read with the covered property count shown alongside. This applies well beyond Tochigi, to any prefecture with thin lodging supply per unit of area.
For the prefecture as a whole, MetroEngines Research covers 810 listed properties in Tochigi as of August 2026, of which 392 are in the verified categories eligible for ADR calculation. Prefecture-level aggregation has an ample base. It is only the cross-tier average that carries no meaning — the data itself is not thin.
Conclusion — read Tochigi by tier and elevation, not by prefecture
Breaking Tochigi’s lodging market down by municipality surfaces three things. First, the prefecture is a four-tier structure with roughly a 3.6x ADR spread, and a prefecture-wide average taken across tiers offers little to an individual property’s decision-making. Second, a single administrative area, Nikko City, contains three markets that differ in both level and seasonal shape. Third, the peak of foliage demand descends the mountain over about four weeks.
None of these three is visible from a prefecture-level benchmark. When selecting a competitive set for your own property, or evaluating a new trade area, there is real value in re-cutting the trade area by elevation, product characteristics and the source of demand rather than by administrative boundary. External shifts such as the Nasu Town lodging tax taking effect in October 2026 and development along the LRT corridor also become far more actionable once you identify which part of this tier structure they land on.
⚠ Note on methodology: ADR figures in this article are calculated over the 12 months from August 2025 to July 2026 on the settled basis (reconciled against actuals). Months from August 2026 onward are levels estimated from selling prices listed on OTAs and similar channels at the time of the survey; because that calculation method does not connect to the settled basis, those months are excluded from ADR time-series comparison. For the lodging-tax bracket distribution based on October 2026 published prices, the distribution may also shift as new plans are added and prices adjusted closer to the check-in date.
Related Reading
- Tochigi Booking Curves by Type: Resort 81.1% at T-45, Only +2.6pt Left
- Nasu vs Morioka Lodging Tax Oct 1: Tiered 1.0-3.0% vs Flat ¥200
- Utsunomiya 300-Room Hotel Plan: LRT, Business Demand & +5% Supply
- Iwate Hotel Market 2026: 2.2x ADR Gap, Morioka ¥200 Lodging Tax
- Tottori’s 3-Tier Hotel Market: Onsen ADR 2.16x the City Average
- Japan Autumn ADR 2026: 20 Prefectures Peak in Nov, Kyoto +81.8%
References and Sources
■ Data sources
MetroEngines Research municipality-level monthly aggregates (estimated settled ADR and published prices) and property-level published prices were used. Tochigi covers 23 municipalities, and the four comparison prefectures — Gunma, Fukushima, Ibaraki and Nagano — were re-aggregated on the same basis. The three trade areas inside Nikko City were carved out by radius search from a set of points rather than by administrative boundary. Elevation is from the Geospatial Information Authority of Japan; lodging-tax brackets and revenue projections are from materials published by Nasu Town.
■ Calculation assumptions
ADR covers the 12 months from August 2025 to July 2026 on the settled basis, and area-level figures use the median across covered properties. Municipal rankings are limited to municipalities with five or more covered properties, which in Tochigi means 14 municipalities. “Annual swing” is the highest month divided by the lowest month across the 12 months. The Nasu Town distribution by tax bracket was compiled by converting October 2026 published prices (double occupancy, per-room) to a per-person basis (N=93 properties). The daily price index is a 7-day moving average with each trade area’s 61-day mean for October-November 2025 set to 100.
■ Limitations and caveats
ADR is an estimate and differs from each property’s actual settled rates and accounting figures (cross-checked against property-level results disclosed by listed hotel REITs, the median error is approximately 7%). Months from August 2026 onward are on a published-snapshot basis whose calculation method does not connect to the settled basis, so they are excluded from ADR time-series comparison. For municipalities with fewer than five covered properties, the average cannot be treated as a market level. The lodging-tax bracket distribution may shift as new plans are added and prices adjusted closer to the check-in date. Supply plans are on a building-confirmation basis and should be read as a floor on the confirmed pipeline.
■ Market data
- MetroEngines Research — monthly ADR and published prices for 23 municipalities in Tochigi (August 2025 – July 2026, settled basis, N=392 properties); daily published prices for the three trade areas inside Nikko City (October-November 2025); property-level published prices in Nasu Town (October 2026, N=93 properties)
- MetroEngines Research — municipality-level monthly ADR for four neighboring prefectures (Gunma, Fukushima, Ibaraki and Nagano) (August 2025 – July 2026, settled basis, municipalities with five or more covered properties)
■ Government and public data
- Nasu Town, “Introduction of the Nasu Town Lodging Tax” (rate brackets, effective date, exemptions)
- Geospatial Information Authority of Japan, elevation API (Lake Chuzenji shore 1,268m / central Nikko 596m / Kinugawa Onsen 426m)
- Ministry of Land, Infrastructure, Transport and Tourism, “Building Construction Statistics” (Ikegami-cho, Utsunomiya City: 300 guest rooms, construction completion scheduled October 2028)
- Utsunomiya City, “Efforts toward realizing the East-West trunk public transit (LRT)”
■ Press and reference
- Shimotsuke Shimbun, “Nasu Town’s lodging tax projected to raise ¥114 million in its first year”
- Nikkei, “Utsunomiya LRT western extension to open in March 2036, city publishes plan”
- Nikkei, “Plan surfaces to extend Utsunomiya LRT into central Haga Town”
- Nikko City Tourism Association, Nikko Travel Navi, “Lake Chuzenji”