

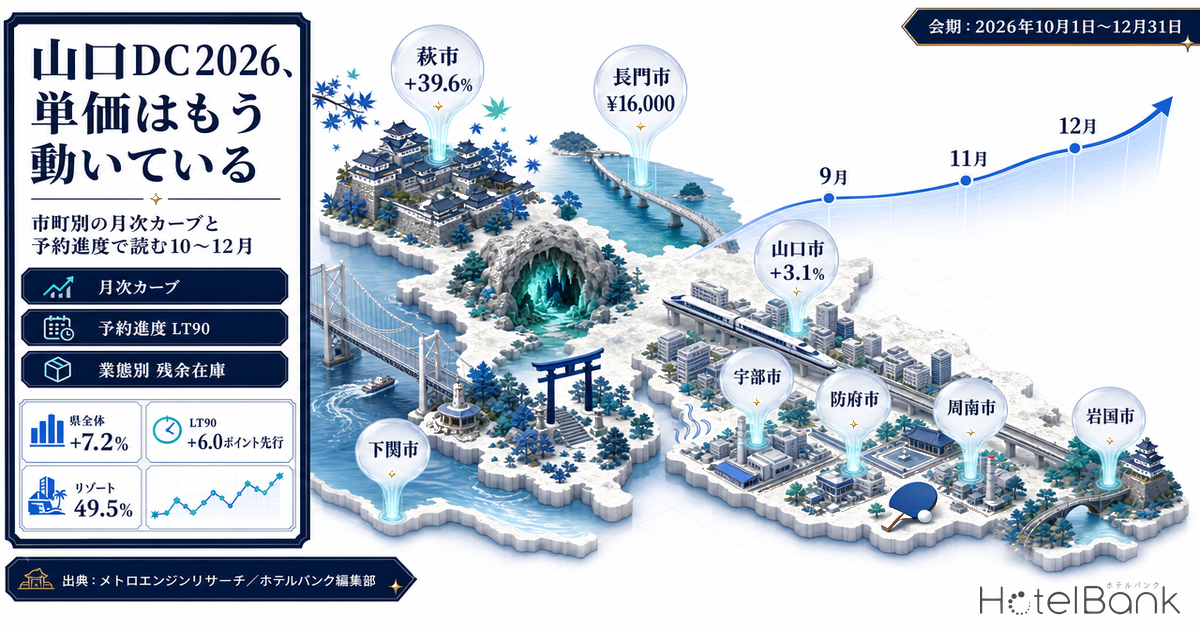
From October 1 to December 31, 2026, Yamaguchi Prefecture will host the Yamaguchi Destination Campaign (Yamaguchi DC), a large-scale tourism campaign. Run jointly by the JR Group and local governments, it is a nationwide visitor-generation program, and its catchphrase is “Manpuku no Tabi — Oidemase Fuku no Kuni, Yamaguchi” (A Journey of Abundance — Come to Yamaguchi, Land of Good Fortune). Room rates across the prefecture have already begun to move ahead of these three months.
This article examines monthly rate curves by municipality and booking pace, limited to the DC period (October–December 2026). Whereas our earlier Yamaguchi coverage dealt with the full-year ADR tier structure, here we narrow the focus to two questions: how much have October through December risen relative to a September baseline, and how far ahead is inventory depletion when compared at the same lead time? In other words, this is not a year-round market map but an analysis that isolates the campaign window along the time axis.
Metric Definitions Used in This Article
- ADR (average daily rate): An estimated settled rate (tax-exclusive equivalent) calculated by applying category-specific adjustment coefficients to the lowest published plan level each property lists on OTAs (double occupancy, per-room rate, tax included). Cross-checked against property-level results disclosed by listed hotel REITs (91 properties, most recent three months), the median error is approximately 7%. These are estimates and differ from each property’s actual transacted prices or accounting figures. Area-level ADR is the median across the target properties (the level of a typical property in that area).
- Published price: The average price of all plans listed on OTAs (double occupancy, per-room rate, tax included). Because its basis differs from ADR, we explicitly label it “published price” throughout this article to distinguish the two.
- OCC (occupancy rate): The share of rooms sold against total rooms in the area (an estimate based on OTA sales inventory).
- LT (lead time): Days until the check-in date. LT0 = same day.
- Data source: MetroEngines Research
- — Hagi up to +39.6% / Yamaguchi City +3.1% — Rate response across the three DC months varies by more than 30 points between municipalities, asymmetric between leisure destinations and business-demand cities.
- — Prefecture-wide, +4.9% to +7.2% versus September — The prefectural average smooths over municipal differences and, on its own, does not reflect the reality.
- — +6.0 points ahead at the same LT90 cross-section — Ordinary Saturdays in October averaged 72.3%, versus 66.3% for ordinary Saturdays in September (2026; 151–177 properties observed).
- — The upside is concentrated in ordinary weekends — Three-day holiday weekends sat at a comparable 74–76% at LT90 in both September and October; the DC-related gap appears on ordinary Saturdays.
- — Roughly half of resort-category inventory is unsold at LT90 — At 49.5–53.1% (13–14 properties observed), three months’ worth of campaign-period inventory remains, leaving substantial room for sales design.
The Yamaguchi DC framework — a three-year structure of pre-, main, and after-campaign
First, the dates as confirmed by primary sources. According to the Yamaguchi Prefectural Tourism Federation’s official campaign page and announcements from West Japan Railway Company (JR West), the main Yamaguchi DC period runs for three months, from October 1 to December 31, 2026. A pre-campaign period preceded it in October–December 2025, and an after-campaign period is set for October–December 2027. In effect, Yamaguchi is designed to receive a visitor-generation tailwind for three consecutive autumn-winter seasons, from 2025 through 2027.
A Destination Campaign is a large-scale tourism campaign carried out jointly by local governments, tourism operators, and the JR Group; on the Yamaguchi side, the organizing body is the Oidemase Yamaguchi Tourism Campaign Promotion Council. Table tennis player Kasumi Ishikawa, a Yamaguchi native, has been appointed special ambassador. Officially announced special programs include caving tours of normally closed sections of Akiyoshido Cave beneath the Akiyoshidai plateau, afternoon tea at the former Mōri Family Residence, and castle-town walking tours using historical maps.
What matters for accommodation operators is that these three months are confirmed in advance as a period when inflows from outside the prefecture will structurally increase. A period whose demand can be read is also a period whose pricing can be designed. Below, we use data to check how far that design has progressed.
Prefecture-wide, +7% versus September — but the average conceals the reality
Estimated settled ADR for Yamaguchi Prefecture as a whole stands at ¥11,200 in October (+6.7% versus September), ¥11,200 in November (+7.2%), and ¥11,000 in December (+4.9%), against ¥10,500 in September 2026 (N=156–187 properties). All three DC months exceed the immediately preceding month, but at the prefectural average the increase of +5% to +7% is a modest level — hardly what one would call a campaign windfall.
That prefectural average, however, smooths over large differences between municipalities. Yamaguchi’s accommodation market is an aggregate of areas with distinct characters: the leisure destinations on the Sea of Japan side (Hagi and Nagato), Shimonoseki across the Kanmon Strait, and the belt of business-demand cities strung along the Seto Inland Sea side (Yamaguchi City, Ube, Hōfu, Shūnan, and Iwakuni). For the nationwide picture of how far ADR ranges can spread between municipalities within a single prefecture, see Japan Intra-Prefecture ADR Gaps Reach 5.2x: 368 Municipalities Ranked. The next section breaks this down.
Hagi +40%, Yamaguchi City nearly flat — the asymmetry of rate pass-through
Plotting municipal curves as an index with September = 100 makes the difference in response unmistakable. Hagi has priced in substantial increases across all three DC months: +29.4% in October, +39.6% in November, and +34.2% in December. Nagato likewise accelerates through the back half, from +11.4% in October to +29.0% in November and +25.7% in December. Both cities peak in November, indicating that this is the month where the overlap of the autumn foliage season and the DC period bites hardest.
Source: MetroEngines Research; compiled by the HotelBank Editorial Team
The Seto Inland Sea-side cities, by contrast, show little response. Yamaguchi City is essentially flat at +2.1% in October, −0.3% in November, and +3.1% in December, while Ube remains limited to −0.5% in October, +5.5% in November, and +6.8% in December. Shimonoseki (+8.9% in October, +14.9% in November, +5.4% in December) and Iwakuni (+0.3%, +11.6%, +6.0%) sit in between, and Hōfu runs out of steam in the latter half of the period at +8.7% in October, +7.4% in November, and −0.7% in December.
This is not a case of the campaign failing to reach these areas. If anything, the opposite: for a three-month window whose demand can be read in advance, there are areas where the entire pricing-design opportunity is still untouched. The leisure destinations of Hagi and Nagato have already fully priced in the uplift, while the business-demand cities are heading into October–December at their ordinary September levels. That is where the upside lies.
| Municipality | Sep (baseline) | Oct | Nov | Dec | Max increase | N (Sep/Dec) |
|---|---|---|---|---|---|---|
| Hagi | ¥15,200 | ¥19,700 +29.4% | ¥21,200 +39.6% | ¥20,400 +34.2% | +39.6% | 17/13 |
| Nagato | ¥12,400 | ¥13,800 +11.4% | ¥16,000 +29.0% | ¥15,600 +25.7% | +29.0% | 22/16 |
| Shimonoseki | ¥11,600 | ¥12,600 +8.9% | ¥13,300 +14.9% | ¥12,200 +5.4% | +14.9% | 41/34 |
| Iwakuni | ¥9,000 | ¥9,000 +0.3% | ¥10,000 +11.6% | ¥9,500 +6.0% | +11.6% | 15/10 |
| Hōfu | ¥8,000 | ¥8,600 +8.7% | ¥8,500 +7.4% | ¥7,900 −0.7% | +8.7% | 8/8 |
| Ube | ¥8,800 | ¥8,800 −0.5% | ¥9,300 +5.5% | ¥9,400 +6.8% | +6.8% | 16/12 |
| Yamaguchi City | ¥10,400 | ¥10,600 +2.1% | ¥10,400 −0.3% | ¥10,700 +3.1% | +3.1% | 29/27 |
| Yamaguchi Prefecture total | ¥10,500 | ¥11,200 +6.7% | ¥11,200 +7.2% | ¥11,000 +4.9% | +7.2% | 187/156 |
Estimated settled ADR. Amounts are rounded to the nearest ¥100; percentage increases are calculated on unrounded values. N is the number of properties used in the estimate. Shūnan is excluded from the table above: its October estimate swings sharply in that single month (+54.3% versus September) and the number of observed properties also shifts (17 in September to 14 in October), so it may be affected by changes in the composition of the sample. It should not be read as a trend.
Source: MetroEngines Research; compiled by the HotelBank Editorial Team
Circle size = maximum increase during the DC period (versus September). Positions are approximate city centers. Source: MetroEngines Research; compiled by the HotelBank Editorial Team
Response patterns revealed by the pre-DC period (October–December 2025)
Useful here are the actual results from the pre-campaign period held one year earlier. October–December 2025 is settled historical data, allowing us to verify on a year-over-year basis which areas actually saw rates move. For how bookings and prices behaved on the ground after a DC opened, Fukushima DC One Month In: Did Bookings Move? OTA Pricing Reveals Campaign Impact follows the case of another prefecture, and reading the two together brings the pattern of response into focus.
Prefecture-wide, October 2025 was −5.9% year over year, November +4.3%, and December +6.0%. The opening month of October actually came in below the prior year, with the last two months recovering. By municipality, Shimonoseki responded most straightforwardly, rising in all three months at +25.3% in October, +17.1% in November, and +16.1% in December. Hagi started slowly at +0.9% in October but grew sharply in the back half, at +23.4% in November and +55.8% in December.
Source: MetroEngines Research; compiled by the HotelBank Editorial Team
By contrast, movement through October and November was sluggish in Yamaguchi City (−2.8% in October, −9.0% in November, +7.4% in December) and Nagato (−21.3%, −4.6%, +29.6%). In other words, the divergence in rate response between leisure destinations and business-demand cities was already visible at the pre-DC stage. The monthly curves now being priced in for the 2026 main period look like a straightforward reproduction of that asymmetry on a larger scale.
One further point is suggestive: the pattern of the effect landing in the back half of the period. In both the pre-DC results and the pricing for the main period, the peak increase comes not in October but in November and December. October is still hard to distinguish from ordinary autumn demand, and there appears to be a lag before additional campaign-driven visitors show up in the numbers, from November onward. For properties setting cautious prices in the opening month of October, a staged increase toward November and December is a natural design.
Booking pace: compared at the same LT90, October runs 6 pt ahead of September
Is the pricing being built in actually supported by booking pace? Using booking curves, we compare Saturdays in September and October at an aligned cross-section — the same lead time (LT90 = 90 days before check-in). Comparing inventory depletion on different dates directly would mix in differences in observation timing, so fixing the lead time is the basic approach.
At LT90, estimated occupancy for ordinary Saturdays in September (September 5, 12, and 26) averaged 66.3% (September 2026, at LT90; 151–168 properties observed). Against that, ordinary Saturdays in October (October 3, 17, and 24) averaged 72.3% — 6.0 points ahead. October 24 in particular reached 76.9%, higher than any ordinary Saturday in September. Published prices at the same point were also about 14% higher, at an October average of ¥27,200 versus a September average of ¥23,900.
Estimated occupancy is an estimate based on OTA sales inventory. Observed properties: 151–177. Source: MetroEngines Research; compiled by the HotelBank Editorial Team
One caveat is that the number of observable properties fluctuates by date. In thin cross-sections, apparent “troughs” or “surges” can arise. We have therefore also shown remaining rooms per observed property, dividing by the number of properties observed. Ordinary Saturdays in September averaged 27.3 rooms, versus 21.0 rooms for ordinary Saturdays in October. October’s lead is confirmed in this form too — roughly 23% fewer remaining rooms per property.
The treatment of three-day holiday weekends is interesting. September 19 (the first day of the three-day weekend including Respect for the Aged Day) was at 75.9% at LT90, and October 10 (the first day of the three-day weekend including Sports Day) at 74.3% — essentially the same level. Three-day weekends are inherently strong, DC or no DC. Conversely, that means the DC-period upside is occurring on ordinary weekends, which is a basis for revisiting pricing design for ordinary weekends. Weekdays likewise show only a slight lead of +1.9 points — 67.2% for Wednesday, October 14, against 65.3% for Wednesday, September 16 — so the upside is concentrated on weekends.
Where the remaining inventory sits — depletion speed by property category
Breaking the same LT90 cross-section down by property category narrows further where the upside sits. Estimated occupancy for Saturday, September 26 → Saturday, October 17 → Saturday, October 24 (all 2026, at LT90) runs 65.5% → 68.8% → 76.3% for ryokan (53–57 properties observed) and 69.4% → 74.1% → 79.3% for business hotels (58–79 properties), with both clearly accelerating toward October.
At LT90. Estimated occupancy is an estimate based on OTA sales inventory. The city hotel category is a reference figure only, as the sample is small at 5–9 properties observed. Source: MetroEngines Research; compiled by the HotelBank Editorial Team
The resort hotel category, by contrast, is essentially flat at 51.1% → 49.5% → 53.1% (same basis, 2026, at LT90; 13–14 properties observed). That means roughly half of the rooms are still available for sale at LT90. With a sample of only 14 properties this cannot be stated definitively, but it is likely that Yamaguchi’s resort tier is holding three months’ worth of campaign-period inventory in bulk. The DC period is a window in which new inflows from outside the prefecture can be anticipated, and therefore an opportunity to reach segments that are ordinarily hard to connect with. This is an area with substantial room to grow, depending on how early the sales design is put in place. On the broader relationship in category-level curves — whether categories that are high early have less room for last-minute gains — we examine this separately in Tochigi Booking Curves by Type: Resort 81.1% at T-45, Only +2.6pt Left.
Summary: three pockets of upside still available
Organizing the data, the upside available ahead of the Yamaguchi DC period falls into the following three layers.
| Where the upside sits | Evidence in the data | Direction of design |
|---|---|---|
| 1. Business-demand cities Yamaguchi City, Ube, Hōfu | Estimated ADR across the three DC months is −0.7% to +8.7% versus September — essentially ordinary levels. The gap versus Hagi (up to +39.6%) exceeds 30 points | Set up weekend plans that highlight proximity and access to leisure destinations. Protect weekday business demand while separating out a leisure price band for weekends only |
| 2. Remaining inventory in the resort tier | Estimated occupancy at LT90 is 49.5–53.1%, a gap of 15–30 points versus ryokan and business hotels (68.8–79.3%) (13–14 properties observed) | Design sales for all three campaign months as a single block and pull bookings forward with early-booking incentives |
| 3. The ordinary-weekend price band | Three-day weekends sit at a comparable 74–76% at LT90 in both September and October. The upside is concentrated on ordinary Saturdays (66.3% in September → 72.3% in October) | Revisit the conventional design of treating only three-day weekends as special, and set a staged price curve for ordinary Saturdays during the campaign as well |
One more thing worth keeping in mind is how to use the time axis. In both the pre-DC period (2025) and the pricing for the main period, rate growth is larger in November and December than in October. A staged design — holding back in the opening month and raising rates from November — is consistent with the past year’s results. December is somewhat weaker than October and November prefecture-wide at +4.9% versus September, and areas split between those holding high levels, like Hagi (+34.2%), and those returning to ordinary levels, like Hōfu (−0.7%). How to build the final month of the campaign remains a blank page in many areas.
And for Yamaguchi, these three months are not a one-off event. An after-campaign period is scheduled for October–December 2027. How far rate levels can be lifted during the 2026 period, and how far those levels can be entrenched as repeat demand, will set the baseline for the years that follow.
⚠ Note on ADR for future dates: The ADR figures for August 2026 onward covered in this article are levels estimated from sales prices published on OTAs as of the research date (July 2026), and they will shift as new plans are added and prices are adjusted closer to the check-in date. Particularly for a period such as the DC window, where sales design is still progressing, current levels will not necessarily match actual market outcomes. In addition, because actual results through June 2026 and estimates from July 2026 onward are calculated on different bases, we have not compared rates of change spanning the two. All year-over-year verification is conducted between past months for which results are settled.
Related Reading
- Fukushima DC One Month In: Did Bookings Move? OTA Pricing Reveals Campaign Impact
- Tochigi Booking Curves by Type: Resort 81.1% at T-45, Only +2.6pt Left
- Japan Intra-Prefecture ADR Gaps Reach 5.2x: 368 Municipalities Ranked
- Gunma Hotel Market 2026: Four ADR Tiers and a ¥5,700 Upper-Mid Gap
References and Sources
■ Primary campaign information
- [Official] Yamaguchi Destination Campaign (Yamaguchi DC) special site | Oidemase Yamaguchi (Yamaguchi Prefectural Tourism Federation)
- The Yamaguchi Destination Campaign (DC), a large-scale tourism campaign, is coming | Oidemase Yamaguchi (Yamaguchi Prefectural Tourism Federation)
- Destination Campaign confirmed for Yamaguchi Prefecture in autumn 2026 (West Japan Railway Company, April 18, 2024)
- Yamaguchi Destination Campaign pre-campaign (Oidemase Yamaguchi Tourism Campaign Promotion Council / West Japan Railway Company, August 20, 2025)
- Guide to sightseeing trains operating in Yamaguchi Prefecture, October–December (West Japan Railway Company, July 23, 2026)
- JR Group’s major 2026 campaign goes to Yamaguchi Prefecture, with special experiences on the theme of “Manpuku no Tabi” (Travel Voice, December 2, 2024)
■ Market data
- MetroEngines Research — estimated settled ADR (by municipality, monthly, N=8–41 properties), published prices, booking curves and estimated occupancy (Yamaguchi Prefecture overall, 151–177 properties observed)
■ Data sources
Estimated settled ADR and published prices are aggregated figures from MetroEngines Research (monthly by municipality; N=8–41 properties within Yamaguchi Prefecture / N=156–187 properties prefecture-wide; retrieved July 2026). Booking pace and estimated occupancy are aggregations based on the same firm’s OTA published-inventory data (Yamaguchi Prefecture overall, at a lead time of 90 days, 151–177 properties observed). The campaign period, organizing framework, and special programs are based on materials published by the Yamaguchi Prefectural Tourism Federation and West Japan Railway Company.
■ Calculation assumptions
Municipal increase rates use September 2026 as the baseline (100) and are calculated on unrounded estimated settled ADR (displayed amounts are rounded to the nearest ¥100). Booking-pace comparisons are made at an identical cross-section with lead time fixed at 90 days, so that differences in observation timing are not mixed in, using the simple average of ordinary Saturdays (September 5, 12, and 26 / October 3, 17, and 24). Year-over-year verification is limited to past months for which results are settled.
■ Limitations and caveats
ADR is an estimate derived from OTA published prices and differs from each property’s actual transacted prices or accounting figures (cross-checked against property-level results disclosed by listed hotel REITs, the median error is approximately 7%). Dates from August 2026 onward are in the future and will shift as sales design progresses. The number of observed properties varies by date and month, and apparent fluctuations can arise in thin cross-sections; accordingly, Shūnan (17 → 14 properties observed) is excluded from the table and not read as a trend, while the resort category (13–14 properties observed) and the city hotel category (5–9 properties observed) are treated as reference figures. This article describes the relationship between the campaign and rate movements; it does not assert causation.