

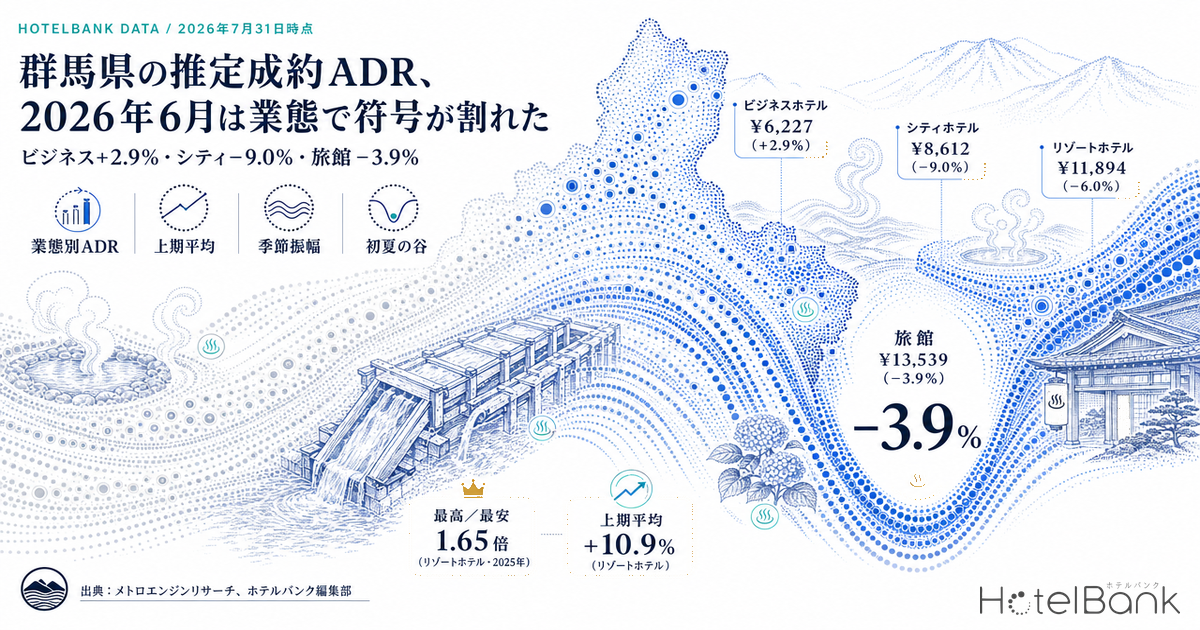
Gunma Prefecture’s estimated settled ADR for June 2026 (finalized values) split by sign across hotel categories. Business hotels came in at ¥6,227 (N=103 properties, +2.9% YoY), above the prior year, while city hotels at ¥8,612 (N=13 properties, −9.0%), ryokan at ¥13,539 (N=285 properties, −3.9%) and resort hotels at ¥11,894 (N=34 properties, −6.0%) all fell short of the same month a year earlier. Yet look at the same four categories averaged across January–June 2026 and three of them turn positive: business hotels +5.3%, ryokan +3.8%, resort hotels +10.9%. That gap between the single-month sign and the first-half sign is exactly where any discussion of rate design in Gunma — a prefecture with a high share of onsen ryokan — has to start.
Coverage: Gunma Prefecture business hotels N=103 / city hotels N=13 / ryokan N=285 / resort hotels N=34 (all on a June 2026 finalized-value basis). Price figures in this article are estimated settled ADR (the transaction price level inferred from OTA and other sales data, pre-tax equivalent); occupancy is an estimate based on OTA-listed inventory. Full definitions appear at the end of the article. Data as of July 31, 2026.
- — June 2026 estimated settled ADR split by sign across categories — business hotels ¥6,227 (+2.9% YoY) against city hotels −9.0%, ryokan −3.9% and resort hotels −6.0%.
- — On a first-half average, three categories are positive — business +5.3%, ryokan +3.8%, resort +10.9%. The single-month sign and the first-half sign disagree.
- — Against June 2024, all four categories are negative — positive YoY readings largely reflect a rebound from last year’s dip; levels have not returned to where they stood two years ago.
- — Annual amplitude differs by nearly 1.5x across categories — the 2025 peak-month to trough-month ratio runs from 1.65x for resort hotels down to 1.14x for business hotels. Match the granularity of rate revisions to the amplitude.
- — The June trough for ryokan is now three years running — June 2026’s ¥13,539 is the lowest level across the 30 finalized months. Handling a trough is decided in the prior year’s design phase, not in-season.
June 2026 finalized values — three of four categories below the prior year
First, a note on what is being compared. The estimated settled ADR used here is calculated as a finalized value (history basis) for past months, and as an estimate based on current sales conditions (forward_snapshot basis) for the current and future months. Comparing values built on different bases changes the meaning of the difference, so every YoY figure in this article pairs finalized months with finalized months. For Gunma, the most recent month with complete finalized values is June 2026; months from July 2026 onward sit on a different basis and are therefore excluded from the YoY comparisons.
The table below shows that June 2026. Alongside the prior-year month (June 2025), June 2024 is included as a baseline year. All are same-month comparisons between finalized values.
| Category | June 2024 | June 2025 | June 2026 | YoY | vs June 2024 |
|---|---|---|---|---|---|
| Business hotels | ¥6,347 N=97 | ¥6,052 N=98 | ¥6,227 N=103 | +2.9% | −1.9% |
| City hotels | ¥8,656 N=11 | ¥9,468 N=11 | ¥8,612 N=13 | −9.0% | −0.5% |
| Ryokan | ¥14,165 N=301 | ¥14,090 N=289 | ¥13,539 N=285 | −3.9% | −4.4% |
| Resort hotels | ¥12,842 N=32 | ¥12,656 N=33 | ¥11,894 N=34 | −6.0% | −7.4% |
Source: compiled by the HotelBank Editorial Team from MetroEngines Research
In absolute yen terms, the move from the prior-year month is +¥175 for business hotels, −¥856 for city hotels, −¥551 for ryokan and −¥762 for resort hotels. City hotels’ −9.0% is the largest in percentage terms, but the sample is thin at N=13, so a change in the mix of a single property can move the level. Given that the count also rose by two properties from N=11 a year earlier, the practical read on city hotels is the level itself — the ¥8,600 range — rather than the percentage.
Ryokan’s ¥13,539, meanwhile, is the lowest level across the 30 finalized months since January 2024. The next lowest is June 2024’s ¥14,165, which confirms for a third consecutive year that June is the annual trough for Gunma ryokan. In 2026, however, that trough sank a further ¥551 below the prior year’s. Resort hotels’ ¥11,894 is the third lowest across those same 30 months, with only April 2025’s ¥11,614 and April 2026’s ¥11,672 below it. In other words, Gunma’s two stay-oriented categories (ryokan and resort hotels) carry two troughs — April and June — and in 2026 those troughs ran deeper than the year before.
Source: compiled by the HotelBank Editorial Team from MetroEngines Research
The picture changes over the six-month first half — YoY signs flipped as the months went on
Looking at June alone, three of four categories are below the prior year. Line up the six finalized months from January to June 2026, however, and a different picture emerges. On a simple average of the monthly estimated settled ADR, the first-half average moved from ¥6,156 to ¥6,482 (+5.3%) for business hotels, ¥14,733 to ¥15,300 (+3.8%) for ryokan and ¥13,692 to ¥15,190 (+10.9%) for resort hotels — three categories positive. The only negative is city hotels, from ¥9,067 to ¥8,622 (−4.9%).
Why do the single month and the first half disagree? The answer lies in how the monthly YoY figures moved. For ryokan, the growth rate shrank consistently — +14.1% in January, +7.0% in February, +5.0% in March, +1.4% in April — then turned negative at −0.8% in May and fell to −3.9% in June. Resort hotels were more extreme still, dropping from +26.8% in January and +32.7% in February to +9.7% in March, +0.5% in April, −1.0% in May and −6.0% in June. Those large winter gains are also the flip side of a low comparison base in the winter of 2025. In fact, ryokan in January 2025 was −2.9% against January 2024 and February 2025 was −5.8% against February 2024; resort hotels were −7.9% and −6.3% on the same comparisons. The weaker the prior year in a given month, the larger the YoY figure comes out.
To test that point, the rightmost column of the table above compares June 2026 with June 2024. Business hotels −1.9%, city hotels −0.5%, ryokan −4.4%, resort hotels −7.4% — over a two-year span, all four categories are negative. Even business hotels, the only category positive on a YoY basis, have not returned to the level of two years ago. What the finalized values support is that the positive first-half averages contain a large component of “recovery from last year’s dip,” and that there is not enough evidence to read the level itself as having built up. This divergence in YoY direction across combinations of category and region is not unique to Gunma; the same structure appears when the same June 2026 is broken down nationally by prefecture and category, as covered in our analysis of price polarization widening across hotel categories in 2026.
Source: compiled by the HotelBank Editorial Team from MetroEngines Research
Business hotels alone exceeded the prior-year month in all six months (+6.8% in January, +10.3% in February, +5.7% in March, +1.1% in April, +5.2% in May, +2.9% in June). The peak growth rate came in February, though, and the margin has narrowed since. Accommodation demand centered on Maebashi and Takasaki carries a heavier weighting of business travel, and the resulting price movement is calmer than in the stay-oriented categories — which is plausibly what shows up in this stable sign. On how price bands within Gunma form distinct layers once you break the prefecture down to the municipal level, see our analysis reading the Gunma accommodation market in four tiers — Kusatsu, Ikaho, Shima/Minakami, and Maebashi/Takasaki.
Seasonal amplitude differs by category — and that sets the rate-revision cycle
Behind the split in YoY direction across categories in Gunma lies a more basic fact: the annual range of price movement is completely different from one category to the next. The table below pulls the peak and trough months of monthly estimated settled ADR for 2025, the most recent calendar year with a complete 12 months of finalized values.
| Category | 2025 peak month | 2025 trough month | Peak / trough | Jan–Jun 2026 average (YoY) |
|---|---|---|---|---|
| Business hotels N=103 | Aug ¥6,732 | Feb ¥5,907 | 1.14x | ¥6,482 +5.3% |
| City hotels N=13 | Aug ¥11,519 | Jan ¥8,409 | 1.37x | ¥8,622 −4.9% |
| Ryokan N=285 | Dec ¥18,742 | Jun ¥14,090 | 1.33x | ¥15,300 +3.8% |
| Resort hotels N=34 | Dec ¥19,161 | Apr ¥11,614 | 1.65x | ¥15,190 +10.9% |
Source: compiled by the HotelBank Editorial Team from MetroEngines Research. Property counts are the observed counts in the June 2026 finalized values.
Against resort hotels’ 1.65x, business hotels sit at 1.14x. Within the same prefecture, the annual range of price movement differs by nearly 1.5 times across categories. What matters here is that the larger the amplitude, the more the YoY figure swings. For resort hotels, with a 1.65x amplitude, a few hundred yen of drift in the peak-month setting moves the YoY figure by several percentage points. Conversely, for business hotels at 1.14x, a move of roughly ±3% YoY sits within the normal annual range. The same “−6.0%” does not carry the same operational impact once the category changes.
The position of the peak and trough months differs by category as well. Business and city hotels peak in August, while ryokan and resort hotels peak in December; ryokan bottom in June and resort hotels in April. The two stay-oriented categories carry their peaks in the year-end/New Year period and winter onsen demand, with a trough in early summer. For stay-oriented properties versus business-travel-oriented ones, in other words, the month in which rate revisions should be prepared is shifted by half a year.
Source: compiled by the HotelBank Editorial Team from MetroEngines Research
Overlaying three years of ryokan data shows the June trough appearing in the same position every year. In 2026 that trough is the deepest of the three at ¥13,539. Meanwhile 2025 posted ¥17,972 in November and ¥18,742 in December, higher levels into year-end than either of the prior two years, so the shape across the year is widening toward “a deeper early-summer trough and a higher year-end peak.” A widening gap between trough and peak also means that the rate required in peak periods to secure the same annual average goes up.
August–September, currently on sale — how estimated OCC is building
Having checked the past through finalized values, it is worth also covering the state of stay dates currently on sale. Below, estimated OCC (on an OTA-listed-inventory basis) for Gunma ryokan and business hotels is lined up at three fixed points: 45 days before the stay date, 30 days before, and the latest observation. This looks only at inventory absorption, not price.
| Stay date | Category | T-45 | T-30 | Latest observation | T-45 → latest |
|---|---|---|---|---|---|
| Aug 8 (Sat) | Ryokan | 71.9% | 76.5% | 82.9% | +11.0pt |
| Business hotels | 80.1% | 86.8% | 96.8% | +16.7pt | |
| Aug 14 (Fri) | Ryokan | 74.6% | 75.4% | 79.4% | +4.8pt |
| Business hotels | 73.0% | 77.2% | 83.4% | +10.4pt | |
| Aug 19 (Wed) | Ryokan | 63.2% | 67.7% | 70.0% | +6.8pt |
| Business hotels | 74.0% | 76.9% | 79.3% | +5.3pt | |
| Aug 22 (Sat) | Ryokan | 72.3% | 76.0% | 77.8% | +5.5pt |
| Business hotels | 82.8% | 86.1% | 87.9% | +5.1pt | |
| Sep 5 (Sat) | Ryokan | 68.5% | — | 70.2% | +1.7pt |
| Business hotels | 72.3% | — | 74.1% | +1.8pt |
Source: compiled by the HotelBank Editorial Team from MetroEngines Research. Sep 5 has not yet passed the T-30 fixed point, hence “—”.
August 8 is the stay date with the largest build-up from T-45 to the latest observation for both ryokan and business hotels, at +11.0pt and +16.7pt respectively. Wednesday, August 19, by contrast, starts from the lowest point among the stay dates shown, with ryokan at 63.2% at T-45. A weekday past the midpoint of the Obon period, in other words, begins around 9pt below the Saturdays at the T-45 stage. Saturday, September 5 stood at 68.5% for ryokan and 72.3% for business hotels at T-45 — a lower starting point than the August Saturdays — but it has not yet passed the T-30 fixed point, so evaluating the build-up from here will take time. On how the height of the T-45 starting point relates to the room left to grow in the final stretch, our tracking of neighboring Tochigi Prefecture across four categories in Tochigi booking curves by category for August–September 2026 is also worth a look.
For revenue managers running hotels and ryokan in Gunma — implications and an action plan
(a) Insights from an operating perspective
1. Do not describe “the prefecture’s market” with a single number. June 2026 YoY split by sign: business hotels +2.9% against city hotels −9.0%, ryokan −3.9% and resort hotels −6.0%. When benchmarking your own results against the market, the yardstick should be the series for your own category, not the prefecture-wide average. Ryokan and resort hotels in particular share the position of their peaks and troughs — a December peak and a June or April trough — while business and city hotels peak in August, so the seasonal shape you should be referencing is itself different.
2. Look at how far the level has recovered, not at the single-month sign. On first-half averages, three categories are positive (business +5.3%, ryokan +3.8%, resort +10.9%), but comparing June 2026 with June 2024 turns all four negative. A positive YoY figure does not necessarily mean the level of two years ago has been regained. When building an annual budget, there is room to place the same month’s level from two years ago alongside the most recent YoY figure and check how much ground has actually been recovered.
3. The size of the amplitude sets the granularity that rate revisions require. The 2025 peak-to-trough ratios are 1.65x for resort hotels, 1.37x for city hotels, 1.33x for ryokan and 1.14x for business hotels. Running fine-grained monthly revisions in a category with a 1.14x amplitude has limited effect, whereas in a 1.65x category the quality of the peak-month setting feeds straight through to the annual average rate. The frequency and granularity of revisions is best set at a level commensurate with your own category’s amplitude.
4. The early-summer trough arrives in the same position every year. Gunma ryokan have had June as their annual trough for three consecutive years — 2024, 2025 and 2026 — and June 2026’s ¥13,539 is the lowest across the 30 finalized months. If the trough is structural, then whether to fill it with discounting or with weekday products and purpose-of-stay design is a question to settle in the prior year rather than in-season.
(b) Action plan
| Time horizon | Action | Decision trigger | Objective |
|---|---|---|---|
| Today–this week | Pull out only your own category’s series and reconcile your June 2026 results against the market’s finalized values | Set the baseline at ¥13,539 (N=285) if you are a ryokan, ¥6,227 (N=103) for a business hotel, ¥8,612 (N=13) for a city hotel, or ¥11,894 (N=34) for a resort hotel | Locate your position using your own category rather than the prefecture average as the yardstick |
| Today–this week | Sort the August dates still on sale into those with high and low T-45 starting points | Whether your property also has dates starting as low as ryokan’s 63.2% at T-45 on Wednesday, August 19 | Prioritize which stay dates to focus on over the remaining selling period |
| Within two weeks | Line up estimated OCC at the latest observation against your own booking pace and identify dates where the gap in progress is large | Whether your property is clearly behind on Saturday, August 8, where the market has built up to 82.9% for ryokan and 96.8% for business hotels | Decide how to release remaining inventory and whether to revisit selling conditions |
| Within two weeks | Add early-September Saturdays to the monitoring set, using the T-45 fixed point as the reference | The market’s Saturday, September 5 starts lower than the August Saturdays at T-45, at 68.5% for ryokan and 72.3% for business hotels | Bring the early-autumn shoulder period under observation at an early stage |
| Looking to next month | Redraw the annual rate-revision calendar to match the position of your own category’s peaks and troughs | The difference in shape: ryokan and resort hotels peak in December with troughs in June and April, while business and city hotels peak in August | Align the timing of revision preparation with your category’s seasonal shape |
| Looking to next month | Redesign the frequency and step size of revisions to suit your own category’s annual amplitude | The gap between resort hotels’ 1.65x and ryokan’s 1.33x peak-to-trough ratios versus business hotels’ 1.14x | Avoid over-engineering revision operations in low-amplitude categories |
Source: compiled by the HotelBank Editorial Team from MetroEngines Research
Conclusion — three yardsticks for reading Gunma’s estimated settled ADR
Yardstick 1: do not mix categories. June 2026 YoY: business hotels +2.9% (N=103), city hotels −9.0% (N=13), ryokan −3.9% (N=285), resort hotels −6.0% (N=34). As long as the signs split within the same prefecture and the same month, the prefecture-wide average does not serve as a benchmark for your property.
Yardstick 2: read the single month, the first half and two years ago as three points. Three categories are positive on first-half averages, yet all four are negative against June 2024. Looking only at the YoY sign misses how far the level has actually recovered.
Yardstick 3: let amplitude set the granularity of revisions. The 2025 peak-to-trough ratio ranges from 1.65x for resort hotels down to 1.14x for business hotels. In a category like ryokan, where the trough lands in the same position every year (June for three years running), the decisive work happens in the prior year’s design phase rather than in-season.
About the data
| Definition of estimated OCC | Occupancy on an OTA-listed-inventory basis = 100 − 100 × rooms remaining on OTA listings ÷ total rooms. This is an estimate based on how inventory sold on OTAs is being absorbed, and its definition differs from actual room occupancy (it reads higher). |
| Booking curve | Based on observations from 45 days before the stay date through to the most recent observation. Coverage is Gunma Prefecture ryokan and business hotels, for stay dates August 8, August 14, August 19, August 22 and September 5, 2026. |
| Definition of estimated settled ADR | The transaction price level (pre-tax equivalent) estimated from OTA and other sales data (lowest-plan price level × category-specific coefficients, ensembled across multiple channels). Past months are finalized values; the current and future months are estimates based on current sales conditions. Reconciliation against published operating results leaves a median error of 6.6%. All YoY and two-year comparisons in this article are calculated between pairs of finalized values; months from July 2026 onward sit on a different basis and are excluded from the comparisons. |
| Breakdown of N | Observed property counts in the June 2026 finalized values are N=103 business hotels, N=13 city hotels, N=285 ryokan and N=34 resort hotels. For June 2025 the counts were N=98 / N=11 / N=289 / N=33, and for June 2024, N=97 / N=11 / N=301 / N=32. Observed property counts for the booking curve vary by stay date and observation date, ranging from 188 to 221 properties for ryokan and 75 to 84 for business hotels at each fixed point. |
| Data as of | Data as of July 31, 2026. Sales conditions and inventory change daily, so the figures in this article are a snapshot at the time of retrieval. |
■ Data sources
Both estimated settled ADR and estimated OCC come from aggregated MetroEngines Research data. Monthly estimated settled ADR is retrieved at the prefecture × category level, and booking curves at the stay date × category level. No external published statistics are used; all figures in this article are our own aggregated values.
■ Calculation assumptions
YoY and two-year comparisons are calculated only between pairs of finalized values (history basis). Months from July 2026 onward, which mix in estimates on a different basis (forward_snapshot basis), are excluded from the comparisons. The first-half average is a simple average of the monthly values for January–June 2026, with no weighting by property count or rooms sold. Annual amplitude is calculated as the peak month divided by the trough month of the 2025 monthly finalized values.
■ Limitations and caveats
First, estimated settled ADR is not the actual transaction rate itself; reconciliation against published operating results leaves a median error of 6.6%. Second, the observed property count (N) is a snapshot at the time of aggregation, and even past months can move by a few properties through later retroactive updates. The N values in this article are as of July 31, 2026 and are not a definitive population size, so while they can be used for comparing levels, changes in N itself should not be read as changes in the number of properties in the market. Third, city hotels have a thin base at N=13, where the turnover of a single property can move the prefecture-wide level. Fourth, estimated OCC is on an OTA-listed-inventory basis and reads higher than actual room occupancy, making it unsuitable for direct comparison with your own PMS results.