

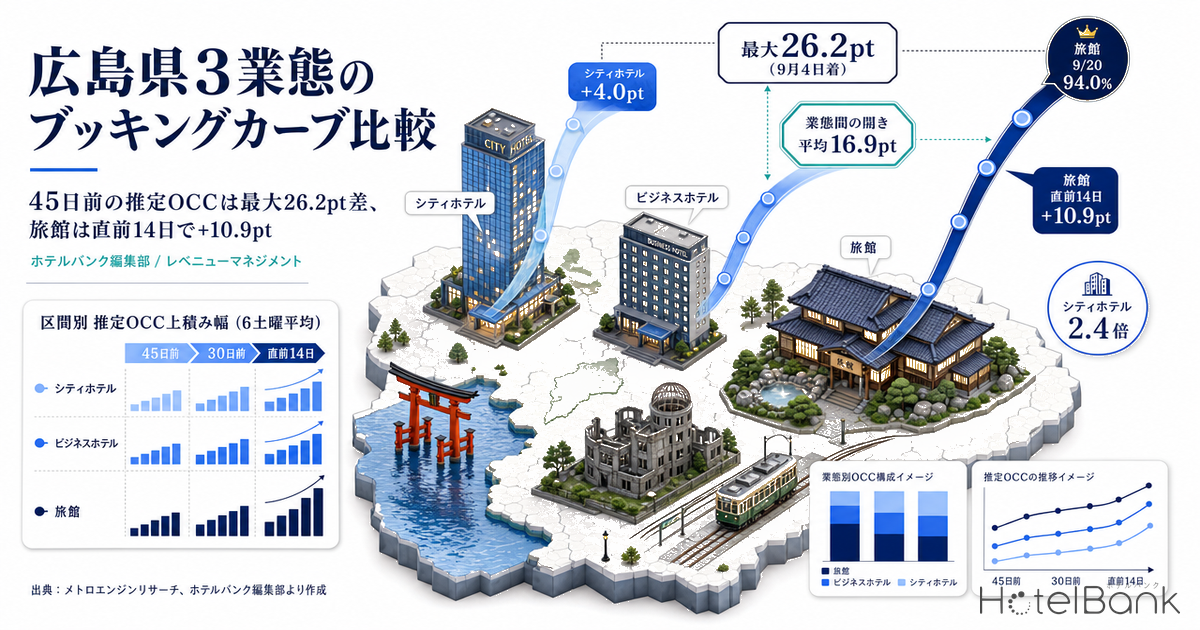
Line up Hiroshima’s booking curves across three segments — city hotels, business hotels and ryokan — and how much has accumulated by 45 days out differs completely, even for the same stay date. Across the 43 arrival dates from August 13 to September 25, 2026 (excluding one cross-section with too few properties observed), the spread in estimated OCC at 45 days out averaged 16.9pt between segments and reached a maximum of 26.2pt (September 4 arrival). On the average curve for six Saturdays whose stay dates have already passed, meanwhile, ryokan added +10.9pt in the final 14 days alone — 2.7 times the +4.0pt of city hotels. A low reading at 45 days out does not, by itself, mean “not selling.” This article uses three checkpoints — 45 days out, 30 days out and the latest observation — to set out where each segment should decide to firm up rates.
About the Data in This Article | Coverage: Hiroshima Prefecture / city hotels N=27 properties (4,655 rooms), business hotels N=163–167 properties (18,574–19,012 rooms), ryokan N=60–61 properties (1,382–1,409 rooms). Occupancy in this article is an estimate based on OTA-listed inventory (estimated OCC); price metrics are not covered. Definitions appear at the end of the article. Data as of August 12, 2026.
- — Estimated OCC at 45 days out differs by an average of 16.9pt across segments (city 81.8%, business 68.7%, ryokan 64.9%; widest 26.2pt on the September 4 arrival).
- — Day-before levels converge to within just over 3pt — 93.3%, 92.5% and 90.2%. A low reading at 45 days out shows a different curve shape, not weak selling.
- — Ryokan add +10.9pt in the final 14 days alone, concentrating 50% of their total pickup from 45 days out to the day before into two weeks — 2.7 times city hotels (+4.0pt).
- — City hotels gain only +9.3pt from 45 days out to the day before. With little runway to recover, the 45-days-out cross-section becomes the effective final adjustment point.
- — The five-day September 19–23 holiday run swings 37.2pt at 45 days out (ryokan: 94.0% on 9/20 against 56.8% on 9/23). Pricing the run as one block leaves the last day behind.
The 45-Days-Out Cross-Section — a 16.9pt Average Gap, 26.2pt at the Widest
First, for each stay date we pull out only the estimated OCC observed 45 days before that date. This is a cross-section showing where the market stands in the early build-up phase, rather than how far the curve has progressed. The scope is the 44 arrival dates from August 13 to September 25, 2026. Of these, the 45-days-out cross-section for the August 16 arrival covers only 3–14 properties, so it is excluded from the reading and left blank in the chart (a single date, originating from the same observation day).
The average across the remaining 43 dates is 81.8% for city hotels, 68.7% for business hotels and 64.9% for ryokan. City hotels stay inside a band of just under 15pt (minimum 75.5% to maximum 90.4%), while business hotels swing across roughly 30pt (54.9%–84.4%) and ryokan across roughly 42pt (51.6%–94.0%) from date to date. The gap between city hotels and ryokan averaged 16.9pt, widening to 26.2pt on Friday, September 4 and narrowing to 1.1pt on Friday, August 14. Underneath these arrival-date readings sits a separate weekly pattern: in a normal week, Hiroshima’s business hotels trough on Sundays and peak on Thursdays.
Source: Compiled by the HotelBank Editorial Team from MetroEngines Research
The September 19–23 stretch stands out. In 2026, September 21 is Respect for the Aged Day, September 22 is a Citizens’ Holiday and September 23 is the Autumnal Equinox, giving five consecutive days off from Saturday, September 19. Only across these five days does the ranking at 45 days out flip. Ryokan reached 94.0% on Sunday, September 20 and 93.7% on Monday, September 21, above city hotels (90.4% and 88.3%); across the 43 dates covered, those three days (9/19, 9/20 and 9/21) were the only ones where ryokan sat above city hotels. Ryokan averaged 62.7% on the other 38 dates, leaving a gap of more than 30pt against the middle of the holiday run.
At the same time, Wednesday, September 23 — the final day of the run — falls well below the opening days, to 56.8% for ryokan and 62.6% for business hotels. Demand to stay on the last night is thin, so laying the same aggressive setting across the run as a single block leaves that day behind.
| Stay date | Day / holiday | City (21–27 properties observed) | Business (146–164 properties observed) | Ryokan (46–61 properties observed) |
|---|---|---|---|---|
| 9/19 | Sat | 84.1% | 76.7% | 86.9% |
| 9/20 | Sun | 90.4% | 82.6% | 94.0% |
| 9/21 | Mon · Respect for the Aged Day | 88.3% | 80.1% | 93.7% |
| 9/22 | Tue · Citizens’ Holiday | 84.9% | 73.1% | 75.6% |
| 9/23 | Wed · Autumnal Equinox | 77.1% | 62.6% | 56.8% |
Source: Compiled by the HotelBank Editorial Team from MetroEngines Research
45 Days Out, 30 Days Out, Latest — How Pickup Lands Across Three Checkpoints
Next we align all three checkpoints. The four Saturdays of August 15, 22 and 29 and September 5 each carry observations at 45 and 30 days out, and their latest observation (August 11, 2026) falls between 4 and 25 days to arrival. The 12 cases — four dates × three segments — are listed below. Because the number of properties observed shifts by date even at the same days-to-arrival, the count at each checkpoint is shown alongside. The idea of building an operating framework from three checkpoints alone is itself tested in Okayama Booking Curves: 3 Checkpoints, Aug 8 Late-Surges +11.8pt.
| Stay date | Segment | 45 days out | 30 days out | Latest obs. (days to arrival) | 45→30 days out | 30 days out→latest | 45 days out→latest |
|---|---|---|---|---|---|---|---|
| Aug 15 (Sat) | City | 82.3% (24) | 85.9% (24) | T-4 / 88.7% (27) | +3.6 pt | +2.8 pt | +6.4 pt |
| Aug 15 (Sat) | Business | 73.9% (153) | 77.1% (156) | T-4 / 84.6% (166) | +3.2 pt | +7.5 pt | +10.7 pt |
| Aug 15 (Sat) | Ryokan | 74.1% (50) | 75.2% (55) | T-4 / 83.0% (59) | +1.1 pt | +7.8 pt | +8.9 pt |
| Aug 22 (Sat) | City | 87.2% (21) | 91.0% (22) | T-11 / 92.3% (27) | +3.8 pt | +1.3 pt | +5.1 pt |
| Aug 22 (Sat) | Business | 84.4% (148) | 86.2% (150) | T-11 / 88.4% (166) | +1.8 pt | +2.2 pt | +4.0 pt |
| Aug 22 (Sat) | Ryokan | 72.9% (55) | 78.8% (57) | T-11 / 82.9% (60) | +5.9 pt | +4.1 pt | +10.0 pt |
| Aug 29 (Sat) | City | 84.3% (25) | 87.0% (27) | T-18 / 89.0% (27) | +2.7 pt | +2.0 pt | +4.7 pt |
| Aug 29 (Sat) | Business | 73.3% (157) | 79.0% (158) | T-18 / 83.5% (164) | +5.7 pt | +4.5 pt | +10.2 pt |
| Aug 29 (Sat) | Ryokan | 63.4% (55) | 66.9% (53) | T-18 / 73.0% (60) | +3.5 pt | +6.1 pt | +9.6 pt |
| Sep 5 (Sat) | City | 82.2% (25) | 85.7% (27) | T-25 / 86.7% (27) | +3.5 pt | +1.0 pt | +4.5 pt |
| Sep 5 (Sat) | Business | 70.3% (150) | 75.1% (159) | T-25 / 76.6% (163) | +4.8 pt | +1.5 pt | +6.3 pt |
| Sep 5 (Sat) | Ryokan | 61.4% (53) | 64.2% (60) | T-25 / 66.5% (60) | +2.8 pt | +2.3 pt | +5.1 pt |
Source: Compiled by the HotelBank Editorial Team from MetroEngines Research
Across the 12 cases the number of properties observed falls within 21–27 for city hotels, 148–166 for business hotels and 50–60 for ryokan. Because that count moves even at the same days-to-arrival, it is safer to read the slope together with the observations either side than to pull out a single cross-section and call it a peak or a trough.
What stands out in Table 2 is that the level at 45 days out and the pickup from 45 days out to the latest observation do not move together. City hotels on Saturday, August 22 sat at the highest level of all, 87.2% at 45 days out, yet added only +5.1pt by the latest observation (11 days to arrival). Ryokan on the same date started 14.3pt lower at 72.9%, added +5.9pt by 30 days out and a further +4.1pt to the latest observation, reaching 82.9% on a total of +10.0pt. Ryokan on Saturday, August 15 likewise went nowhere from 45 to 30 days out (+1.1pt) but added +7.8pt from 30 days out to 4 days to arrival.
Source: Compiled by the HotelBank Editorial Team from MetroEngines Research
The Average Curve for Six Completed Saturdays — Ryokan Add +10.9pt in the Final 14 Days
Three checkpoints are cross-sections; they do not show what happens between them. So for the six Saturdays whose stay dates have already passed — July 4, 11, 18 and 25 and August 1 and 8, 2026 — we plotted the average curve from 45 days to arrival through the day before, by segment (each days-to-arrival point aggregates 5–6 dates; cross-sections with too few properties observed are excluded).
All three segments converge in the 90s at the finish — 93.3% for city hotels, 92.5% for business hotels, 90.2% for ryokan — but the paths there are entirely different. The starting points are 84.0%, 73.5% and 68.3% respectively. Pickup from 45 days out to the day before comes to +9.3pt for city hotels, +19.0pt for business hotels and +21.9pt for ryokan; ryokan accumulate 2.4 times what city hotels do inside the final 45 days.
Source: Compiled by the HotelBank Editorial Team from MetroEngines Research
| Segment | 45 days out | 30 days out | 14 days out | Day before | 45→30 days out | 30→14 days out | 14 days out→day before | 45 days out→day before | Share from final 14 days |
|---|---|---|---|---|---|---|---|---|---|
| City hotels | 84.0% | 86.5% | 89.3% | 93.3% | +2.5 pt | +2.8 pt | +4.0 pt | +9.3 pt | 43% |
| Business hotels | 73.5% | 78.3% | 84.9% | 92.5% | +4.8 pt | +6.6 pt | +7.6 pt | +19.0 pt | 40% |
| Ryokan | 68.3% | 73.2% | 79.3% | 90.2% | +4.9 pt | +6.1 pt | +10.9 pt | +21.9 pt | 50% |
Source: Compiled by the HotelBank Editorial Team from MetroEngines Research
Breaking the curve into intervals sharpens the contrast. Ryokan add +4.9pt from 45 to 30 days out, +6.1pt from 30 to 14 days out and +10.9pt from 14 days out to the day before — 50% of their total pickup lands in the final two weeks. Business hotels added +7.6pt over the same interval (40% of their total) and city hotels +4.0pt (43% of theirs). In absolute terms, ryokan move 2.7 times as much as city hotels in the final two weeks.
Put differently, city hotels have most of their final shape visible at 45 days out, while for ryokan the 45-days-out figure says little about where they land. Reading ryokan’s 61.4% at 45 days out for Saturday, September 5 in Table 2 as “weak” is premature given this shape. Conversely, when city hotels sit below expectations at 45 days out, the room to recover afterwards is structurally small. Whether that relationship — the higher a segment sits at 45 days out, the less headroom it has close in — holds in other prefectures is tested within the same framework in Tochigi Booking Curves by Type: Resort 81.1% at T-45, Only +2.6pt Left.
Mapping the Latest Observation to a Day-Before Level — Sensitivity of the Remaining Pickup
Everything above — the three checkpoints and the average curve — is observed fact. To use it in decisions for your own property, it has to be recast as “how much more will land on top of today’s level.” So for the Saturday, September 5 arrival, which has not yet occurred, we take the latest observation (as of August 11, 2026, 25 days to arrival) as the starting point and apply the portion of the interval pickup shown by the six-Saturday average in Table 3 that has not yet been consumed. The arithmetic is only addition and subtraction of measured values from Tables 2 and 3; no new observations and no forecasting model are used.
| Segment | Latest obs. (25 days out) | Six-Saturday avg. 45 days out→day before pickup | Of which consumed 45 days out→latest | Remaining pickup | Mapped day-before level |
|---|---|---|---|---|---|
| City hotels | 86.7% | +9.3 pt | +4.5 pt | +4.8 pt | 91.5% |
| Business hotels | 76.6% | +19.0 pt | +6.3 pt | +12.7 pt | 89.3% |
| Ryokan | 66.5% | +21.9 pt | +5.1 pt | +16.8 pt | 83.3% |
Source: Compiled by the HotelBank Editorial Team from MetroEngines Research
The remaining pickup comes to +4.8pt for city hotels, +12.7pt for business hotels and +16.8pt for ryokan. Even though the latest observation leaves a 20.2pt gap between city hotels at 86.7% and ryokan at 66.5%, the mapped levels of 91.5% and 83.3% narrow that to 8.2pt. Ryokan on the September 5 arrival read as “weak” only when the remaining interval is left uncounted.
That said, no segment traces the same shape every time. So we lay out the range that results if the remaining interval follows each of the three segment shapes. The pessimistic, mid and optimistic cases all use measured pickup widths derived from Tables 2 and 3 (+4.8pt / +12.7pt / +16.8pt); none is an arbitrary assumption.
| Segment | Start (25 days out) | Pessimistic: city shape +4.8 pt | Mid: business shape +12.7 pt | Optimistic: ryokan shape +16.8 pt |
|---|---|---|---|---|
| City hotels | 86.7% | 91.5% | 99.4% | Over 100% |
| Business hotels | 76.6% | 81.4% | 89.3% | 93.4% |
| Ryokan | 66.5% | 71.3% | 79.2% | 83.3% |
Source: Compiled by the HotelBank Editorial Team from MetroEngines Research
Ryokan swing across a 12.0pt band, from 71.3% to 83.3%. That band is precisely the value of holding the final two weeks open. City hotels, by contrast, can expect to land in the low 90s or above in every case, so their decisions can be closed out at the 45- and 30-days-out cross-sections.
Because your own level will not match the market average, a quick-reference grid varying both the starting point and the pickup is set out below. Rows are the estimated OCC at the latest observation and columns the remaining pickup; both stay inside the ranges observed in this article (levels 51.6–94.0%, pickup +4.8 to +16.8pt). Each cell is simply row plus column.
| Estimated OCC at latest observation | +4.8 pt | +7.8 pt | +10.8 pt | +13.8 pt | +16.8 pt |
|---|---|---|---|---|---|
| 60% | 64.8% | 67.8% | 70.8% | 73.8% | 76.8% |
| 65% | 69.8% | 72.8% | 75.8% | 78.8% | 81.8% |
| 70% | 74.8% | 77.8% | 80.8% | 83.8% | 86.8% |
| 75% | 79.8% | 82.8% | 85.8% | 88.8% | 91.8% |
| 80% | 84.8% | 87.8% | 90.8% | 93.8% | 96.8% |
| 85% | 89.8% | 92.8% | 95.8% | 98.8% | Over 100% |
| 90% | 94.8% | 97.8% | Over 100% | Over 100% | Over 100% |
Source: Compiled by the HotelBank Editorial Team from MetroEngines Research
Note: Tables 5–7 are mappings derived solely by adding and subtracting measured values from Tables 2 and 3; they do not forecast future occupancy. Actual outcomes shift with how remaining rooms are released, with events, and with competitors’ inventory adjustments. As set out in the definitions at the end of the article, estimated OCC is based on OTA-listed inventory and reads higher than actual room occupancy.
For Revenue Managers Running City Hotels, Business Hotels and Ryokan in Hiroshima — Implications and Action Plan
1. Reinterpret “low at 45 days out = weak” segment by segment. Pickup on the average curve is +9.3pt for city hotels, +19.0pt for business hotels and +21.9pt for ryokan. At the same estimated OCC 45 days out, the headroom still ahead differs by more than a factor of two. When comparing your own curve with the market, you will misjudge less often by asking whether your slope from 45 days out to the latest observation matches the pace of the market’s interval pickup, rather than by comparing the level itself.
2. Ryokan should design inventory to leave the final two weeks open. On the six-Saturday average, the final 14 days contribute +10.9pt, or 50% of total pickup. Under that shape, discounting at 45 or 30 days out to clear inventory early means entering the busiest two weeks locked into a low setting. Even when the market at 30 days out sits at the level in Table 2 (64.2% for the September 5 arrival), that is the market’s normal shape and is not on its own a reason to cut early.
3. City hotels close out early. On the average curve they reach 84.0% at 45 days out and 86.5% at 30 days out, leaving only 9.3pt to the day-before level of 93.3% already at 45 days out. With a short recovery window, if your property sits away from the market level at the 45-days-out cross-section, that point is the effective final adjustment. City hotels adding only +5.1pt from 45 days out to the latest observation on Saturday, August 22 is worth keeping in view as a concrete example of this structure.
4. Treat the September 19–23 holiday run day by day. At 45 days out ryokan reached 94.0% on 9/20 and 93.7% on 9/21, above city hotels (90.4% and 88.3%), while the final day of 9/23 falls to 56.8%. Rather than one setting for the whole run, there is room for separate decisions on the opening, the middle and the final day.
| Time horizon | Action | Decision trigger | Objective |
|---|---|---|---|
| Today–this week | Break the five-day run (9/19–23) into individual days and assess where you stand | If your settings do not reflect the shape in which the market on the final day, 9/23, sits at 56.8% for ryokan and 62.6% for business hotels at 45 days out, well below the opening (9/20: 94.0% and 82.6%) | Avoid leaving the final day behind through a single block setting |
| Today–this week | Compare your own 45-days-out cross-section with the segment average | If your 45-days-out reading sits away from the market average (city 81.8% / business 68.7% / ryokan 64.9%) | Separate a difference in level from a difference in pace |
| Within two weeks | Ryokan: switch to an inventory design that holds the final two weeks open | If you are weighing an early price cut while sitting level with the market at 30 days out | Avoid entering the interval that carries 50% of total pickup at a low rate |
| Within two weeks | City hotels: run the 45-days-out cross-section as the final adjustment point | If pickup from 45 days out to the latest observation is expected to stay around +5pt (+5.1pt on the August 22 arrival) | Act early on the premise that the recovery window is short |
| Looking to next month | Fix the segment interval pickup (Table 3) into your own calendar | If your average pickup diverges substantially from the market’s interval distribution | Align the timing of rate changes itself with the segment shape |
| Looking to next month | Classify demand by position within a holiday run rather than by day of week | If settings are built on the “Saturday” label alone | Avoid missing high-demand weekdays such as Tuesday 9/22 at 75.6% |
Source: Compiled by the HotelBank Editorial Team from MetroEngines Research
Summary — Three Yardsticks
Lining up Hiroshima’s three segments at 45 days out, 30 days out and the latest observation leaves three reusable yardsticks.
1. Compare slopes, not levels. Estimated OCC at 45 days out averages 81.8% for city hotels, 68.7% for business hotels and 64.9% for ryokan — a 16.9pt spread — yet day-before levels converge to within just over 3pt, at 93.3%, 92.5% and 90.2%. Comparing absolute levels at 45 days out across segments means little; what to compare is your own slope against the same segment.
2. The segment decides when to firm up. The final two weeks account for 43% of total pickup at city hotels, 40% at business hotels and 50% at ryokan — +4.0pt, +7.6pt and +10.9pt in absolute terms. The effective cut-off comes earliest for city hotels and latest for ryokan.
3. Split calendar blocks into individual days. Across the five-day September 19–23 run, ryokan move 37.2pt at 45 days out, from 94.0% (9/20) to 56.8% (9/23). Demand is set by which day of the run it is, not by the run taken as a unit.
About the Data
• Definition of estimated OCC: OTA-listed inventory occupancy = 100 − 100 × rooms still listed on OTAs ÷ total rooms. It is an estimate based on how listed inventory is being sold down and is defined differently from actual room occupancy (it reads higher). This article refers to it as “estimated OCC (OTA-listed inventory basis).”
• Booking curve: Inventory is observed from 90 days before the stay date, but this article aggregates the interval from 45 days out to the latest observation. Coverage is arrivals from August 13 to September 25, 2026 (45-days-out cross-section: 43 of the 44 dates, excluding the August 16 arrival with too few properties observed), plus the six Saturdays already passed — July 4, 11, 18 and 25 and August 1 and 8, 2026 (45 days out through the day before).
• Sample (N): Hiroshima city hotels N=27 properties (4,655 rooms), business hotels N=163–167 properties (18,574–19,012 rooms), ryokan N=60–61 properties (1,382–1,409 rooms). The number actually observed varies by date even at the same days-to-arrival: at the 45-days-out cross-section it ranged 21–27 for city hotels, 146–164 for business hotels and 46–61 for ryokan. Across the 12 cases in Table 2 it was 21–27, 148–166 and 50–60 respectively. The count observed at each checkpoint is shown within the tables.
• Public holidays: September 21 (Respect for the Aged Day), September 22 (Citizens’ Holiday) and September 23 (Autumnal Equinox) 2026 were confirmed against the holiday data published by the Cabinet Office of Japan under “National Holidays” (syukujitsu.csv).
• Price metrics: This article is built on the occupancy axis alone and does not cover price metrics.
• Data as of August 12, 2026 (latest observation date: August 11, 2026). Sales and inventory change daily, so the figures here are a snapshot at the time of retrieval.
References and Sources
■ Data sources
Daily observation of OTA-listed inventory in Hiroshima Prefecture (compiled by MetroEngines Research). Segments are city hotels, business hotels and ryokan; coverage is the 45-days-out cross-section for arrivals from August 13 to September 25, 2026 (43 dates) and the six Saturdays already passed between July 4 and August 8, 2026. Public holidays were identified from data published by the Cabinet Office of Japan under “National Holidays.” Data as of August 12, 2026 (latest observation date August 11, 2026).
■ Calculation assumptions
Estimated OCC = 100 − 100 × rooms still listed on OTAs ÷ total rooms. The average curve averages each days-to-arrival cross-section across the target dates, excluding cross-sections with extremely few properties observed (45 days out for the August 16 arrival; 30 days out for the August 1 arrival). The levels in Tables 5–7 add, to the latest observation in Table 2, the unconsumed portion of the interval pickup shown by the six-Saturday average in Table 3 (total pickup from 45 days out to the day before, minus actual pickup from 45 days out to the latest observation); no forecasting model is used.
■ Limitations and caveats
Because estimated OCC is based on how OTA-listed inventory is sold down, it reads higher than actual room occupancy. The number of properties observed fluctuates by date even at the same days-to-arrival, so a single cross-section should be judged by slope rather than read as a peak or a trough. The six-Saturday average rests on a small sample of 5–6 dates per point, and the interval pickup widths may not repeat on future stay dates. This article is built on the occupancy axis alone and does not address implications for price or revenue.
• Cabinet Office of Japan, “National Holidays” holiday data (syukujitsu.csv): https://www8.cao.go.jp/chosei/shukujitsu/syukujitsu.csv
Related Reading
- Tochigi Booking Curves by Type: Resort 81.1% at T-45, Only +2.6pt Left
- Kagoshima Summer Booking Curves: 23.2pt Gap by Type at 45 Days Out
- Hyogo Booking Curves: 3.6x Pickup Gap, Ryokan Sellout Rate 28.4%
- Okayama Booking Curves: 3 Checkpoints, Aug 8 Late-Surges +11.8pt
- Hokkaido City Hotels: Only Aug 15 Trails at 78.7% OCC, 45 Days Out
- Kyoto Obon 2026 Booking Curves: Ryokan Add the Most Close In, +11.4pt
- Yamanashi Obon: Ryokan Gain Only +1.1pt, Business Hotels +7.9pt