

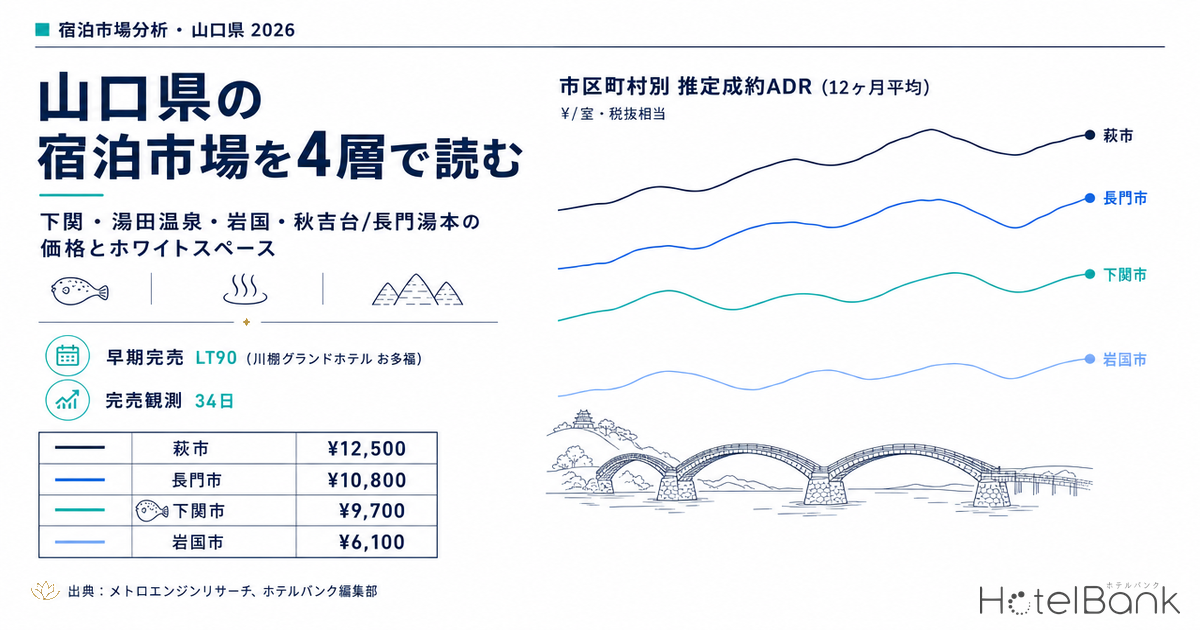
Yamaguchi Prefecture’s accommodation market is too varied in character to be lumped together as a single “regional market.” There is Shimonoseki, drawing domestic and international visitors with the Kanmon Strait and fuku (pufferfish); Yuda Onsen, where Yamaguchi City’s business demand coexists with hot springs; Iwakuni, where the Kintaikyo Bridge, Iwakuni Kintaikyo Airport, and base-related demand intersect; and Akiyoshidai and Nagato Yumoto, honed as tourism resorts. Drawing on MetroEngines Research’s OTA published-rate data and property-level remaining-inventory trends, this article reads the price level, supply mix, and strength of demand for each of these four tiers, to the extent observable.
Metric Definitions Used in This Article
- ADR (average daily rate): An estimated settled rate (tax-exclusive equivalent) calculated by applying category-specific adjustment coefficients to the lowest published plan level each property lists on OTAs (double occupancy, per-room rate, tax-inclusive). Cross-checked against property-level actuals disclosed by listed hotel REITs (91 properties, most recent 3 months), the median error is approximately 7%. These are estimates and differ from each property’s actual transacted rates and accounting figures. Area-level ADR is the median across the target properties (the level of a typical property in that area).
- Published price (average of all plans, tax-inclusive): The average selling price across all plans published on OTAs (room-only through meal-inclusive). This is a separate metric from estimated settled ADR and generally runs higher than the settled level. The price-band map (positioning) is built on this published-price basis.
- Early sell-out LT / LT (lead time): LT = number of days until the check-in date (LT0 = same day). Early sell-out LT = the lead time at which remaining rooms first reached zero (the larger the value, the earlier the sell-out).
- Data scope: Aggregated across properties tracked by MetroEngines Research whose operation can be confirmed on OTAs. Minshuku and simple lodging facilities not listed on OTAs are excluded.
- Data source: Compiled by MetroEngines Research and the HotelBank Editorial Team
- — Yamaguchi’s accommodation market has a four-tier structure: Shimonoseki, Yuda Onsen, Iwakuni, and Akiyoshidai/Nagato Yumoto. Median estimated settled ADR ranges from ¥12,500 in Hagi to ¥6,100 in Iwakuni — roughly a two-fold spread between tiers.
- — Supply is centered on the budget and economy bands (N=186 properties). Shimonoseki has depth in the upper-midscale band with 11 properties, while in Iwakuni 11 of the 17 tracked properties cluster in the budget band.
- — The white space in the upper price bands lies in Iwakuni and Akiyoshidai. Relative to tourism assets such as the Kintaikyo Bridge, Iwakuni Kintaikyo Airport, and the karst plateau, mid- to upper-class supply is thinnest here.
- — In the remaining-inventory analysis for the Obon peak (August 13; N=88 properties), Shimonoseki’s onsen ryokan monopolize the top of the early sell-out ranking — confirming the area is the prefecture’s strongest on demand as well as on price.
- — In the case study, Kawatana Grand Hotel Otafuku (51 rooms) sold out once at LT90, then re-released 37 rooms at LT55. How inventory re-release is designed shapes the revenue opportunity in both rate and occupancy.
Yamaguchi’s Price Hierarchy Across Four Tiers — Onsen Areas on Top, Business Areas Below
Lining up estimated settled ADR (hereafter ADR) by municipality makes clear that Yamaguchi’s accommodation market has a distinct hierarchy. Areas with a strong onsen and tourism character sit at the top, while areas driven mainly by business demand sit at the bottom.
Averaging the monthly median ADR over the most recent 12 months (July 2025 to June 2026), Hagi City is highest at approximately ¥12,500, followed by Nagato City (Nagato Yumoto) at approximately ¥10,800 and Shimonoseki City at approximately ¥9,700. By contrast, Yamaguchi City (Yuda Onsen) comes in at approximately ¥8,300, Mine City — home to Akiyoshidai — at approximately ¥6,900, and Iwakuni City at approximately ¥6,100, the lowest among the major areas. The greater the weight of onsen ryokan and meal-inclusive plans, the higher room rates run; the greater the weight of business use, the more subdued they are. This structure, common to regional metropolitan areas, appears cleanly within the prefecture as well.
Source: Compiled by MetroEngines Research and the HotelBank Editorial Team
Seasonality also brings out the individual character of each tier. Nagato City, an onsen destination, spikes sharply over the New Year period (approximately ¥14,200 in January 2026) and during the autumn foliage season, with the tourism peaks and troughs driving ADR. Yamaguchi City, by contrast, holds steady in the ¥7,000–¥8,000 range throughout the year, showing that business demand underpins price. Iwakuni City moves within a narrow ¥5,800–¥6,700 band — a stable, weekday-business-centered market, or put another way, one whose room to build up rate remains untouched.
| Area (tier) | Estimated settled ADR 12-month average |
Latest month (2026-06) |
Published price average (tax-incl.) |
Properties tracked |
|---|---|---|---|---|
| Hagi City (tourism) | ¥12,500 | ¥10,100 | ¥27,900 | 31 |
| Nagato City (Nagato Yumoto, tourism resort) | ¥10,800 | ¥8,800 | ¥30,900 | 34 |
| Shimonoseki City (Kanmon, fuku, inbound) | ¥9,700 | ¥7,500 | ¥25,100 | 61 |
| Yamaguchi City (Yuda Onsen, business + onsen) | ¥8,300 | ¥7,300 | ¥17,200 | 35 |
| Mine City (Akiyoshidai, tourism)* | ¥6,900 | ¥6,300 | ¥32,800 | 9 |
| Iwakuni City (Kintaikyo, airport, base demand) | ¥6,100 | ¥5,800 | ¥14,600 | 16 |
* Mine City has only around three properties in scope for estimated settled ADR and is shown for reference. Source: Compiled by MetroEngines Research and the HotelBank Editorial Team
Supply Mix and White Space — The “Upper Range” Left Open in Iwakuni and Akiyoshidai
Next, we sort each area’s properties into five price bands by published price (average of all plans, tax-inclusive) to see where supply is concentrated. What emerges is that Yamaguchi as a whole is built on a “budget/economy core plus a handful of onsen ryokan,” and that the depth of the middle — the upper-midscale band — varies widely by area.
Price-band classification based on published price (average of all plans, tax-inclusive). Source: Compiled by MetroEngines Research and the HotelBank Editorial Team (N=186 properties)
First, Shimonoseki City has the deepest and best-balanced supply of the group. Of 59 tracked properties, 11 sit in the upper-midscale band (¥50,000–¥100,000) and 21 in the midscale band (¥25,000–¥50,000) — a solid layer of mid- to upper-tier accommodations built around Kanmon Strait views and fuku kaiseki. This is an area where the fuku and Kanmon brands have already converted upper-range demand into actual supply.
Nagato City and Hagi City likewise have depth in the midscale band (14 and 12 properties respectively), thanks to onsen ryokan and castle-town ryokan. Luxury-band properties are also observed in Nagato Yumoto, suggesting that the upper price bands grew alongside the regeneration of the onsen town. Since 2016, Nagato City, the local community, and operators have worked together on regenerating the Nagato Yumoto onsen district, which was reborn in spring 2020 as a new onsen town built around the concept of “Osoto Tengoku” (outdoor paradise). Hoshino Resorts’ KAI Nagato (opened March 2020) is a symbolic example and one of the pillars of the upper price band.
By contrast, the upper range remains untouched in Iwakuni City and Akiyoshidai (Mine City). In Iwakuni City, 11 of 17 tracked properties cluster in the budget band (under ¥15,000), with just 1 property in the upper-midscale band and only 3 in the midscale band. Despite the Kintaikyo Bridge — a nationally recognized tourism asset — access from the Tokyo metropolitan area and Okinawa via Iwakuni Kintaikyo Airport, and steady base-related and business demand, the mid- to upper-class accommodation supply to absorb it is still thin. There is clear white space here to lift room rates a level. The Akiyoshidai area (Mine City) is also small in overall volume at 11 tracked properties, leaving substantial room for stay-oriented, upper-band supply relative to the tourism potential of one of Japan’s largest karst plateaus.
Where the white space lies (read constructively): Shimonoseki, Nagato, and Hagi are the “leading areas” that have converted upper-band demand into supply in the form of fuku kaiseki and onsen ryokan. Iwakuni and Akiyoshidai, meanwhile, have thin mid- to upper-class supply relative to their tourism and access assets — making them the “later-stage opportunity areas” with the greatest headroom to lift price bands.
Remaining Inventory Tells the Demand Story — Properties That Sell Out Early at the Obon Peak
Following price and supply, we turn to the actual strength of demand as seen in property-level remaining-inventory trends (room basis). Here we take the 2026 Obon peak (check-in August 13) and rank properties by how early their remaining rooms reached zero, limiting the set to properties publishing at least 30% of total rooms on OTAs. Of the 800 properties tracked within the prefecture, remaining-inventory data for this date was available for 182, of which 88 met the 30%-or-more published-allotment condition.
| Property (area) | Total rooms | Early sell-out LT | Days observed sold out | Current remaining-room rate |
|---|---|---|---|---|
| Kawatana Grand Hotel Otafuku (Shimonoseki City, Kawatana Onsen) | 51 rooms | LT90 | 34 days | 35.3% |
| Hagi Ichirin (Hagi City) | 30 rooms | LT90 | 2 days | 23.3% |
| Sun Green Kikugawa (Shimonoseki City) | 19 rooms | LT89 | 50 days | 0.0% |
| Ichinomata Onsen Grand Hotel (Shimonoseki City) | 30 rooms | LT87 | 32 days | 30.0% |
| Kaicho no Yado Aiosou (Yamaguchi City) | 15 rooms | LT67 | 40 days | 0.0% |
| KKR Yamaguchi Asakura (Yamaguchi City) | 24 rooms | LT55 | 1 day | 12.5% |
Only properties publishing at least 30% of total rooms on OTAs are included (N=88 properties, drawn from a tracked population of 800 properties). Check-in August 13, 2026; survey date July 21, 2026. Source: Compiled by MetroEngines Research and the HotelBank Editorial Team
The top of the ranking is dominated by onsen ryokan in Shimonoseki City (including Kawatana Onsen and Ichinomata Onsen). The movement of remaining inventory confirms that Shimonoseki — the home of Kanmon and fuku — is the prefecture’s strongest area on demand as well as on price. Properties in Hagi City and Yamaguchi City were also observed selling out at the early stage of LT55 to LT90, showing that Obon tourism demand reaches all four tiers. Note that these are properties named as popular with strong demand, with a track record of filling their allotments early.
Case Study: Kawatana Grand Hotel Otafuku — Early Sell-Out and the “Re-Release of Inventory”
Tracing the remaining-inventory trend of Kawatana Grand Hotel Otafuku (Kawatana Onsen, Shimonoseki City; 51 rooms), which tops the ranking, reveals a pattern in the Obon selling season that is both typical of regional onsen ryokan and instructive. For the August 13 check-in, remaining rooms stayed at zero from LT90 (as of May 15) through LT56 — meaning the allotment listed on OTAs had already sold out at a very early point in the observation window.
Remaining-inventory trend (room basis) for Kawatana Grand Hotel Otafuku (51 rooms), check-in August 13, 2026. Source: Compiled by MetroEngines Research and the HotelBank Editorial Team
The turning point comes around LT55. Remaining rooms, which had been at zero, jumped back to 37 (72.5% of total rooms) at once. Rather than an accumulation of last-minute cancellations, this is most naturally read as the property releasing a block of additional Obon inventory to OTAs. After the release, take-up proceeded steadily — 37 rooms, then 34, then 31 — reaching 27 rooms at LT30 (July 14) and 18 rooms remaining (a 35.3% remaining-room rate) at LT23, the survey date. Days observed sold out totaled 34.
This movement shows that in areas with strong demand, the revenue opportunity hinges on how a property designs its subsequent additional releases after the OTA allotment closes early. Where the drawing power to fill inventory early is already proven, combining it with a staged release of peak-date inventory creates room for further revenue upside in both rate and occupancy. From the traveler’s perspective, “don’t give up when it shows as full — check again around LT55 and again around LT30” is a practical strategy for securing a Shimonoseki onsen stay over Obon.
The Headroom in Each of the Four Tiers
Shimonoseki (Kanmon, fuku, inbound): The most mature area in the prefecture on both price and demand. It holds clear assets in Kanmon Strait views and fuku kaiseki, with deep supply in the upper price bands as well. Growing inbound visitation around the Karato Market area could become an upside factor pushing rates higher still.
Yuda Onsen (Yamaguchi City, business + onsen): Steady year-round business demand underpins price, while there is headroom to lift weekend and leisure rates by leveraging the area’s appeal as an onsen destination. How the dual crop of weekday business and weekend onsen is translated into rate will define the direction of growth.
Iwakuni (Kintaikyo, airport, base demand): Despite favorable conditions — the Kintaikyo Bridge, Iwakuni Kintaikyo Airport, and steady demand — this is the area with the thinnest mid- to upper-class supply. The white space is the clearest in the prefecture, leaving substantial room for accommodation products that raise the quality of the stay.
Akiyoshidai and Nagato Yumoto (tourism resorts): Nagato Yumoto is a leading example of growing the upper price bands through onsen-town regeneration. Akiyoshidai still has a small property base relative to the tourism asset of one of Japan’s largest karst plateaus, leaving development potential as a tourism resort.
Conclusion
Yamaguchi’s accommodation market comes into sharp focus when read as a four-tier structure: Shimonoseki and its fuku at the top, the onsen areas of Nagato and Hagi, the business-plus-onsen mix of Yuda, and the high-headroom areas of Iwakuni and Akiyoshidai. In the price hierarchy, onsen and tourism areas sit at the top; in the supply mix, onsen ryokan form the upper price bands atop a budget-centered base. Shimonoseki’s onsen ryokan lead on the strength of demand, with early sell-outs and inventory re-releases repeating through the Obon peak. The upper-band white space open in Iwakuni and Akiyoshidai is a clear opportunity as the prefecture works to grow rates from here. All of these represent constructive room for growth, as indicated by the OTA data observable to us.
⚠ Note on ADR and remaining inventory for future dates: The remaining-inventory trends for Obon (August 13) and the prefecture-wide future-month ADR figures in this article are estimates based on inventory and selling prices published on OTAs as of the survey date, and will shift with additional releases and price adjustments as the check-in date approaches. Please treat them as observations at the current point in time.
References and Sources
- MetroEngines Research — OTA published-rate data (estimated settled ADR, published price) and property-level remaining-inventory trends (room basis). Aggregated across properties whose operation can be confirmed within Yamaguchi Prefecture.
- The history of Nagato Yumoto Onsen and KAI Nagato (Hoshino Resorts) — background on the Nagato Yumoto onsen town regeneration project (2016–2020)
- Nagato Yumoto Onsen official tourism site
- Fuku Fuku Paku Paku (Shimonoseki, the home of fugu) — fuku food culture and tourism information for Shimonoseki
- Japan Tourism Agency, “Overnight Travel Statistics Survey” (e-Stat, statistics ID: 0003313520) — reference for overnight guest counts by prefecture
■ Data sources
MetroEngines Research OTA published-rate data (estimated settled ADR, published price) and property-level remaining-inventory trends (room basis). Aggregated across properties whose OTA operation can be confirmed within Yamaguchi Prefecture; minshuku and simple lodging facilities not listed on OTAs are excluded. The price-band map covers N=186 properties, and the Obon remaining-inventory ranking covers N=88 properties (drawn from a tracked population of 800 properties).
■ Calculation assumptions
Estimated settled ADR is an estimated settled rate (tax-exclusive equivalent) calculated by applying category-specific adjustment coefficients to each property’s lowest published OTA plan level (double occupancy, per room, tax-inclusive). Cross-checked against property-level actuals disclosed by listed hotel REITs (91 properties, most recent 3 months), the median error is approximately 7%. Area-level ADR is the median across the target properties. Published price is the average of all plans (tax-inclusive) and generally runs higher than the settled level.
■ Limitations and caveats
All figures are estimates and differ from each property’s actual transacted rates and accounting figures. Areas with only around three properties in scope for estimated settled ADR, such as Mine City, are reference values. ADR and remaining-inventory trends for future dates are estimates based on OTA inventory and selling prices as of the survey date (July 21, 2026) and will shift with additional releases and price adjustments as the check-in date approaches.