

Among resort hotels in Okinawa Prefecture, estimated OCC for Thursday, August 13, 2026 rose from 83.0% at 45 days out to 89.8% at the latest observation (July 30, 2026), a gain of +6.8pt over the period. Meanwhile, Saturday, August 22 — the first Saturday after Obon — moved from 81.4% at 45 days out to 85.9%, a gain of +4.5pt, and Saturday, September 5 went from 79.5% at 45 days out to just 81.7% (as of 37 days remaining). So far this looks like the familiar picture: Obon is strong, September is weak. Yet once the observation windows are aligned to the same width, the picture reverses. Over the identical eight-day span from 45 days out to 37 days out before the stay date, Okinawa city hotels gained the most on September 5, at +4.7pt — ahead of Obon’s August 15 (+3.3pt) and August 13 (+2.7pt). Resorts also gained +2.2pt on September 5, essentially on par with August 15’s +2.3pt. A low level and weak momentum are two different things.
Scope: Okinawa Prefecture resort hotels, N=241–245 properties (25,318–25,450 rooms); city hotels, N=14 properties (3,155 rooms). The price metric in this article is estimated settled ADR (the transaction price level estimated from OTA and other sales data, tax-exclusive equivalent); occupancy is an estimate based on OTA-listed inventory. Definitions for both appear at the end of the article. Data as of: August 1, 2026.
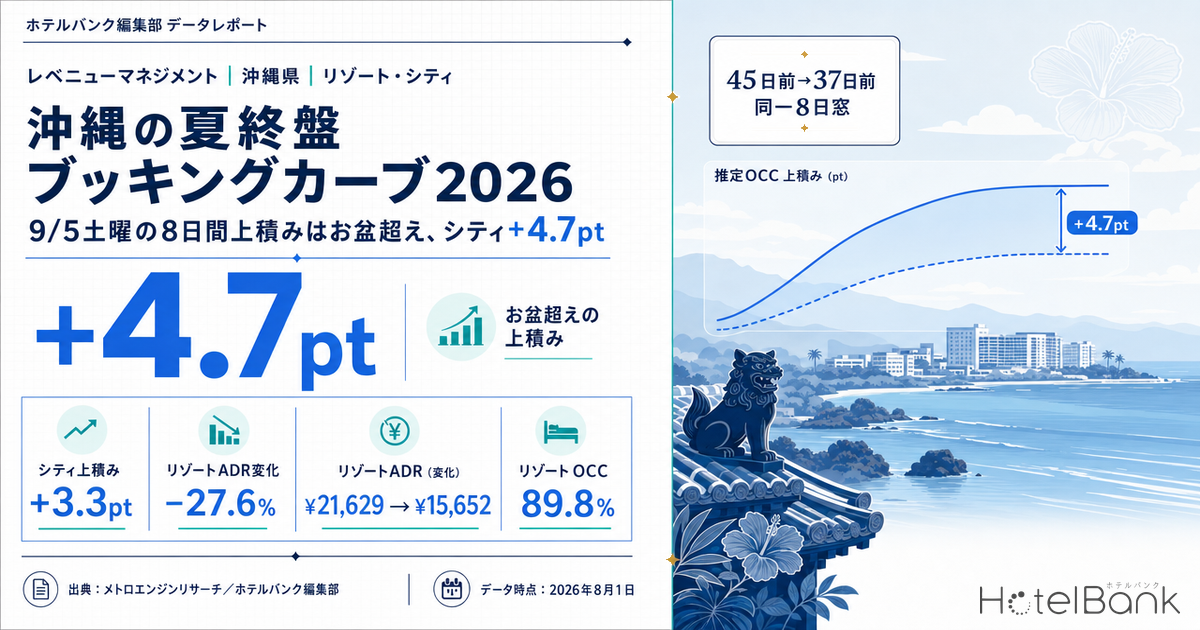
- — +4.7pt Saturday, September 5 posted the largest gain for Okinawa city hotels over the identical eight-day window from 45 to 37 days out — ahead of Obon’s August 15 (+3.3pt) and August 13 (+2.7pt).
- — Level and momentum can invert Saturday, August 22 sits high at the latest observation (resorts 85.9%, city 88.8%), yet its gain over the identical eight-day window is the smallest of the four stay dates (resorts +1.3pt, city +2.4pt).
- — −27.6% Estimated settled ADR for Okinawa resorts fell from ¥21,629 in August 2025 to ¥15,652 in September. September’s price trough is the seasonal shape of the market, not a shortfall specific to any one property.
- — Six straight months above the prior year Comparing finalized months only, January through June 2026 all exceeded the same month a year earlier — resorts +17.7% to +25.8%, city hotels +12.0% to +28.7%.
- — Day-of-week patterns differ by property type In July 2026 actuals, the day-of-week spread was 2.3pt for resorts (Sat 93.5% to Thu/Sun 91.2%) and 6.0pt for city hotels (Sat 97.7% to Mon 91.7%).
45 Days Out, 30 Days Out, and Latest — Okinawa’s Booking Curves Across Four Stay Dates
The chart below plots four stay dates for Okinawa resort hotels — Thursday, August 13; Saturday, August 15; Saturday, August 22; and Saturday, September 5, 2026 — along an axis of days remaining before each stay date (lead time). The horizontal axis starts at 45 days out on the left, with the stay date approaching toward the right. The latest observation date is July 30, 2026 in every case, which corresponds to 14 days remaining for August 13, 16 days for August 15, 23 days for August 22, and 37 days for September 5.
Source: Compiled by the HotelBank Editorial Team from MetroEngines Research data
The four lines separate cleanly. August 13 sits at the top, already at 83.0% at 45 days out — above every other date — and reaching 89.8% at the latest observation. August 15 started 3.3pt behind August 13 at 79.7% at 45 days out, but climbed more steeply to 87.0% at the latest observation, giving it the largest period gain of the four dates at +7.3pt. August 22, the first Saturday after Obon, started higher than August 15 at 81.4% but reached only 85.9% at the latest observation, a gain of +4.5pt. September 5 has only been observed through the 37-days-remaining cross-section, moving from 79.5% to 81.7%, a gain of +2.2pt.
One caution here: because the number of days remaining at the latest observation differs by stay date, comparing “period gain” side by side introduces an arithmetic bias in which stay dates simply observed for longer show larger gains. August 13 has accumulated 31 days of observations; September 5, only eight. The table below also shows the range of observed properties for each stay date.
| Stay date | Type | 45 days out | 30 days out | Latest obs. (2026/7/30) | Period gain | Observed properties |
|---|---|---|---|---|---|---|
| Aug 13 (Thu) | Resort | 83.0% | 86.9% | 89.8% 14 days left | +6.8pt | 192–242 |
| Aug 15 (Sat) | Resort | 79.7% | 83.8% | 87.0% 16 days left | +7.3pt | 215–242 |
| Aug 22 (Sat) | Resort | 81.4% | 84.4% | 85.9% 23 days left | +4.5pt | 216–242 |
| Sep 5 (Sat) | Resort | 79.5% | not reached | 81.7% 37 days left | +2.2pt | 203–240 |
| Aug 13 (Thu) | City | 77.4% | 81.7% | 86.2% 14 days left | +8.8pt | 13–14 |
| Aug 15 (Sat) | City | 79.7% | 85.3% | 90.0% 16 days left | +10.3pt | 13–14 |
| Aug 22 (Sat) | City | 82.3% | 86.7% | 88.8% 23 days left | +6.5pt | 13–14 |
| Sep 5 (Sat) | City | 82.1% | not reached | 86.8% 37 days left | +4.7pt | 14 |
Source: Compiled by the HotelBank Editorial Team from MetroEngines Research data
City hotels posted larger gains than resorts on all four stay dates. August 15 stands out in particular, climbing from 79.7% at 45 days out to 90.0% at the latest observation, a gain of +10.3pt that far exceeds the resorts’ +7.3pt. The sample is small at N=14 properties and 3,155 rooms, so a single property can move the numbers, but the observed-property count held steady at 13–14 across every fixed point, meaning no apparent swings were caused by turnover in the sample (the July 2, 2026 observation is missing across all series and has been excluded from the charts and aggregates). The pattern that emerges is urban inventory centered on Naha selling through later, and more steeply, than resort inventory. Cutting the same late-summer cross-section in a ryokan-dominated market produces a different pattern, which can be contrasted in Nagano Late-Summer Booking Curve 2026: Ryokan -11.8pt at 45 Days Out.
The estimated share of properties with no confirmable listed inventory also runs highest for August 13 among resorts, rising from 17.1% at 45 days out to 20.4% at 30 days out and 27.8% at the latest observation — the highest of the four dates. August 15 moved 13.1% → 14.8% → 16.0%, and August 22 moved 11.8% → 15.5% → 14.3%, showing that inventory tightness is concentrated on the middle day of Obon. For September 5, observation has only reached the 37-days-remaining cross-section, so we limit ourselves to describing the current state.
Align the Windows to Eight Days and September 5 Out-Gains Obon
To remove differences in observation length, the simplest fix is to cut a window of identical width for every stay date. Here we use the eight days from 45 days out to 37 days out, a span observed for all four dates. Within this window, the gap in observed days across stay dates disappears.
Source: Compiled by the HotelBank Editorial Team from MetroEngines Research data
The result is as stated at the outset. Among city hotels, September 5 is the largest at +4.7pt, ahead of August 15’s +3.3pt, August 13’s +2.7pt, and August 22’s +2.4pt. Among resorts, September 5’s +2.2pt is nearly identical to August 15’s +2.3pt and larger than August 13’s +1.7pt and August 22’s +1.3pt. In other words, early-September Saturdays may be dates that are “still at a low level,” but they are not dates that “aren’t moving.” Rushing to discount early on the basis of the 45-days-out level alone (resorts 79.5%, city 82.1%) risks taking on demand that has momentum at too low a rate.
August 22 also warrants a re-reading. As the first Saturday after Obon, it stands higher than September 5 in level terms at 85.9% for resorts and 88.8% for city hotels. Yet its gain over the identical eight-day window is the smallest of the four dates (resorts +1.3pt, city +2.4pt). The reading is that it only looks high because of the head start it banked, while the pace of additional pickup over this period is in fact sluggish. August 22 and September 5 form a pair in which level and momentum are inverted. On how a high level at 45 days out corresponds to subsequent room to grow, Tochigi Booking Curves by Type: Resort 81.1% at T-45, Only +2.6pt Left tests the same question by property type.
The Seasonal Shape of Estimated Settled ADR — How Big Is the August-to-September Drop?
On the price side, we use monthly estimated settled ADR. The chart below overlays 2025 and 2026 on the same January-to-December axis for Okinawa resort hotels (N=273–276 properties) and city hotels (N=11–14 properties). From July 2026 onward the figures are not finalized but are estimates based on current sales conditions, shown as dashed lines.
Source: Compiled by the HotelBank Editorial Team from MetroEngines Research data
The largest step in the seasonal shape for Okinawa resorts is the drop from August to September. Comparing finalized figures, estimated settled ADR was ¥21,629 in August 2025 (N=266) and ¥15,652 in September 2025 (N=267), a decline of 27.6% from August to September. City hotels went from ¥20,703 in August 2025 (N=11) to ¥16,824 in September 2025 (N=11), a decline of 18.7% — gentler than resorts. For 2026, estimates based on current sales conditions show the same directional step: resorts from ¥21,556 in August (N=275) to ¥16,374 in September (N=273), and city hotels from ¥18,766 in August (N=14) to ¥16,582 in September (N=14). These are not finalized figures, however, and require waiting for month-end confirmation.
Year-over-year comparisons between finalized months, on the other hand, are consistently positive for both property types. As the table below shows, Okinawa resorts exceeded the prior-year month for six consecutive months from January through June 2026, with gains ranging from +17.7% to +25.8%. City hotels ranged from +12.0% to +28.7%, with the most recent month, June 2026, at ¥18,178 (N=14) versus ¥16,229 (N=11) in June 2025, a gain of +12.0%. Note that the city hotel sample expanded in stages, from 11 properties in every month of 2025 to 12 properties in January–March 2026, 13 in April, and 14 in May–June, so the comparison incorporates a change in sample and should be read with that discount in mind. Within the prefecture, price tiers across the main island, Miyako, and Ishigaki form their own hierarchy, which we have broken down separately in our analysis of Okinawa’s July “only region past the rainy season” period.
| Month | Resort 2025 (final) | Resort 2026 (final) | YoY | City 2025 (final) | City 2026 (final) | YoY |
|---|---|---|---|---|---|---|
| January | ¥12,662 | ¥15,057 | +18.9% | ¥15,866 | ¥20,046 | +26.3% |
| February | ¥13,574 | ¥17,072 | +25.8% | ¥18,476 | ¥23,782 | +28.7% |
| March | ¥13,178 | ¥15,915 | +20.8% | ¥16,307 | ¥18,657 | +14.4% |
| April | ¥13,005 | ¥16,283 | +25.2% | ¥15,664 | ¥17,823 | +13.8% |
| May | ¥13,681 | ¥16,421 | +20.0% | ¥15,443 | ¥17,620 | +14.1% |
| June | ¥13,758 | ¥16,200 | +17.7% | ¥16,229 | ¥18,178 | +12.0% |
Source: Compiled by the HotelBank Editorial Team from MetroEngines Research data / Resorts N=258–267 properties in 2025 and 259–276 in 2026; city hotels N=11 properties in every month of 2025 and 12 in January–March 2026, 13 in April, 14 in May–June
What July 2026 Actuals Reveal About Day-of-Week Patterns — Flat for Resorts, Saturday-Heavy for City
Before turning to how August and September should be designed, it is worth looking at day-of-week performance in July 2026, the month just completed. We deal here only with estimated OCC (based on OTA-listed inventory); price is a monthly-canonical metric by nature, so day-of-week price differences are out of scope. The July 2026 monthly average was 91.7% for Okinawa resorts (31-day average, 229–245 observed properties) and 93.4% for Okinawa city hotels (13–14 observed properties).
| Day | Days | Resort est. OCC | City est. OCC |
|---|---|---|---|
| Mon | 4 | 91.4% | 91.7% |
| Tue | 4 | 91.8% | 92.2% |
| Wed | 5 | 91.3% | 92.2% |
| Thu | 5 | 91.2% | 92.4% |
| Fri | 5 | 91.8% | 94.0% |
| Sat | 4 | 93.5% | 97.7% |
| Sun | 4 | 91.2% | 93.6% |
Source: Compiled by the HotelBank Editorial Team from MetroEngines Research data / July 2026, Okinawa Prefecture. Resorts 229–245 observed properties; city hotels 13–14
For resorts, the gap between the highest day (Saturday, 93.5%) and the lowest (Sunday and Thursday, 91.2%) is only 2.3pt. In a market where stays span multiple nights and are governed by round-trip flight schedules, day-of-week peaks and troughs are less pronounced than in urban areas. City hotels, by contrast, show a 6.0pt spread between Saturday at 97.7% and Monday at 91.7% — a clearly Saturday-concentrated pattern. This day-of-week profile is consistent with the booking-curve pattern of city hotels filling later and more steeply. The fact that three of the four stay dates tracked here (Aug 15, Aug 22, Sep 5) are Saturdays needs to be read against this day-of-week structure.
For Revenue Managers Running Okinawa Resort and City Hotels — Implications and an Action Plan
Operator’s-eye insights
1. Keep “level” and “momentum” as two separate gauges. August 22 exceeds September 5 in level terms (resorts 85.9%, city 88.8% versus 81.7% and 86.8%), yet over the identical eight-day window from 45 to 37 days out, August 22 gained the least (resorts +1.3pt, city +2.4pt) and September 5 the most (+2.2pt, +4.7pt). On your own calendar, too, looking only at color-coded absolute levels makes it easy to misread a date losing momentum as “still high, so we’re fine.” Simply moving to a weekly view with two columns — level and the increment over a fixed recent period — sharpens the resolution of the decision.
2. Always benchmark against the market curve at the same number of days remaining. The latest observations in this article sit at 14, 16, 23, and 37 days remaining depending on the stay date. When comparing your own pace to the market, aligning on “booked share at N days remaining” rather than “booked share as of today” is essential; otherwise an arithmetic bias makes dates with longer observation windows look advantaged. Matching the three fixed points in the table — 45 days out, 30 days out, and the latest observation — against your own cross-sections at the same days remaining is the minimum viable setup.
3. Build the pricing calendar around the August-to-September step. Comparing finalized figures, estimated settled ADR for Okinawa resorts fell 27.6% from ¥21,629 in August 2025 to ¥15,652 in September 2025, and city hotels fell 18.7% from ¥20,703 to ¥16,824 over the same span. September is a month in which the market-wide price band comes down; misreading that step as a shortfall in your own demand and cutting further makes the reduction bite twice. Treat the market’s step as already priced in, and carve out only what lies beyond it as your own decision space.
4. Okinawa-specific context — day-of-week variation is small for resorts and large for city hotels. In July 2026 actuals, the day-of-week spread was just 2.3pt for resorts (Sat 93.5% to Thu/Sun 91.2%) versus 6.0pt for city hotels (Sat 97.7% to Mon 91.7%). Because resorts are governed by multi-night stays and flight schedules, there is more leverage in designing “how many nights the package covers and which days it spans” than in single-night day-of-week pricing. For city hotels, the question is how to capture shoulder nights around the Saturday anchor.
The table below maps the above onto a timeline. As of this article’s data date, August 13 and 15 sit at 12–14 days remaining, August 22 at 21 days, and September 5 at 35 days.
| Timeline | Action | Decision trigger | Objective |
|---|---|---|---|
| T-45 (for early September) | Release September Saturday inventory in stages rather than putting it all out at 45 days out | The market’s September 5 sits relatively low at 45 days out (resorts 79.5%, city 82.1%), yet gained +2.2pt and +4.7pt over the following eight days. Even if your own September Saturdays sit below that level at 45 days out, if the increment over the following eight days is in line with the market, consider adjusting how inventory is released before reaching for discounts | Avoid taking on demand that has momentum at a low rate too early |
| T-45 | Decide the September price floor in advance, with the step down from August already factored in | On a finalized basis, the market declined 27.6% for resorts and 18.7% for city hotels from August to September. If your own September pricing is set below that step, there is room to break down the rationale for the reduction before considering further adjustment | Avoid a double reduction from seasonal and property-specific factors |
| T-30 (for late August) | Treat late-August Saturdays as “high level but slow” and prepare a channel to absorb additional demand | The market’s August 22 moved 81.4% at 45 days out → 84.4% at 30 days out → 85.9% at the latest observation (resorts), with the smallest gain of the four dates over the identical eight-day window at +1.3pt. If your own late August is likewise thinning out after 30 days out, there is room to work on length of stay, meal packages, and how consecutive nights connect | Build a path to additional pickup before the level advantage runs out |
| T-30 | For resorts, span the days of the week through multi-night packaging rather than single nights | In July 2026 actuals, the resort day-of-week spread was only 2.3pt. If the gap between weekdays and Saturday at your property is similarly small, there is more leverage in length-of-stay design than in single-night day-of-week pricing | Capture flat demand through longer stays |
| T-14 (just before Obon) | Vary how inventory is held back between the middle day of Obon and the days around it | The market’s August 13 shows estimated OCC of 89.8% at the latest observation, with the share of properties lacking confirmable listed inventory at 27.8% — the highest of the four dates. August 15 sits at 16.0% on the same measure. If the remaining inventory differs between the middle day and the Saturday at your property, do not treat them the same | Separate tactics for tight dates and dates with slack |
| T-14 | For city hotels, anticipate the late build-up and hold off on the final discount decision | In the market, city hotels moved from 81.7% at 30 days out to 86.2% for August 13 and from 85.3% to 90.0% for August 15, adding +4.5pt and +4.7pt respectively after 30 days out. If your property likewise sees an increment in the final two weeks in a typical year, there is no need to cut on the basis of the 30-days-out level alone | Protect the rate on last-minute demand |
Source: Compiled by the HotelBank Editorial Team from MetroEngines Research data
Conclusion — Three Yardsticks for Reading Okinawa’s Late Summer
Yardstick 1: Hold level and momentum separately. August 22 is high at 85.9% for resorts and 88.8% for city hotels but posts the smallest gain over the identical eight-day window; September 5 is lower at 81.7% and 86.8% but posts the largest gain. These two gauges move independently.
Yardstick 2: Benchmark against the market on days remaining. Given that the latest observations sit at 14, 16, 23, and 37 days remaining, comparing “booked share as of today” side by side carries little meaning. Place your property and the market on the same cross-section using the three fixed points: 45 days out, 30 days out, and the latest observation.
Yardstick 3: September’s price trough is the market’s seasonal shape, not a shortfall at your property. On finalized figures, August to September 2025 was a 27.6% decline for resorts and 18.7% for city hotels. Take that step as a given and treat only what lies beyond it as within your own discretion.
In Okinawa’s late summer, the landing point turns as much on the rate at which early-September demand is accepted as on how the August peak is defended. Not mistaking a low level at 45 days out for weak momentum is the most practical form of defense at this time of year.
About the Data
■ Data sources
Daily observations of publicly listed OTA inventory and public prices in Okinawa Prefecture (compiled by MetroEngines Research). Booking curves are cross-sections by days remaining (lead time) for each stay date; estimated settled ADR is a monthly aggregate. The July 2026 day-of-week actuals use 31 days of daily observations from that month. Scope and periods for each aggregate are as noted alongside each figure and table in this article.
■ Calculation assumptions
Because observation lengths differ by stay date, cross-date comparison of gains uses the identical eight-day window from 45 days out to 37 days out, which is observed for all four dates. Estimated settled ADR distinguishes past months as finalized figures from current and future months as estimates based on current sales conditions, with estimated ranges shown as dashed lines in the charts. Year-over-year changes are calculated only between finalized months.
■ Limitations and caveats
Estimated OCC is an estimate based on OTA-listed inventory and is defined differently from actual room occupancy (it runs higher). The city hotel sample is small at N=14 properties, so a single property can move the numbers. Estimated settled ADR has a median error of 6.6% when reconciled against published operating results. The July 2, 2026 observation is missing across all series and has been excluded. September 5 has been observed only through the 37-days-remaining cross-section, and its subsequent trajectory is outside the scope of this article.
・Definition of estimated OCC (based on OTA-listed inventory): OTA-listed-inventory occupancy = 100 − 100 × OTA-listed remaining rooms ÷ total rooms. This is an estimate based on the sell-through of inventory offered on OTAs and is defined differently from actual room occupancy (it runs higher).
・Booking curve: based on observations from 45 days before the stay date through the latest observation. The latest observation date in this article is July 30, 2026.
・Definition of estimated settled ADR: the transaction price level (tax-exclusive equivalent) estimated from OTA and other sales data (lowest-plan level × property-type coefficient, ensembled across multiple channels). Past months are finalized figures; current and future months are estimates based on current sales conditions. Median error of 6.6% when reconciled against published operating results.
・Scope breakdown: booking curves cover Okinawa Prefecture resort hotels, N=241–245 properties (25,318–25,450 rooms; 192–229 observed properties at the fixed points cited in the article), and city hotels, N=14 properties (3,155 rooms; 13–14 observed). Estimated settled ADR covers Okinawa Prefecture resort hotels, N=259–276 properties, and city hotels, N=11–14 properties. The July 2026 completed-month actuals cover 229–245 observed resort properties and 13–14 city properties. The share of properties with no confirmable listed inventory is an estimate and covers only observations made seven or more days before the stay date.
・Data as of: August 1, 2026. Sales conditions and inventory fluctuate daily, so the figures in this article are a snapshot as of the time of retrieval.