

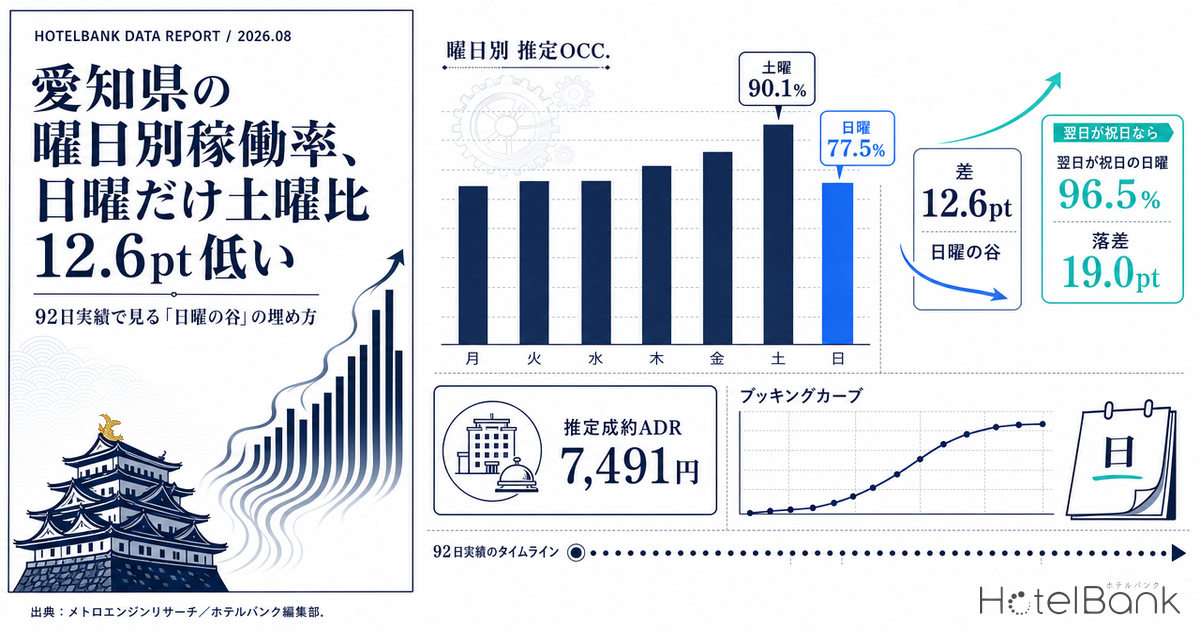
Aichi Prefecture’s hotel market wears a different face on each day of the week. Aggregating the 92 days of completed-month actuals from May to July 2026 by day of week, business hotels recorded an estimated OCC (based on OTA-listed inventory) of 90.5% on Saturdays against 80.4% on Sundays. Looking only at “regular weeks” — excluding public holidays and the days immediately preceding them — Saturday runs 90.1% and Sunday 77.5%, widening the gap to 12.6 points. City hotels carve the same trough, at 89.2% on Saturdays and 77.6% on Sundays on a regular-week basis. Yet this trough disappears easily depending on one thing: whether the next day is a day off. Within those same 92 days, the two Sundays that were followed by a public holiday averaged 96.5% at business hotels and 93.3% at city hotels — a gap of 19.0 points against the ordinary Sunday average of 77.5%. It is not Sunday that is weak; it is the Sunday you check out of and go straight to work. This article layers three views — Aichi’s estimated OCC by day of week, the on-the-books cross-section for September 2026, and the settled ADR estimate for completed months — to set out concrete moves against the Sunday trough.
Coverage: business hotels in Aichi Prefecture (N ≈ 295 properties; 272–298 properties per day) and city hotels (N = 30 properties; 28–30 per day). The price metric in this article is the settled ADR estimate (the transacted price level estimated from OTA and other sales data, tax-excluded equivalent); occupancy is an estimate based on OTA-listed inventory. Definitions for both appear at the end of the article. Data as of August 26, 2026.
- — A 12.6-point Saturday–Sunday gap. Saturday 90.1% against Sunday 77.5% in regular weeks (Aichi business hotels, 92 days of May–July 2026 actuals). The trough is not spread thinly across the week — it is concentrated on a single day.
- — 96.5% when the next day is a public holiday. The 19.0-point step up from an ordinary Sunday is the largest of the seven markets compared. Sunday is not weak; the Sunday before a workday is.
- — The third-deepest trough nationally. Behind Hiroshima at 14.1 points and Osaka at 12.7 points, and more than double Tokyo’s 5.4 points. This is a structure common to markets that lean on business travel.
- — The preparation deadline is T-45. Sunday, September 13 moved only from 74.6% at 45 days out to 77.1% at 19 days out, a gain of 2.5 points — less than half the 5.4 points Saturday added over the same window. Last-minute discounting does not arrive in time.
- — ¥2.14mn a year in the mid case (illustrative; 100 rooms; rate held flat). With the settled ADR estimate for completed months running −0.1% to −1.2% year on year, the fix belongs to stay design rather than to price.
Aichi’s estimated OCC by day of week — only Sunday sits 12.6 points below Saturday
Start with a simple average by day of week across the completed-month actuals for May, June and July 2026 (92 days in total). The coverage is Aichi Prefecture’s business hotels (272–298 properties per day; 40,074–43,387 listed rooms) and city hotels (28–30 properties per day; 4,830–5,209 listed rooms). Average estimated OCC across the whole period is high in both segments: 86.1% for business hotels and 84.3% for city hotels.
Source: MetroEngines Research; compiled by the HotelBank Editorial Team
The shape of the curve is close to identical across the two segments. It dips on Monday, builds through Tuesday, Wednesday and Thursday to a weekday peak on Thursday, eases slightly on Friday, hits the weekly high on Saturday — and then falls away sharply on Sunday. Aichi, centred on Nagoya, is a manufacturing cluster, and the structure in which weekday business travel carries the week reads directly off this shape. Thursday sitting above Tuesday and Wednesday can be read as the overlap of two things: the business-trip pattern of staying Thursday night to finish meetings and plant visits on Friday, and the start of Friday–Saturday leisure demand. The same shape — Sunday lowest in the week, Thursday highest — also holds when Aichi’s business hotels are cut on an April–June 2026 window, so it is not an artefact of the months chosen here.
What deserves attention is that the trough is concentrated on Sunday alone. Monday (82.6% on a regular-week basis) also sits on the low side of the week, but it is still 5.1 points above Sunday’s 77.5%. In other words, the gap an Aichi hotel needs to fill is not scattered thinly across seven days — it is condensed into one. Being able to carve the problem out as a single-day question is the starting point for designing a response. In some prefectures the trough splits across two days, Sunday and Monday; that “double trough” pattern within the week is analysed in detail on a matched lead-time cross-section in Saitama Business Hotels: Sat 77.2% vs Sun 70.1%.
| Day of week | Business (all days) | Business (regular weeks) | City (all days) | City (regular weeks) |
|---|---|---|---|---|
| Mon | 83.5% | 82.6% | 81.8% | 80.8% |
| Tue | 86.3% | 86.3% | 83.5% | 83.6% |
| Wed | 86.7% | 88.1% | 83.4% | 84.5% |
| Thu | 88.4% | 88.4% | 85.9% | 85.9% |
| Fri | 87.1% | 87.1% | 85.6% | 85.6% |
| Sat | 90.5% | 90.1% | 89.6% | 89.2% |
| Sun | 80.4% | 77.5% | 80.0% | 77.6% |
| Sat − Sun | 10.1pt | 12.6pt | 9.6pt | 11.6pt |
“Regular weeks” = the daily average excluding national public holidays and the days immediately preceding them. “All days” = the average across all 92 days. Source: MetroEngines Research; compiled by the HotelBank Editorial Team
This shape is stable across all three months. Business hotels averaged 82.7% on Sundays in May 2026, 76.2% in June and 81.9% in July; city hotels 81.2%, 76.4% and 82.0%. In every month Sunday was the weakest day of the week. This is not single-month noise but a pattern that recurs as a structural feature of the market.
The Sunday trough vanishes when the next day is a day off — a 19.0-point step
Split the 13 Sundays in the 92-day window into those followed by a national public holiday on the Monday (holiday-eve Sundays) and those followed by a workday (ordinary Sundays), and the two barely look like the same day of the week.
| Type of Sunday | Days | Business hotels | City hotels |
|---|---|---|---|
| Sunday followed by a public holiday | 2 days | 96.5% | 93.3% |
| Sunday followed by a workday | 11 days | 77.5% | 77.6% |
| Difference | — | 19.0pt | 15.7pt |
| (Reference) Saturday, regular weeks | 12 days | 90.1% | 89.2% |
Source: MetroEngines Research; compiled by the HotelBank Editorial Team
Holiday-eve Sundays came in at 96.5% for business hotels and 93.3% for city hotels — above even the regular-week Saturday (90.1% / 89.2%). Individually, May 3, 2026 (with Greenery Day on the 4th) ran 97.8% at business hotels and 95.9% at city hotels, while July 19 (with Marine Day on the 20th) ran 95.2% and 90.7%. The reading is that demand is not absent from Sunday as a day of the week; rather, the constraint of starting work the next morning cuts it away.
This distinction matters a great deal in practice. Treating the Sunday trough as an inevitability of the calendar and handling it with discounts means applying the same treatment to Sundays that are followed by a day off — that is, selling the strongest days cheaply. Conversely, for ordinary Sundays the framing becomes: identify and go after the segments for whom the next-morning constraint does not bind. In Aichi’s case the candidates include a second leisure night across Saturday and Sunday, Sunday arrivals positioned for an early Monday start, and out-of-prefecture attendees at Sunday events.
Is Aichi’s 12.6 points deep? — a cross-market comparison of seven markets
Everything so far is self-contained within Aichi. To use it as an input for a single property’s decisions, you need to know whether a 12.6-point trough is deep or shallow by national standards. The table below lines up seven major markets on the identical method (92 days of completed-month actuals, May–July 2026; business hotels; regular weeks, excluding national public holidays and the days immediately preceding them).
| Market | Saturday | Sunday | Sat − Sun | Sunday before a holiday | Step vs ordinary Sunday | Properties per day |
|---|---|---|---|---|---|---|
| Hiroshima | 90.8% | 76.8% | 14.1pt | 95.0% | 18.2pt | 127–168 |
| Osaka | 90.1% | 77.4% | 12.7pt | 90.4% | 13.0pt | 438–453 |
| Aichi | 90.1% | 77.5% | 12.6pt | 96.5% | 19.0pt | 272–298 |
| Kanagawa | 92.8% | 81.9% | 11.0pt | 94.6% | 12.7pt | 179–202 |
| Hokkaido | 92.8% | 84.0% | 8.7pt | 95.3% | 11.3pt | 359–394 |
| Fukuoka | 94.5% | 86.5% | 8.0pt | 96.3% | 9.8pt | 282–317 |
| Tokyo | 95.9% | 90.5% | 5.4pt | 94.7% | 4.2pt | 783–873 |
All figures are estimated OCC (OTA-listed inventory basis). “Sunday before a holiday” is the average of the two qualifying days in each market. Source: MetroEngines Research; compiled by the HotelBank Editorial Team
Aichi’s 12.6 points is the third-deepest of the seven, behind Hiroshima at 14.1 points and Osaka at 12.7 points. At the opposite pole is Tokyo, where Saturday 95.9% against Sunday 90.5% leaves a gap of just 5.4 points. Tokyo’s Sunday level is itself high at 90.5%, which reads as a market where the character of demand does not switch sharply with the day of the week. Fukuoka at 8.0 points and Hokkaido at 8.7 points also hold up on Sundays, in the mid-84% to mid-86% range, and sit on the shallow side. Note that this aggregation does not adjust for differences in property mix, price band or guest composition across markets, so no claim is made here about what drives the differences.
That said, Aichi, Osaka and Hiroshima are all markets where weekday business travel generated by manufacturing and commercial clusters carries the week, and the trough concentrates on the Sunday when that demand disappears. Aichi’s 12.6 points is therefore not “an outlier for this market” but “a structure common to business-travel-dependent markets.” The earlier decision rule — if your own Saturday–Sunday gap runs well beyond 12.6 points, look for causes outside market structure — can be used through this comparison not as a relative value within Aichi but as a comparison against the norm for business-travel markets.
One more thing worth reading is the two right-hand columns, the Sunday before a public holiday. Aichi’s 19.0-point step is the largest of the seven markets, ahead of Hiroshima at 18.2 points and Osaka at 13.0 points, with Tokyo at just 4.2 points. Aichi, in other words, is the market where Sunday demand is most tightly bound by the next morning’s work constraint. Turned around, it also has the largest headroom of the seven once you can build a segment for whom that constraint does not apply.
September 2026 booking curves — Sunday starts low and does not build
Next, for stay dates still on sale, look at the booking curve from 45 days before arrival through to the latest observation. September 19 (Sat) to 23 (Wed, Autumnal Equinox Day), 2026 forms a five-day break bracketed by Respect for the Aged Day and the Autumnal Equinox — the first stretch of its kind in 11 years, since 2015 (Japanese public holiday calendar, Impress Watch). Placing that holiday week alongside the ordinary weekend that precedes it makes the difference in the character of Sunday visible as a difference in curve shape.
Aichi business hotels. Based on observations from 45 days before the stay date through to the latest reading. Source: MetroEngines Research; compiled by the HotelBank Editorial Team
In the regular week, Saturday September 12 built from 76.1% at 45 days out to 81.5% at 19 days out, a gain of 5.4 points, while Sunday the 13th moved only from 74.6% to 77.1%, a gain of 2.5 points. Over the identical observation window, Saturday is clearing inventory at more than twice Sunday’s pace. Sunday carries a double structure: it starts from a lower level, and on top of that its late build is weak. September 5 (Sat) and 6 (Sun) tell the same story — Saturday moved from 85.4% at 45 days out to 89.0% at the latest reading, a gain of 3.6 points, while Sunday went from 78.9% to 79.1%, a gain of 0.2 points.
Once the Silver Week break starts, however, the order inverts. Saturday September 19 already stood at 93.3% at 45 days out and Sunday the 20th at 95.7% — Sunday above Saturday. At the latest reading the run is 96.7% on the 19th, 98.2% on the 20th, 96.7% on the 21st (Mon, Respect for the Aged Day), 92.9% on the 22nd (Tue, citizens’ holiday) and 88.4% on the 23rd (Wed, Autumnal Equinox Day) — high levels sustained across all five days. City hotels take the same shape, at 97.9% on the 19th, 98.3% on the 20th and 97.4% on the 21st. A Sunday inside a holiday break has to be handled as an entirely different product from an ordinary Sunday. The pattern of demand loading into the front half of a five-day break is common to other areas as well, and is translated into a T-45 / T-30 / T-14 countdown calendar in Osaka Sep 2026 Holiday: Demand Peaks First 2 Nights.
| Stay date | Business T-45 | Business T-30 | Business latest | City T-45 | City latest |
|---|---|---|---|---|---|
| Sep 5 (Sat) | 85.4% | 88.2% | 89.0% | 81.9% | 86.4% |
| Sep 6 (Sun) | 78.9% | 78.7% | 79.1% | 74.8% | 77.0% |
| Sep 12 (Sat) | 76.1% | 79.2% | 82.0% | 82.2% | 86.0% |
| Sep 13 (Sun) | 74.6% | 76.2% | 77.1% | 76.5% | 79.6% |
| Sep 19 (Sat, first day of the break) | 93.3% | 95.9% | 96.7% | 96.0% | 97.9% |
| Sep 20 (Sun, middle of the break) | 95.7% | 97.5% | 98.2% | 95.8% | 98.3% |
| Sep 21 (Mon, Respect for the Aged Day) | 94.2% | 96.1% | 96.7% | 95.8% | 97.4% |
| Sep 23 (Wed, Autumnal Equinox Day) | 88.7% | 88.4% | 88.4% | 90.9% | 90.5% |
| Sep 26 (Sat) | 97.1% | — | 97.5% | 95.9% | 97.7% |
| Sep 27 (Sun) | 92.3% | — | 92.8% | 94.3% | 95.1% |
| Oct 3 (Sat) | 89.6% | — | 90.0% | 95.5% | 95.2% |
| Oct 4 (Sun) | 78.7% | — | 78.6% | 84.9% | 85.4% |
“Latest” is the most recent observation for each stay date (11–40 days remaining). Stay dates without a 30-day-out reading are shown as “—”. Based on observations from 45 days before the stay date through to the latest reading. Source: MetroEngines Research; compiled by the HotelBank Editorial Team
The weekend after the break (September 26 and 27) also sits high at 45 days out, at 97.1% and 92.3% for business hotels and 95.9% and 94.3% for city hotels. Then Sunday October 4 returns to the ordinary Sunday level at 78.7% for business hotels — 10.9 points below Saturday October 3. The sequence on the books is that once late September’s high occupancy has passed, the Sunday trough is waiting again in October’s regular weeks.
Settled ADR estimate for completed months is flat year on year — the market is being carried by occupancy
Step back from the day-of-week view and check the monthly price level. Because the settled ADR estimate uses the month as its canonical unit of aggregation, this article does not go into prices by day of week and deals only with year-on-year comparisons between completed months. Aichi business hotels’ settled ADR estimate has stayed pinned to last year’s level across the three most recent months for which figures are final.
Aichi business hotels. Solid line = final figures; dashed line = current estimate based on the present state of sales (different basis, so not directly comparable with final figures). Source: MetroEngines Research; compiled by the HotelBank Editorial Team
| Stay month | Business 2026 | Business 2025 | YoY | City 2026 | City 2025 | YoY |
|---|---|---|---|---|---|---|
| May | ¥8,192 | ¥8,035 | +2.0% | ¥13,393 | ¥11,979 | +11.8% |
| June | ¥7,330 | ¥7,339 | −0.1% | ¥11,470 | ¥11,701 | −2.0% |
| July | ¥7,491 | ¥7,584 | −1.2% | ¥11,466 | ¥11,684 | −1.9% |
Business hotels N = 323–328 properties; city hotels N = 30–31 properties. All comparisons are between final figures for past months. Source: MetroEngines Research; compiled by the HotelBank Editorial Team
Business hotels ran +2.0% in May, −0.1% in June and −1.2% in July. City hotels grew sharply at +11.8% in May but reversed to −2.0% in June and −1.9% in July. Set against estimated OCC over the same three months of 86.1% for business hotels and 84.3% for city hotels, Aichi reads as a market in a phase where occupancy is stacking up but rate is not clearly beating last year.
That configuration bears directly on how the Sunday response should be designed. Even with a 12.6-point spread between the strongest day of the week (Saturday) and the weakest (Sunday) for business hotels in regular weeks, the monthly rate is tracking flat against last year. Filling Sunday by cutting rate tends to push the monthly average rate down further. The order that follows is that what needs filling is not a price ladder but stay design and the entry points for particular segments. Note that the estimates for August 2026 onward (¥9,136 in August, ¥13,764 in September and so on) are estimates based on the current state of sales; the basis differs from final figures, so no direct comparison is drawn against last year’s finals. Waiting for those months to close before assessing them is the appropriate course.
The revenue range from filling the Sunday trough — an illustrative estimate per 100 rooms
Everything up to here is market observation. Making a decision in practice requires a sense of magnitude: if this trough is closed by some number of points, how much do a single property’s numbers move? What follows is an illustrative estimate that refers to no specific property, applying observed values from Aichi’s business hotel market to a 100-room property.
Three assumptions. (1) Only “Sundays followed by a workday” are treated as improvable. In this article’s window (92 days, May–July 2026), 11 of the 13 Sundays qualified, so the figure is set at 11 days per quarter, or roughly 44 days on an annualised basis. (2) The rate per room is held at ¥7,491, the settled ADR estimate for July 2026, the most recent completed month (Aichi business hotels, N = 323 properties, tax-excluded equivalent). Since the premise is not to fill the trough by discounting, the rate does not move. (3) Every additional room-night is counted as additional revenue, with no variable costs deducted. What follows is therefore a revenue impact, not a profit impact.
| Scenario | Improvement | Sunday level after | Added room-nights per year | Added annual revenue | How the level was set |
|---|---|---|---|---|---|
| Pessimistic | +2.0pt | 79.5% | 88 room-nights | ¥0.66mn | Only a modest improvement on the current level |
| Mid | +6.5pt | 84.0% | 286 room-nights | ¥2.14mn | Closing to Hokkaido’s Sunday level (84.0%) |
| Optimistic | +9.0pt | 86.5% | 396 room-nights | ¥2.97mn | Closing to Fukuoka’s Sunday level (86.5%) |
The starting point is the regular-week Sunday level of 77.5% (Aichi business hotels). The Hokkaido and Fukuoka levels used as benchmarks come from the same aggregation as Table 3. Illustrative only — not the actual results of any real property. Source: MetroEngines Research; compiled by the HotelBank Editorial Team
The mid scenario (+6.5 points) yields 286 additional room-nights and ¥2.14mn a year. The point of the estimate is that for a 100-room property, a problem confined to one day of the week becomes a two-million-yen-scale question over a year. Closing the full 12.6-point gap to Saturday is not realistic, but taking half of it is already an amount that cannot be waved away.
That amount does, however, move with where the rate is set. Varying the rate assumption against the size of the improvement gives the following.
| Rate per room | Improvement in estimated OCC on ordinary Sundays | ||||
|---|---|---|---|---|---|
| +2pt | +4pt | +6pt | +8pt | +10pt | |
| ¥6,500 | 0.57 | 1.14 | 1.72 | 2.29 | 2.86 |
| ¥7,000 | 0.62 | 1.23 | 1.85 | 2.46 | 3.08 |
| ¥7,491 (latest completed month) | 0.66 | 1.32 | 1.98 | 2.64 | 3.30 |
| ¥8,000 | 0.70 | 1.41 | 2.11 | 2.82 | 3.52 |
| ¥8,500 | 0.75 | 1.50 | 2.24 | 2.99 | 3.74 |
The shaded cell is the neighbourhood of the mid scenario (rate ¥7,491, +6pt). Added annual revenue = 100 rooms × improvement × 44 days × rate. Illustrative only — not the actual results of any real property. Source: MetroEngines Research; compiled by the HotelBank Editorial Team
Added revenue is the product of the improvement and the rate, so it scales with both. The realistic range of each differs, however. The rate moves only 1.3-fold across the market range of ¥6,500 to ¥8,500, while the improvement spans a five-fold range from +2 points to +10 points. Of the 6.5-fold spread between the bottom-left cell (¥6,500, +2pt) at ¥0.57mn and the top-right (¥8,500, +10pt) at ¥3.74mn, most is created by the horizontal axis. In practice, lifting the rate by ¥1,000 (¥7,491 → ¥8,500 in the +6pt column) takes ¥1.98mn only to ¥2.24mn, whereas holding the rate flat and moving the improvement from +6 to +8 points takes ¥1.98mn to ¥2.64mn. As Table 4 showed, Sunday starts low at 45 days out and builds weakly thereafter, so this horizontal axis is a variable to be won through early preparation and product design, not through the depth of a discount.
Conversely, filling Sunday by discounting moves the vertical axis of this table downward. In a phase where the settled ADR estimate for completed months is running −0.1% to −1.2% year on year (business hotels, June and July 2026), pushing right along the horizontal axis while pulling the vertical axis down will not stack up added revenue as expected.
For revenue managers running business and city hotels in Aichi — implications and an action plan
1. Do not lump “Sunday” into a single calendar item. What the market data shows is that a Sunday followed by a workday (77.5% for business hotels) and a Sunday followed by a public holiday (96.5%) are separate products 19.0 points apart, despite falling on the same day of the week. If your annual calendar carries a uniform setting for Sunday, start by colour-coding “ordinary Sundays” separately from “Sundays inside a holiday break.” It is worth checking recent actuals to see whether you have been loosening even the holiday-eve Sundays as if they were part of the trough.
2. See whether your own Sunday is deeper or shallower than the market trough. The regular-week market level is 77.5% for business hotels and 77.6% for city hotels, with a gap to Saturday of 12.6 and 11.6 points respectively. If the spread between your own Sunday and Saturday occupancy is wider than that, it is worth considering whether property-specific factors (visibility, minimum-stay settings, the presence or absence of multi-night products) are being layered on top of the market-wide day-of-week structure. If the spread is narrower, you already have a working Sunday acquisition path — and room to extend that path to other weak dates.
3. Sunday starts low and builds weakly. It is hard to recover late. Sunday September 13 moved only from 74.6% at 45 days out to 77.1% at the latest reading, a gain of 2.5 points — less than half the 5.4 points added by Saturday September 12 over the same window. Trying to clear Sunday inventory with last-minute discounting struggles to arrive in time, because the underlying build is slow to begin with. Realistically, the preparation belongs earlier than 45 days out — at the same time as the Saturday product design.
4. Rate is flat year on year. Fill with stay design rather than price. The settled ADR estimate for completed months came in at −0.1% in June and −1.2% in July for business hotels, and −2.0% and −1.9% for city hotels — not beating last year. With occupancy already high at 86.1% and 84.3% and rate not growing, filling the Sunday trough with further discounting is likely to squeeze the monthly rate further. There is room in the direction of building a second night at the same rate band — Saturday-plus-Sunday stays, or a Sunday-in, Monday-out product with late checkout.
5. The same trough returns in early October. Sunday October 4 is back at the ordinary Sunday level, at 78.7% for business hotels at 45 days out, 10.9 points below Saturday the 3rd. Even if Silver Week’s high occupancy tidies up the September numbers, the working assumption should be that the same problem recurs in October’s regular weeks — which argues for acting now.
| Horizon | Move | Trigger for the decision (figures from this article) | Objective |
|---|---|---|---|
| Today to this week | Take stock of minimum-stay settings on Sundays and confirm that a Saturday-plus-Sunday stay can actually be booked | If your own Sunday occupancy sits below the regular-week market level (business 77.5% / city 77.6%) | Secure a path for extending Saturday demand into Sunday |
| Today to this week | Pull the “Sundays followed by a public holiday” out of the annual calendar and give them settings separate from ordinary Sundays | With a market gap of 19.0pt (business) / 15.7pt (city) between the two, a single shared setting is a candidate for review | Avoid treating the strongest Sundays as part of the trough and leaving revenue on the table |
| Within two weeks | Launch one Saturday-plus-Sunday product (late checkout or in-house benefits attached to the second night) | Raise the priority if your own Saturday-to-Sunday occupancy spread exceeds the market’s 12.6pt (business) | Add Sunday room-nights without cutting rate |
| Within two weeks | Separate the entry points by segment for Sunday arrivals (pre-stay for a Monday-morning business start, out-of-prefecture weekend event attendance, midweek travel by senior guests) | Working from the structure in which Sunday builds only about +2.5pt from 45 days out to the latest reading (market actuals for Sep 13) | Reduce reliance on the last minute and move Sunday inventory earlier |
| Looking to next month | For ordinary-week Sundays in October (October 4 and similar), compare your own position at 45 days out against the market’s 78.7% (business) | If you are below the market level, consider product-side measures now rather than at the last minute | Fill October’s trough, hidden behind September’s high occupancy, in advance |
| Looking to next month | Manage the monthly rate target and the day-of-week occupancy target separately, and assign the Sunday fix to variables other than rate | In a phase where the settled ADR estimate for completed months runs −0.1% to −1.2% year on year (business) | Avoid the cycle of chasing occupancy by shaving rate |
Source: MetroEngines Research; compiled by the HotelBank Editorial Team
Summary — three yardsticks for measuring Sunday in Aichi
Aichi’s day-of-week structure can be carried around in three numbers.
1. Depth of the trough: 12.6 points. The gap between regular-week Saturday (90.1% for business hotels) and Sunday (77.5%). If your own Saturday–Sunday spread exceeds it, that is the starting point for suspecting causes outside market structure. For city hotels, 11.6 points plays the same role.
2. The condition that removes the trough: whether the next day is a day off. Sundays followed by a public holiday run 96.5% at business hotels and 93.3% at city hotels — above even the regular-week Saturday. Do not treat Sunday uniformly; split the calendar in two by the attribute of the following day.
3. The preparation deadline: 45 days out. Sunday starts from a low level at 45 days out and builds only about 2.5 points from there (measured on September 13). Rather than designing to recover late, prepare the product on the assumption that the outcome is already largely settled at 45 days out.
September 2026 brings the first five-day break in 11 years, and Aichi’s estimated OCC stacks up into the 96–98% range across September 19 to 21. Those figures will lift the monthly average — and hidden behind them, an ordinary Sunday such as October 4 is waiting at 78.7%. Separating the high occupancy of the holiday break from the trough of a regular week is what will determine the precision of next quarter’s planning.
About the Data
— Definition of estimated OCC: occupancy on an OTA-listed inventory basis = 100 − 100 × rooms still listed on OTAs ÷ total rooms. It is an estimate based on how listed inventory is being taken up on OTAs, and its definition differs from actual room occupancy (it reads higher). This article labels it “estimated OCC (OTA-listed inventory basis).” The months covered by the day-of-week aggregation are May, June and July 2026 (92 days in total); the on-the-books cross-section covers stay dates from August 29 to October 8, 2026.
— Booking curves: based on observations from 45 days before the stay date through to the latest reading.
— Definition of the settled ADR estimate: the transacted price level (tax-excluded equivalent) estimated from OTA and other sales data (the cheapest-plan level × a segment-specific coefficient, ensembled across multiple channels). Past months are final; the current and future months are estimates based on the present state of sales. Against published operating results, the median error is 6.6%. Year-on-year comparisons are calculated only between final figures; no direct comparison is drawn between current or future estimates and last year’s finals.
— Breakdown of N: the day-of-week estimated OCC covers Aichi business hotels (272–298 properties per day; 40,074–43,387 listed rooms) and city hotels (28–30 properties per day; 4,830–5,209 listed rooms). The settled ADR estimate covers business hotels at N = 323–328 properties and city hotels at N = 30–31. The on-the-books cross-section covers 279–296 business hotels and 28–30 city hotels.
— National public holidays for May–July 2026 were taken as May 3 (Constitution Memorial Day), May 4 (Greenery Day), May 5 (Children’s Day), May 6 (substitute holiday) and July 20 (Marine Day).
— Data as of August 26, 2026. Sales conditions and inventory change daily, so the figures in this article are a snapshot at the time of retrieval.
References & Sources
■ Data sources
Estimated OCC by day of week and across markets is the simple average, by day of week, of daily inventory observations for the 92 stay dates from May 1 to July 31, 2026, covering business hotels in Aichi, Hiroshima, Osaka, Kanagawa, Hokkaido, Fukuoka and Tokyo and city hotels in Aichi. The on-the-books cross-section takes, for stay dates from August 29 to October 8, 2026, the readings at 45 days out, 30 days out and the latest observation (11–40 days remaining). For the settled ADR estimate, only final figures for past months were used for year-on-year comparison, drawn from the monthly series covering January 2025 to December 2026. All are aggregations by MetroEngines Research.
■ Assumptions for the illustrative estimate
The revenue range is an illustrative estimate referring to no specific property. It assumes 100 rooms and covers only “Sundays followed by a workday”; since 11 of 13 such Sundays qualified in the 92-day window, the figure is set at 11 days per quarter, or roughly 44 days per year. The rate is held at ¥7,491, the settled ADR estimate for July 2026, the most recent completed month (Aichi business hotels, N = 323 properties, tax-excluded equivalent), and filling the trough by discounting is not part of the premise. Every additional room-night is counted as additional revenue, with no variable costs or distribution commissions deducted. The post-improvement levels drawn from Hokkaido (84.0%) and Fukuoka (86.5%) are observed values from the same aggregation method as Table 3.
■ Limitations and caveats
Estimated OCC is an estimate based on the take-up of OTA-listed inventory; its definition differs from actual room occupancy and it reads higher. The day-of-week figures are simple averages across 92 days over three months, and the samples are small — 11 ordinary Sundays and only two Sundays followed by a public holiday, the latter carrying the swing of individual days directly. The cross-market comparison is aligned on an identical aggregation method, but differences in property mix, price band and inbound share across markets are not adjusted for. The revenue range is a revenue impact, not a profit impact, and it does not demonstrate that the improvements are achievable. Price levels by day of week are not addressed (the settled ADR estimate takes the month as its canonical unit of aggregation). The figures are a snapshot as of August 26, 2026, and sales conditions and inventory change daily.
— When is Silver Week 2026? The five-day break, September 19–23 | Japanese public holiday calendar
— Silver Week returns: September 2026 brings the first long break in 11 years | Impress Watch
Related Reading
- Saitama Business Hotels: Sat 77.2% vs Sun 70.1%, Gap Widens to 11pt
- Hokkaido Business Hotels Aren’t Weekend-Led: Thu 95.4% Ties Sat 95.4%
- Osaka Sep 2026 Holiday: Demand Peaks First 2 Nights, Sep 23 at 58.0%
- Ibaraki Silver Week: Ryokan-Business Gap Hits 21.9pt, Back Half Flat
- Kyoto Day-of-Week OCC: Thursday 90.4% Edges Friday, May–Jul 2026
- Fukui Ryokan Sat 90.9% vs Mon 76.3%: Business Hotels Dip on Sunday
- Asian Games 2026: Toyohashi +18.7pt, Kuwana +14.4pt Beyond Nagoya