

Japan’s hotel supply pipeline is usually discussed in terms of “how many rooms, and where.” But for operators chasing management contracts, for investors trying to judge how likely a pipeline project is to complete, and for landowners and redevelopment associations deciding whether to put a hotel into their allocated floor space, the more practical question lies elsewhere: who is actually ordering those rooms in the first place?
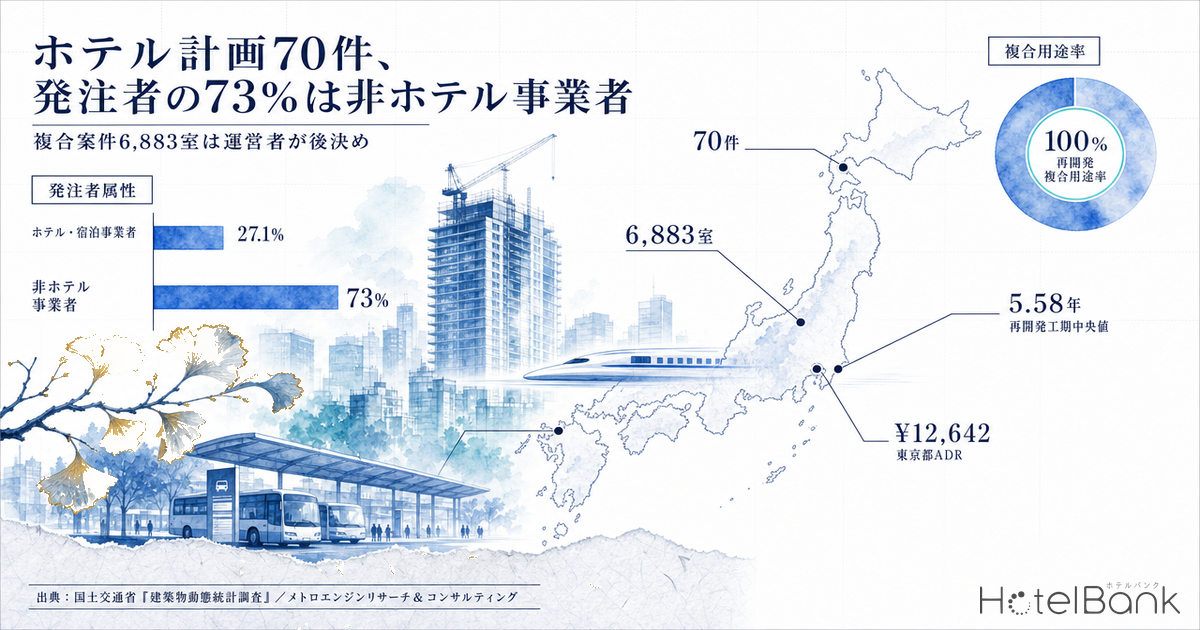
Using our construction-plan dataset, built on the Ministry of Land, Infrastructure, Transport and Tourism (MLIT) “Building Dynamics Statistics Survey,” we extracted 70 hotel projects with 50 rooms or more and classified the building owner (the client placing the order) by attribute. The headline finding: only 19 of the 70 projects — 27.1% — are ordered by a hotel or lodging operator. The remaining 70%-plus are ordered by parties that come at the project from the land side: real estate, railways, and redevelopment bodies.
Metric Definitions Used in This Article
- Construction-plan data: Plan information on a building-confirmation-application basis, based on the MLIT “Building Dynamics Statistics Survey.” This article covers 70 projects that list hotel among their principal uses and have 50 rooms or more (extracted 1 September 2026).
- Owner attribute: Our own classification, derived from keyword matching against the building owner (client) name string. The matching rules are disclosed in the body text. This is a breakdown by attribute, not a ranking of companies.
- Construction period: Days from groundbreaking to scheduled completion, divided by 365.25 to give years. Calculated only for the 59 projects with a recorded groundbreaking date.
- ADR (average daily rate): An estimated settled rate (tax-exclusive equivalent) calculated by applying a segment-specific adjustment coefficient to the lowest published plan rate each property lists on OTAs (two guests per room, per-room price, tax-inclusive). Cross-checked against per-property results disclosed by listed hotel REITs (91 properties, most recent three months), the median error is approximately 7%. These are estimates and differ from each property’s actual transacted rates and accounting figures. Area-level ADR is the median across the covered properties (the level of a typical property in that area).
- Data sources: MLIT “Building Dynamics Statistics Survey”; MetroEngines Research & Consulting
How this differs from our earlier work. Among our published pieces using the same construction-plan dataset, “Measuring Hotel Build Times — 2.80 Years from Groundbreaking to Completion Across 67 Plans” dealt with the time axis, while a companion piece on room stock across Japan’s 20 major markets dealt with volume. A separate macro analysis worked backwards from construction-start statistics to show that hotel openings cluster in April, July and December. This article counts neither volume nor time, but the composition of the parties involved.
- — Of 70 hotel projects with 50 rooms or more, only 19 projects — 27.1% are ordered by a hotel or lodging operator. The other 72.9% are ordered by parties entering from the land side: real estate, railways, redevelopment.
- — The largest group by project count is real estate developers, at 33 projects (47.1%) and 7,091 rooms. For operators, most sales targets are not hotel companies.
- — Mixed-use accounts for 29 projects and 7,745 rooms — 49.9% of all rooms. Within that, the 27 projects and 6,883 rooms ordered by non-hotel companies form the pool where the operator is most likely to be decided later.
- — The median construction period is 2.75 years overall (n=59), but redevelopment implementation bodies run to 5.58 years — the longest. The consensus-building period before groundbreaking is not included in that figure.
- — The mixed-use share of rooms flips from 33.9% for 2026 completions to 63.0% by 2028. The further out the supply, the more the party that owns the floor space differs from the party that operates it.
Only 27.1% of clients are hotel or lodging operators
First, the classification rules. We evaluated the building owner name string in the following priority order. (1) If it contains “association” or “redevelopment corporation,” it is a redevelopment implementation body. (2) If it contains “hotel,” “resort,” or another lodging-operator name, it is a hotel or lodging operator. (3) If it contains a railway operator or railway-group company name, it is a railway or transport operator. (4) If it contains “real estate,” “estate,” “urban development,” “house” and similar, it is a real estate developer. (5) Operating companies matching none of the above are other operating companies, and projects with a blank owner field are unknown.
Placing (2) hotel operators ahead of (3) railways is deliberate. Projects ordered by a railway group’s hotel-operating subsidiary are counted on the hotel-operator side, not the railway side. In other words, the “share of projects ordered by hotel operators” is an upper-leaning value under this classification. Even so, it is 27.1%. Where a joint venture spans multiple attributes, the project is counted once, under whichever attribute matches first in the priority order above.
| Owner attribute | Projects | Share of projects | Rooms | Share of rooms | Median per project | Mixed-use rate | Median build period |
|---|---|---|---|---|---|---|---|
| Real estate developers | 33 | 47.1% | 7,091 | 45.7% | 180 | 42% | 2.06 yrs (n=31) |
| Hotel & lodging operators | 19 | 27.1% | 3,815 | 24.6% | 197 | 11% | 3.06 yrs (n=12) |
| Railway & transport operators | 6 | 8.6% | 1,208 | 7.8% | 208 | 83% | 3.67 yrs (n=6) |
| Redevelopment implementation bodies | 5 | 7.1% | 997 | 6.4% | 197 | 100% | 5.58 yrs (n=5) |
| Other operating companies | 5 | 7.1% | 2,193 | 14.1% | 338 | 60% | 3.00 yrs (n=5) |
| Unknown | 2 | 2.9% | 213 | 1.4% | 106 | 0% | — |
| Total | 70 | 100% | 15,517 | 100% | 190 | 41% | 2.75 yrs (n=59) |
Source: Compiled by MetroEngines Research & Consulting from MLIT “Building Dynamics Statistics Survey” (our construction-plan data, 50+ rooms, N=70 projects, extracted 1 September 2026)
Source: MLIT “Building Dynamics Statistics Survey” / MetroEngines Research & Consulting (our construction-plan data, 50+ rooms, N=70 projects, extracted 1 September 2026)
The largest group by project count is real estate developers, with 33 projects (47.1%), and they account for almost half the rooms as well, at 7,091 (45.7%). Hotel and lodging operators come to 19 projects and 3,815 rooms — 27.1% of projects and 24.6% of rooms. Then follow railway and transport operators with 6 projects, redevelopment implementation bodies with 5, other operating companies with 5, and 2 projects with no recorded building owner.
What this composition means is straightforward. Three-quarters of hotel rooms in projects of 50 rooms or more are ordered by parties whose core business is not lodging. Parties that already hold the land, or are in a position to acquire it, decide on the building first and then place a hotel use inside it. For an operator chasing a management contract, most of the sales targets are not hotel companies but real estate companies, railway companies and redevelopment associations. Counting the same construction-plan data from the contractor side instead, our 2026 ranking of hotel construction contractors found that more than half of projects are registered with the contractor still undecided. So a substantial number of projects are decided late on both the client side and the contractor side.
7,745 mixed-use rooms — half are not in a “hotel-only” building
Next, using the recorded principal uses, we split the projects into standalone (hotel as the only principal use) and mixed-use (office, retail, residential and so on listed alongside). Of the 70 projects, 29 are mixed-use. That is 41% by project count, but 7,745 rooms, or 49.9% of the total 15,517. The reason is scale: the median room count per project is 171 for standalone versus 216 for mixed-use.
The mixed-use rate splits sharply by owner attribute. All 5 redevelopment implementation body projects are mixed-use (100%), as are 5 of 6 railway and transport operator projects (83%), 3 of 5 other operating company projects (60%), and 14 of 33 real estate developer projects (42%). Against that, hotel and lodging operators come in at 2 of 19 (11%) — almost every project a hotel company orders is a standalone hotel building.
Source: MLIT “Building Dynamics Statistics Survey” / MetroEngines Research & Consulting (our construction-plan data, 50+ rooms, N=70 projects, extracted 1 September 2026)
Dividing total gross floor area by room count makes the difference clearer still. In standalone projects, the median gross floor area per room is 30.9 m²; in mixed-use projects it jumps to 217.5 m². Of course, mixed-use floor area includes office, retail and residential space, so this is not a per-room unit for the hotel component. Read the other way, it shows that the bulk of the floor area is taken up by something other than the hotel. The 30.9 m² figure for standalone projects is broadly consistent with our earlier analysis, which derived a 35.0 m² per-room unit from 31 plans.
How far do the numbers move if you draw the lines differently?
Everything above depends on two lines. One is the priority order for owner attributes; the other is the split between standalone and mixed-use. Both rules are disclosed in the body text, but it is worth showing how much the conclusions shift when the rules change.
| Definition varied | Rule used here | Alternative rule/th> | Effect on the conclusion |
|---|---|---|---|
| Standalone vs. mixed-use split Which side “hotel + parking” is counted on | Mixed-use: 29 projects, 7,745 rooms (49.9% of all rooms) | Mixed-use: 26 projects, 7,082 rooms (45.6% of all rooms) | The mixed-use share of rooms is 45.6–49.9%. The “roughly half” conclusion holds under either rule |
| Priority order for owner attributes Whether a railway group’s hotel subsidiary counts as railway | Hotel & lodging operators 19 (27.1%) | Hotel & lodging operators 18 (25.7%) | Only one project is affected. 27.1% is an upper-leaning value; it can only move down |
| Both rules relaxed at once | Likely operator-decided-later: 27 projects, 6,883 rooms | 24 projects, 6,220 rooms | 6,220–6,883 rooms, or 40.1–44.4% of all rooms |
Source: Compiled by MetroEngines Research & Consulting from MLIT “Building Dynamics Statistics Survey” (our construction-plan data, 50+ rooms, N=70 projects, extracted 1 September 2026)
In short, both headline figures are robust to definition. The mixed-use share of rooms stays in the high-40s regardless of where the line is drawn, and the 27.1% hotel-operator share can only fall if the priority order is tightened — there is no room for it to rise. The conclusion that three-quarters of rooms are ordered by parties whose core business is not lodging survives any reasonable change to the rules.
When do the operator-decided-later rooms arrive?
Crossing standalone and mixed-use against scheduled completion year shows that the character of the supply changes over time. This table is for reading how many rooms of the operator-decided-later type land in which year.
| Scheduled completion | Standalone projects | Standalone rooms | Mixed-use projects | Mixed-use rooms | Mixed-use share of rooms |
|---|---|---|---|---|---|
| 2025 | 14 | 2,590 | 8 | 2,714 | 51.2% |
| 2026 | 14 | 3,153 | 6 | 1,617 | 33.9% |
| 2027 | 9 | 1,501 | 9 | 2,314 | 60.7% |
| 2028 | 4 | 528 | 4 | 900 | 63.0% |
| 2029 | 0 | 0 | 1 | 100 | 100% |
| 2031 | 0 | 0 | 1 | 100 | 100% |
| Total | 41 | 7,772 | 29 | 7,745 | 49.9% |
Source: Compiled by MetroEngines Research & Consulting from MLIT “Building Dynamics Statistics Survey” (our construction-plan data, 50+ rooms, N=70 projects, extracted 1 September 2026)
The 2026 completion cohort has the lowest mixed-use share at 33.9%, dominated by standalone buildings. But that flips to 60.7% in 2027 and 63.0% in 2028. Absolute project counts fall, yet the projects that remain skew mixed-use. The supply completing soon is more likely to have its operating model already settled; the further out the supply, the more the party that owns the floor space differs from the party that operates it. As noted, however, building-confirmation applications for 2028 and beyond are still accumulating, so the project and room counts shown here are lower bounds on what is currently visible.
The 5 projects ordered by redevelopment bodies — a 5.58-year median build period
Looking at median build periods by attribute: real estate developers 2.06 years, other operating companies 3.00 years, hotel and lodging operators 3.06 years, railway and transport operators 3.67 years, and redevelopment implementation bodies at 5.58 years — the longest. The 1.96-year standalone versus 4.00-year mixed-use gap we reported earlier (1.93 versus 4.00 years on this re-extraction) shows up as the same structure when viewed from the owner-attribute side.
All 5 projects ordered by redevelopment implementation bodies are mixed-use. Because they must clear city-planning decisions, association establishment approval and rights-conversion plan approval before construction can begin, the span from groundbreaking to completion also tends to run long. On top of that, the consensus-building period before groundbreaking does not appear in this data at all. So the build periods shown here are only part of the real elapsed time between a landowner joining a project and the rooms going into service. In the sense of replacing existing urban floor space with hotel use, our earlier study of 14 department-store sites converted to hotels covers the same family of projects.
| Location | Rooms | Building owner (implementation body) | Groundbreaking | Scheduled completion | Build period | Principal uses |
|---|---|---|---|---|---|---|
| Nodayacho, Kita-ku, Okayama City, Okayama | 300 | Nodayacho District Urban Redevelopment Preparatory Association | April 2021 | December 2028 | 7.75 yrs | Residential, hotel, retail |
| Ikegamicho, Utsunomiya City, Tochigi | 300 | Ikegamicho District Superior Building Development Association (members: Marui Bussan, Saito Shoten) | April 2026 | October 2028 | 2.58 yrs | Hotel, restaurants and others |
| Nihonbashi 1-chome, Chuo-ku, Tokyo | 197 | Nihonbashi 1-chome Central District Urban Redevelopment Association (project collaborators: Mitsui Fudosan, Nomura Real Estate) | January 2020 | October 2027 | 7.75 yrs | Retail, office, hotel, apartments and others |
| Dogenzaka 2-chome, Shibuya-ku, Tokyo | 130 | Dogenzaka 2-chome South District Urban Redevelopment Association (project collaborators: Mitsubishi Estate, Kajima Corporation) | January 2024 | March 2027 | 3.20 yrs | Office, hotel, retail, parking |
| Kumoidori 5-chome, Chuo-ku, Kobe City, Hyogo | 70 | Kumoidori 5-chome Redevelopment Co., Ltd. | June 2022 | December 2027 | 5.58 yrs | Hotel, office, retail, bus terminal, library |
Source: Compiled by MetroEngines Research & Consulting from MLIT “Building Dynamics Statistics Survey” (our construction-plan data, 50+ rooms, N=70 projects, extracted 1 September 2026)
Source: Compiled by MetroEngines Research & Consulting from MLIT “Building Dynamics Statistics Survey.” Note: locations are approximate, at the chome (block) level. The 5 projects ordered by redevelopment implementation bodies, out of our construction-plan data, 50+ rooms, N=70 projects
These 5 projects are scattered across the country. The 300 rooms at Nodayacho in Kita-ku, Okayama City (residential, hotel and retail; scheduled completion December 2028; 40,400 m² gross floor area) and the 300 rooms at Ikegamicho in Utsunomiya City (scheduled completion October 2028) both sit in the central districts of regional core cities. The 70 rooms at Kumoidori 5-chome in Chuo-ku, Kobe City are part of a complex that also houses a bus terminal and a library. For the Utsunomiya 300-room plan, we have separately examined how much of that supply the market can absorb.
Source: MLIT “Building Dynamics Statistics Survey” / MetroEngines Research & Consulting (our construction-plan data, 50+ rooms, N=70 projects, extracted 1 September 2026)
Stacking rooms by scheduled completion year gives 5,304 rooms in 2025, 4,770 in 2026, 3,815 in 2027, 1,428 in 2028, 100 in 2029 and 100 in 2031. Rooms from redevelopment implementation bodies land late, with 397 in 2027 and 600 in 2028. But the low project counts from 2028 onward do not mean the pipeline is drying up. Building-confirmation applications are normally filed one to two years before opening, so plans not yet filed will accumulate. The figures shown here for 2028 and beyond should be read as lower bounds on what is currently visible. Read alongside our count of supply from the opening side rather than the plan side — 1,242 openings and 33,749 rooms in 2026 — the gap between application build-up and actual openings becomes easier to see.
Where are the 6,883 rooms most likely to have their operator decided later?
From an operator’s point of view, the meaningful cross-section is this: projects that are mixed-use and not ordered by a hotel or lodging operator. That comes to 27 projects and 6,883 rooms — 88.9% of the 7,745 mixed-use rooms, and 44.4% of the 15,517 total.
These are projects where the party holding the floor space chose hotel as a use and will decide the operator later (or has already decided but it does not show up in the plan data). In fact, the scheduled opening date field was blank for all 70 projects extracted — this despite groundbreaking dates being recorded for 59 and scheduled completion dates for all 70. That is a missing data field rather than direct evidence of “operator undecided,” but it does show that at the building-confirmation stage, opening timing is not treated as confirmed information. Management-contract discussions have no choice but to be built backwards from the scheduled completion date.
Below are the prefectures where those 6,883 rooms sit, alongside current rate levels in each area — the first numbers anyone considering a management contract will want to check.
| Prefecture | Projects | Rooms | Estimated settled ADR (July 2026) | YoY | N (properties) |
|---|---|---|---|---|---|
| Hokkaido | 6 | 1,851 | ¥12,156 | +1.4% | 952 |
| Tokyo | 10 | 1,757 | ¥12,642 | -4.8% | 1,136 |
| Chiba | 1 | 1,000 | ¥9,305 | -4.2% | 420 |
| Kanagawa | 3 | 890 | ¥12,784 | -7.9% | 576 |
| Okayama | 2 | 490 | ¥8,073 | -2.4% | 186 |
| Tochigi | 1 | 300 | ¥9,629 | -6.6% | 403 |
| Osaka | 1 | 220 | ¥8,761 | -30.7% | 647 |
| Aichi | 1 | 170 | ¥8,185 | -3.3% | 507 |
| Kyoto | 1 | 135 | ¥12,161 | -12.8% | 604 |
| Hyogo | 1 | 70 | ¥12,027 | -3.0% | 545 |
| Total | 27 | 6,883 | — | — | — |
Source: MetroEngines Research & Consulting (estimated settled ADR, confirmed month July 2026) / MLIT “Building Dynamics Statistics Survey” (our construction-plan data, 50+ rooms, N=70 projects, extracted 1 September 2026)
Source: MetroEngines Research & Consulting / MLIT “Building Dynamics Statistics Survey” (our construction-plan data, 50+ rooms, N=70 projects, extracted 1 September 2026)
Hokkaido has the most rooms at 1,851 (6 projects), followed by Tokyo at 1,757 (10 projects) and Chiba at 1,000 (1 project). The single Chiba project is a 1,000-room mixed-use development at Kaihin-Makuhari, for which we have examined absorption capacity separately. Estimated settled ADR for the confirmed month of July 2026 runs at ¥12,200 in Hokkaido (+1.4% YoY, N=952 properties), ¥12,600 in Tokyo (−4.8%, N=1,136 properties) and ¥12,800 in Kanagawa (−7.9%, N=576 properties). (Body text is rounded to the nearest ¥100; the table shows measured values.) Osaka’s −30.7% reflects the special factor of the post-Expo year and is covered in detail in a separate article, so it should not be read on the same footing as the other prefectures.
What this means, read by attribute and by role
For operators chasing management contracts, the structure of the target list becomes clear. Of projects with 50 rooms or more, only 27.1% are ordered by hotel companies; the other 72.9% form a pool that may need to look outside for an operator. The 27 mixed-use, non-hotel-ordered projects with 6,883 rooms are particularly relevant: hotel was chosen as a use for the floor space, and there is room to make contact before the operating model has fully hardened. The longer the build period, the longer the lead time available for working backwards into a deal.
For investors reading the pipeline, owner attribute becomes a variable that explains the dispersion in delivery timing. Standalone projects from real estate developers have a median build period of 2.06 years, making completion timing easier to forecast. Projects from redevelopment implementation bodies run to 5.58 years, and the consensus-building period before groundbreaking is not even in the data. Two projects both “scheduled for 2028 completion” can carry very different qualities of certainty.
For landowners and associations placing a hotel into redevelopment floor space, the data confirms that they are in the minority. Implementation bodies appear as the client in only 5 of the 70 projects — but all 5 are mixed-use, and the typical room count is not small at 197 (median). The decision to use floor space for a hotel depends both on local rate levels and on operators’ appetite for the contract. The prefecture table above is the minimum material for checking the first of those.
One exit for rooms built this way is acquisition by a listed hotel REIT. Our ownership master records 302 properties held by Japan’s seven listed hotel REITs (snapshot as of 31 August 2026). Whether the plans covered here end up there is unknowable at this point, but the division of labour — one party owns the floor space and develops it, another operates it, and ownership passes to a third — already exists at meaningful scale.
Limits of the data
These figures come with the following constraints. First, because the data is on a building-confirmation-application basis, later years structurally show fewer projects. Figures for 2028 onward are lower bounds and will rise as further applications are filed. Second, owner attribute is a keyword judgment on the building owner name string and does not reflect a company’s actual business mix. For joint ventures, the project is assigned to whichever attribute matches first in the priority order, so some projects in reality involve multiple attributes. Third, the scheduled opening date is blank for all 70 extracted projects, so opening timing can only be inferred from scheduled completion. Fourth, this classification shows a breakdown by attribute; it is not a ranking or a judgment of company quality.
Even so, counting “who is placing the order” against a population of 70 projects on a consistent basis is worth doing. Supply discussions tend to gravitate to room counts and timing, but the division of labour — who orders the rooms and who operates them — shapes the character of the market just as much as the room count does.
Related reading
- Measuring Hotel Build Times — 2.80 Years from Groundbreaking to Completion Across 67 Plans, and What Separates 1.96-Year Standalone from 4.00-Year Mixed-Use
- A 1,000-Room, ¥30bn Mixed-Use Development at Kaihin-Makuhari — Absorption Capacity for Chiba’s Largest Pipeline Project
- Hotel Construction Contractor Ranking 2026 — Daiwa House at 99 Projects, Contractor Undecided in 55%
- Hotel Conversion at 6 of 14 Department-Store Sites — Required ADR Runs 1.4 to 3.1x the Market Median
- 1,242 Openings and 33,749 Rooms in 2026 — 47% of Properties Are Rental Villas, 42% of Rooms Are Business Hotels
- Tokyo 23-Ward Hotel Supply Pressure 2026 — Arakawa at 16.0% of Existing Stock, Minato Leads on Rooms but Only 4.5%
- Does New Hotel Supply Push ADR Down? Testing All 47 Prefectures — It Only Bites Below 13,000 Rooms
References and Sources
■ Data sources
From plan information on a building-confirmation-application basis, based on the MLIT “Building Dynamics Statistics Survey,” we took as our population the 70 projects that list hotel among their principal uses and have 50 rooms or more (extracted 1 September 2026; 15,517 rooms in total). Rate levels use estimated settled ADR derived from OTA published prices we collect (confirmed month July 2026, prefecture-level medians), and REIT ownership uses our ownership master (7 investment corporations, 302 properties, snapshot as of 31 August 2026).
■ Calculation assumptions
Owner attribute is a keyword judgment on the building owner (client) name string, counted once per project under whichever attribute matches first in the priority order: (1) redevelopment implementation body, (2) hotel or lodging operator, (3) railway or transport operator, (4) real estate developer, (5) other operating company / unknown. Standalone means hotel is the only principal use recorded; mixed-use means a non-hotel use is listed alongside. The construction period is days from groundbreaking to scheduled completion divided by 365.25, calculated only for the 59 projects with a recorded groundbreaking date. All medians are on a project-count basis.
■ Limitations and caveats
Because the data is on a building-confirmation-application basis, later years structurally show fewer projects; figures for 2028 onward are lower bounds and will rise as further applications are filed. Owner attribute is a string-based judgment that does not reflect a company’s actual business mix, and joint ventures are assigned to whichever attribute matches first in the priority order. The scheduled opening date is blank for all 70 extracted projects, so opening timing remains an inference from scheduled completion. Estimated settled ADR is an estimate and differs from each property’s actual transacted rates and accounting figures. This classification shows a breakdown by attribute and is not a ranking or a judgment of company quality.
■ Construction-plan data
- MLIT “Building Dynamics Statistics Survey (Construction Starts Statistics Survey / Building Demolition Statistics Survey)” — plan information on a building-confirmation-application basis. This article uses 50+ rooms, N=70 projects (extracted 1 September 2026)
■ Market data
- MetroEngines Research & Consulting — estimated settled ADR (confirmed month July 2026, prefecture-level medians); REIT ownership master (302 properties, snapshot as of 31 August 2026)
■ Related published analysis