

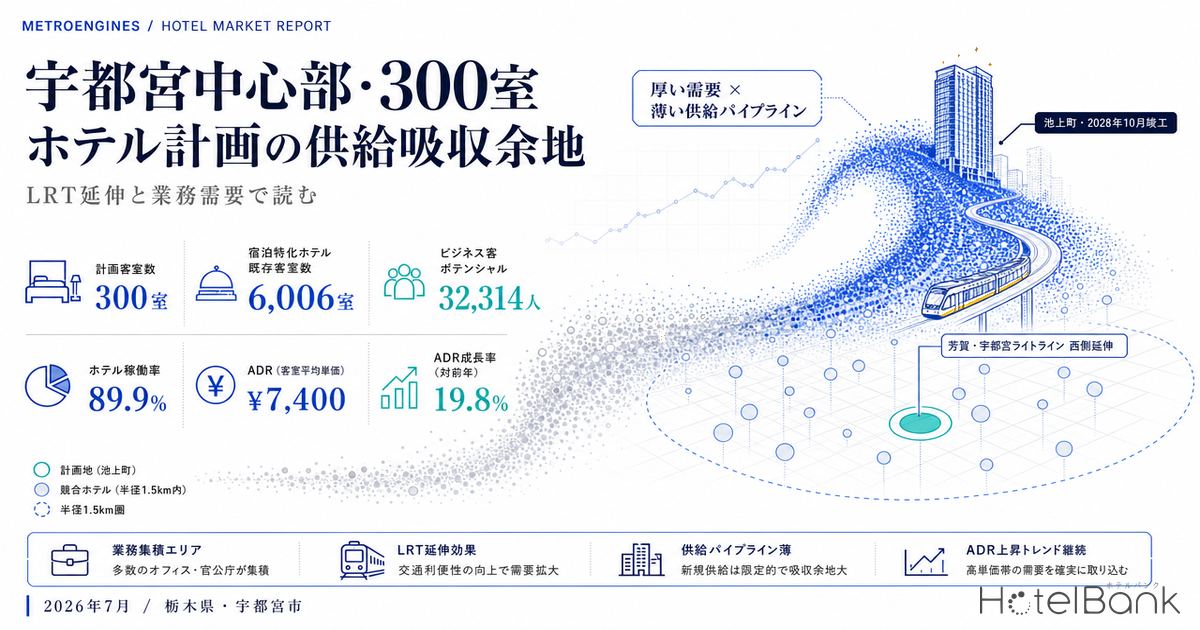
In the heart of Utsunomiya, the capital city of Tochigi Prefecture, a large hotel of 14 storeys above ground, 50m in height and more than 300 rooms has begun moving toward completion in October 2028. The project is being carried out by the Ikegami-cho District Superior Building Development Association (池上町地区優良建築物等整備事業組合). It also overlaps with an infrastructure catalyst: the westward extension of the LRT (Haga-Utsunomiya Light Line), Japan’s first entirely newly built light rail line. This article quantifies the impact of these 300 rooms on downtown supply and demand from four angles — employment density, estimated settled ADR, estimated occupancy (OCC) and the supply pipeline — and reads the absorption capacity for regional investors, local financial institutions and business hotel chains.
Metric Definitions Used in This Article
- ADR (average daily rate): An estimated settled rate (tax-excluded equivalent) calculated by applying category-specific adjustment coefficients to the lowest published plan rate each property lists on OTAs and other channels (double occupancy, per-room rate, tax included). Cross-checked against property-level actuals disclosed by listed hotel REITs (91 properties, most recent three months), the median error is approximately 7%. These are estimates and differ from each property’s actual transaction prices and accounting figures. Area-level ADR is the median of the target properties (the level of a typical property in the area).
- OCC (occupancy rate): The share of sold rooms against total room supply in the area (an estimate based on OTA sales inventory). Used only for macro aggregation at the prefecture and municipality level; occupancy for individual properties is not calculated.
- Data sources: MetroEngines Research & Consulting, Ministry of Land, Infrastructure, Transport and Tourism (MLIT), Economic Census for Business Activity (Ministry of Internal Affairs and Communications / Ministry of Economy, Trade and Industry), City of Utsunomiya.
- — The 300 rooms in Ikegami-cho represent a +5.0% supply increase against the existing 6,006 downtown rooms, but completion is more than two years away in October 2028, and demand growth over that period supports absorption.
- — Business demand supported by 32,314 workers within 1km of the station (19.8% in office sectors) keeps estimated occupancy for the business hotel category at a high 89.9% (as of June 2026).
- — This is the only 100+ room plan under building confirmation application in the prefecture. Rising construction costs (total floor area estimated at roughly ¥9.0 billion) structurally suppress new entry and keep the pipeline thin.
- — Utsunomiya’s estimated settled ADR averages roughly ¥7,400 over the past 12 months (+3.8% year on year). Against strong occupancy, rate still has headroom.
- — The vacant “large-scale × upper price band” quadrant (240–320 rooms × ¥10,000–13,500, currently occupied by Candeo alone) is the least contested target for a 300-room class property.
Conclusion — Demand is deep, the pipeline is thin. The 300 rooms are an addition the market can absorb
Let us start with the conclusion. Downtown Utsunomiya combines deep business demand (32,000 workers within 1km of the station) with a thin supply pipeline (this Ikegami-cho project is the only 100+ room plan in the prefecture at the building confirmation stage), and can be considered a market with room to absorb an additional 300 keys. That is a +5.0% supply increase against the existing 6,006 downtown rooms, but completion is more than two years away in October 2028, and demand growth in the meantime — driven by the Network-type Compact City (NCC) strategy centred on the westward LRT extension, and by the regional dispersion of inbound travel — supports absorption.
Looking at the numbers behind supply and demand: estimated occupancy for the business hotel category in Tochigi Prefecture was 89.9% in June 2026, a month outside the peak season, and 88.4% for city hotels — high levels even on a weekday basis. Meanwhile, Utsunomiya’s estimated settled ADR averaged roughly ¥7,400 over the past 12 months (+3.8% year on year), leaving headroom in rate relative to the strength of occupancy. In other words, “volume” is close to tight while “rate” retains upside, and a large new property able to target the upper price band can take a position that does not compete head-on with the existing market.
Market trends — Utsunomiya’s estimated settled ADR is on a gradual uptrend, occupancy stays high
First, the rate trajectory. Tracking Utsunomiya’s estimated settled ADR across all categories on a monthly basis shows a gentle upward slope from the second half of 2024 into the first half of 2026. The most recent actual month (May 2026) came in at roughly ¥8,200, an annual peak driven by seasonal factors including the Golden Week holidays. Smoothing out seasonality, the trailing 12-month average is roughly ¥7,400, up 3.8% year on year.
On the occupancy side, our estimated occupancy (based on OTA-listed inventory) shows clear differences between categories. As of June 2026: business hotels 89.9%, city hotels 88.4%, resorts 85.8%, ryokan 83.9%. Demand in the prefectural capital is clearly led by the business and city hotel categories, consistent with the employment structure discussed below. In May (the Golden Week period) every category jumped to around 98%, meaning that at peak the downtown area is effectively close to sold out.
| Category | Properties | Rooms | Est. OCC (Jun) | Est. settled ADR (Jun) |
|---|---|---|---|---|
| Business hotels | 115 | 10,093 | 89.9% | ¥6,300 |
| City hotels | 14 | 1,487 | 88.4% | ¥7,100 |
| Resorts | 35 | 2,346 | 85.8% | ¥14,000 |
| Ryokan | 169 | 6,569 | 83.9% | ¥20,600 |
| All properties | 554 | 22,731 | 87.5% | — |
Location analysis — the prefecture’s highest commercial land prices and a “business gateway” downtown of 32,000 workers
The Ikegami-cho redevelopment building sits in the central commercial district spreading west of JR Utsunomiya Station (close to Orion-dori and Baba-dori). According to the City of Utsunomiya’s building plan documents, it is a reinforced concrete structure of 14 storeys above ground and one basement level, with total floor area of roughly 13,000 sqm (building footprint approximately 1,000 sqm) and 72 tower parking spaces on both sides. The layout places the hotel front desk and restaurants on the first floor, more than 300 guest rooms on floors 2 to 14, and machine rooms in the basement. Demolition was scheduled for April 2025 and main construction for April 2026, with the 50m building slated for completion in October 2028.
It is worth pinning down the character of the location in numbers. Within 1km of the station there are 2,421 establishments and 32,314 workers, of whom 19.8% work in office sectors (information and communications, finance, professional services and the like). By contrast, the resident population within a 1.5km radius of downtown stood at 36,671 in 2025 (60.9% of working age), and is projected to decline 11.6% by 2040. This is a “business gateway” prefectural capital where the daytime working population exceeds the night-time resident population, a structure that tilts accommodation demand heavily toward business travel, assignments and client meetings. The high occupancy of the business hotel category (89.9%) is the flip side of that employment base.
Coverage of the employment data is solid (45 small districts and 2,421 establishments captured within 1km of the station), corroborating the depth of business demand. The contrast between a thin resident population and a thick working population indicates that operations weighted toward weekday business rather than weekend leisure are more likely to work in the city centre.
Infrastructure catalyst — the westward LRT extension reshapes movement through the city centre
No discussion of Utsunomiya’s urban structure can omit the Haga-Utsunomiya LRT (Light Line), which opened in 2023. It opened first on the eastern section (approximately 14.6km) running from the east exit of JR Utsunomiya Station to the Haga-Takanezawa industrial park, and drew national attention from regional cities by posting a net profit in its first year. The next focus is the westward extension from the station.
According to the City of Utsunomiya’s project documents, the westward extension covers approximately 5km from the Utsunomiya Station East Exit stop to the vicinity of the Prefectural Education Hall, with the LRT track elevated to cross the second floor of the station building (between the conventional lines on the first floor and the Shinkansen on the third). The target opening is March 2036, with estimated construction costs of ¥69.8 billion excluding tax (approximately ¥77.0 billion including tax). A reorganisation is also envisaged that would cut bus routes on the main avenue by roughly 30% and redeploy vehicles and drivers to trunk and circular bus services.
The key point here is that the Ikegami-cho site sits squarely within the city centre that this westward extension will run through. Utsunomiya’s Network-type Compact City (NCC) concept aims to concentrate living, commercial and community functions around LRT and bus interchanges, and the central district is its core hub. The extension will not open until 2036, but the direction of travel — hub development and improved circulation — is a medium- to long-term tailwind for accommodation on the axis connecting the station and the city centre. The very fact that a 300-room hotel is being planned downtown can be read as private investment responding to that direction.
Competitive landscape — major chains are heavily deployed, 200-room class clusters around the station
Within a 1.5km radius of downtown there are 69 properties and 6,006 rooms. The line-up includes Toyoko Inn, Candeo, Daiwa Roynet, Richmond, APA, JR East Hotel Mets, and 2020s entrants such as Four Points Flex by Sheraton and The Knot — a dense deployment of national-scale chains with proven track records. That is evidence that Utsunomiya’s business demand has been judged “a market worth continued chain investment,” and underwrites its ability to fill rooms.
| Property (largest by scale) | Rooms | Est. settled ADR | Review tendency |
|---|---|---|---|
| Toyoko Inn Utsunomiya Ekimae 1 (東横INN宇都宮駅前1) | 354 | ¥7,500 | Steady station-front standard |
| Four Points Flex by Sheraton (フォーポイント フレックス by シェラトン) | 323 | ¥7,800 | Recent opening, international brand |
| Hotel New Itaya (ホテルニューイタヤ) | 299 | ¥7,300 | Long-established large local hotel |
| Candeo Hotels Utsunomiya (カンデオホテルズ宇都宮) | 288 | ¥13,000 | Upper price band, top-floor public bath |
| Daiwa Roynet Hotel Utsunomiya (ダイワロイネットホテル宇都宮) | 223 | ¥10,600 | Well rated, upper-midscale |
| Richmond Hotel Utsunomiya Ekimae (リッチモンド宇都宮駅前) | 221 | ¥10,000 | High review scores |
| JR East Hotel Mets Utsunomiya (JR東日本ホテルメッツ宇都宮) | 158 | ¥11,600 | Direct station access |
Looking at the price structure, most large properties such as the Toyoko Inn hotels and New Itaya sit in the ¥7,000–8,000 volume zone, while the upper price band — Candeo (¥13,000), Mets (¥11,600), Richmond Annex (¥11,200), Daiwa Roynet (¥10,600) — is concentrated among mid-sized properties. The “large-scale and upper price band” quadrant is currently occupied almost single-handedly by Candeo (288 rooms). This structure defines the opening for the 300 rooms at Ikegami-cho, as the positioning analysis below shows.
Positioning analysis — a gap in “large-scale × upper price band,” the quadrant 300 rooms can target
We mapped the major downtown properties with room count on the horizontal axis and estimated settled ADR on the vertical axis. Circle size is proportional to room count.
Two structures emerge from the map. First, properties cluster densely in the ¥6,000–8,500 × 150–360 room band (the volume cluster). This is a battleground where national limited-service chains compete, and it is not easy for a newcomer to win on differentiation. Second, the “large-scale × upper price band” quadrant of 240–320 rooms × ¥10,000–13,500 is almost empty, with only Candeo present. Given the high occupancy underpinned by business demand and the headroom remaining in rate, this quadrant (WS①) is the least contested target for a new 300-room class property.
Dense Volume band
¥6,000–8,500 × 150–360 rooms
Concentration of national limited-service chains. Price competition is fierce and differentiation is difficult for new entrants.
WS① Large-scale × upper price band
¥10,000–13,500 × 240–320 rooms
Currently held by Candeo alone. High occupancy and rate headroom overlap here, with low competitive density.
Secondary Small-scale × mid price
¥8,000–9,500 × 80–120 rooms
Smile, MyStays and others are scattered here. Improved circulation leaves room for downtown locations to gain value.
Absorption estimate — how far demand growth can take a +5.0% supply increase
Adding 300 rooms downtown (against the existing 6,006) increases supply by 5.0%. Against the prefecture’s total business plus city hotel room count (approximately 11,580 rooms) it is +2.6%. Completion is more than two years away in October 2028, and demand over that period will determine whether absorption succeeds. Here we mechanically estimate how downtown estimated occupancy would change after the added supply, under three growth scenarios for accommodation demand (room-nights) up to completion. The starting assumption is the current downtown estimated occupancy of 89% (estimate, as of June 2026, business hotel category basis).
| Demand growth scenario to 2028 | Assumption (room-nights) | Est. OCC after supply | Assessment |
|---|---|---|---|
| A. Conservative (demand flat) | ±0% | approx. 85% | Comfortably healthy |
| B. Base (+2.5% per year) | +8% | approx. 89% | Maintains current level |
| C. Bullish (LRT and inbound contribution) | +15% | approx. 94% | Tight, upward pressure on rate |
Even with demand flat, estimated occupancy after the added supply holds at roughly 85%, still a healthy level. Factoring in +2.5% per year (mild growth consistent with Utsunomiya’s historical ADR increases) would maintain the current 89%. In terms of “volume,” the 300 rooms are within absorbable range. Moreover, a product targeting the upper price band (WS①) is less likely to fight existing volume-band properties for the same guests, and works to lift market-wide RevPAR. RevPAR for the business hotel category is currently approximately ¥5,700 (estimated ADR of about ¥6,300 × occupancy of 89.9%); at ¥11,000 with 80% occupancy it would be roughly ¥8,800, making such a property a force that raises the average revenue level downtown. The broader question of how much new supply regional core cities can absorb is analysed across eight cities nationwide in Supply Absorption Capacity in 8 Regional Core Cities.
Why supply is thin — rising construction costs suppress new entry
Behind the “thin pipeline” — this Ikegami-cho project being the only 100+ room plan in the prefecture at the building confirmation stage — lies the rise in construction costs. As a reference, estimating total floor area of roughly 13,000 sqm (approximately 3,932 tsubo) at new-build equivalent gives the following.
| Estimation step | RC unit cost per tsubo | Estimate for 3,932 tsubo |
|---|---|---|
| 1. Based on 2025 actuals | approx. ¥2.026M | approx. ¥8.0bn |
| 2. Including construction-period inflation (2028 completion) | approx. ¥2.29M | approx. ¥9.0bn |
Even at 2025 actual unit costs the figure is roughly ¥8.0bn, and factoring in construction inflation through completion swells it to around ¥9.0bn. This level of construction cost raises the profitability hurdle for new hotel development in regional cities and, as a result, structurally suppresses new supply entering the market. Conversely, the very fact that supply is unlikely to grow underpins the occupancy and rates of both existing and new properties, making it easier to sustain downtown Utsunomiya’s environment of high occupancy and a thin pipeline. How far construction cost inflation will thin new supply in 2027–2029 is discussed with a nationwide map in Construction +41% & Labor Crunch Erase Japan’s 2027-2029 Hotel Supply.
Investment summary — the trio of deep demand, thin supply and rate headroom
For regional investors, local financial institutions and business hotel chains, downtown Utsunomiya can be summarised as a market with absorption capacity on three counts. First, deep business demand underpinned by an employment base of 32,000 workers within 1km of the station (business hotel occupancy of 89.9%). Second, a thin supply pipeline in which this Ikegami-cho project is the only 100+ room plan under building confirmation application in the prefecture. Third, headroom in rate, with estimated settled ADR still in the ¥7,000s despite high occupancy. This trio is the basis for assessing the additional 300 rooms not as “oversupply” but as “an addition the market can absorb.”
From a positioning perspective, targeting the vacant “large-scale × upper price band” quadrant (WS①) rather than the fiercely contested volume band (¥6,000–8,500) makes it easier to take a position that does not compete directly with existing properties. Improved circulation in the city centre from the westward LRT extension and the NCC strategy, while still distant with a 2036 opening, functions as a direction that deepens the medium- to long-term demand base.
| Factor | Level |
|---|---|
| Tightness of business demand | Low risk (high occupancy) |
| Supply pipeline | Low risk (thin) |
| Construction cost inflation | High (squeezes returns) |
| Population decline (long term) | Medium (−11.6% by 2040) |
| Timing of the LRT extension | Medium (2036, long term) |
| Assumption | ADR ¥11,000 | ADR ¥9,900 (−10%) |
|---|---|---|
| 80% occupancy | approx. ¥960M | approx. ¥870M |
| 75% occupancy (−5pt) | approx. ¥900M | approx. ¥810M |
Construction cost inflation is the biggest headwind, but it is at the same time a brake on new supply, working to tighten the balance in the existing market. Long-term population decline and the distance of the LRT extension are factors to price in, but the demand structure of a “business gateway” prefectural capital supports accommodation demand for the time being. On the whole, the 300 rooms in downtown Utsunomiya can be assessed as additional supply with absorption capacity on all three counts — demand, supply and price.
⚠ Note on forward-dated ADR and supply data: Estimated settled ADR for July 2026 onward in this article is an estimate based on selling prices published on OTAs at the time of the survey, and will fluctuate as check-in dates approach. The supply pipeline (hotels in planning) is based on building confirmation applications at the time of the survey, and the count is expected to increase as further applications are filed. Please treat it as a lower bound of the currently confirmed pipeline.
Related reading
- Supply Absorption Capacity in 8 Regional Core Cities — GW2026 Sellout Rate × New Openings Map
- Construction +41% & Labor Crunch Erase Japan’s 2027-2029 Hotel Supply
- Sendai Hotel Supply Pipeline: ¥40k+ White Space & New-Entry Case
- Hotel Investment in Japan’s “Second-Tier” Cities: ADR, Supply & Yield Across 5 Markets
References and sources
■ Data sources
Estimated settled ADR and estimated occupancy (OCC) are estimates calculated by MetroEngines Research & Consulting from OTA published prices and sales inventory (Utsunomiya N=48–50 properties; Tochigi business hotels N=131–140 / city hotels N=13–15). Employment, land price and population figures are based on the Economic Census for Business Activity (2021), MLIT Published Land Prices and the National Land Numerical Information; the supply pipeline is based on the Building Dynamics Statistics Survey.
■ Estimation assumptions
Supply absorption is mechanically estimated from the current downtown estimated occupancy of 89% (business hotel category basis) under three growth cases for room-nights to completion in 2028 — ±0% / +8% / +15% (post-supply OCC = current occupancy × existing rooms ÷ (existing + 300 rooms) × demand growth rate). Construction costs apply Turner & Townsend inflation forecasts compounded onto 2025 RC unit costs per tsubo. The sensitivity analysis is a rough rooms revenue of 300 rooms × ADR × occupancy × 365 days.
■ Limitations and caveats
ADR and OCC are OTA inventory-based estimates and differ from each property’s actual accounting figures and actual occupancy. Area ADR is the median of the target properties. Post-supply OCC is a simplified figure that abstracts away season, day of week and pricing strategy, and excludes ancillary revenue, costs and land expenses. An actual investment decision requires a detailed feasibility study.
■ Market data
- MetroEngines Research & Consulting — estimated settled ADR (Utsunomiya N=48–50 properties; Tochigi business hotels N=131–140 / city hotels N=13–15), estimated occupancy, supply pipeline, distribution of competing properties
■ Government statistics and public data
- City of Utsunomiya, “Published Land Prices Announced” (2025 Published Land Prices)
- Ministry of Internal Affairs and Communications / Ministry of Economy, Trade and Industry, “Economic Census for Business Activity (2021),” small-area tabulation
- MLIT National Land Numerical Information (250m mesh future population projections, 2024 NIPSSR-based estimates)
- MLIT “Building Dynamics Statistics Survey” (hotel pipeline in planning) / “Statistics on Building Construction Starts” (RC unit cost per tsubo)
■ Project and infrastructure documents
- City of Utsunomiya, “Efforts toward realising East-West trunk public transport (LRT)”
- Light Line official portal, “Westward extension from the station”
- City of Utsunomiya, “Network-type Compact City (NCC)”
- Nihon Kogyo Keizai Shimbun, “Redevelopment building in Ikegami-cho, Utsunomiya: 50m hotel to break ground in spring 2026”
- Nikkei, “Utsunomiya LRT westward extension to open in March 2036”