

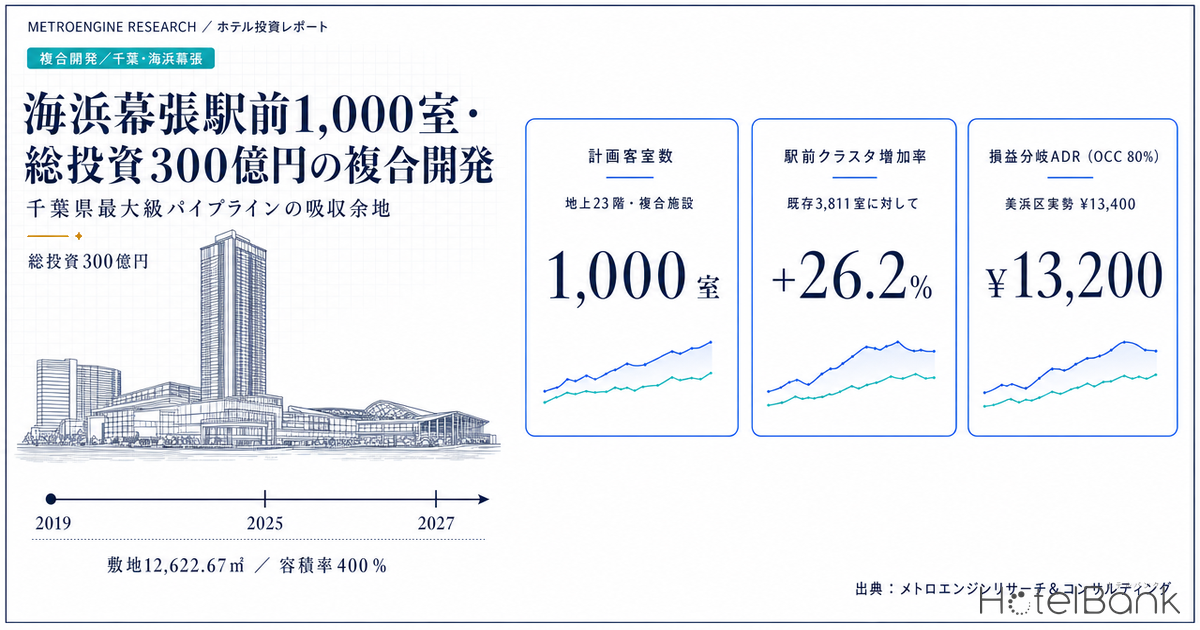
A 23-story mixed-use complex combining an approximately 1,000-room hotel with a cinema, restaurants and a bathing facility is moving forward on a lot directly in front of JR Kaihin-Makuhari Station. The developer is Royal Lease Co., Ltd. (ロイヤルリース株式会社), with total investment reported at roughly ¥30 billion. As a standalone hotel development it ranks among the largest in Chiba, and a single building would equal 2.0% of the prefecture’s tracked room stock — or, within the Kaihin-Makuhari station-front cluster alone, 26.2% of existing guestrooms.
This article breaks down the business structure of this single project quantitatively: the product range implied by the site’s zoning constraints, the investment range once 2025 construction costs are factored in, and the viability conditions derived from actual ADR levels in Mihama Ward. Rather than a tiered comparison of five areas across the prefecture, we focus narrowly on the assumptions under which one large project can be absorbed.
Metric Definitions Used in This Article
- ADR (average daily rate) = estimated settled rate (tax-exclusive equivalent), calculated by applying category-specific adjustment coefficients to the lowest publicly listed plan rate on OTAs and similar channels (double occupancy, per-room rate, tax-inclusive). Cross-checked against property-level results disclosed by listed hotel REITs (91 properties, most recent three months), the median error is approximately 7%. These are estimates and differ from each property’s actual transacted prices or accounting figures. Area-level ADR is the median of the target properties (the level of a typical property in that area).
- Listed price, where referenced, is the all-plan average (from room-only through meal-inclusive), double occupancy, per-room rate (tax-inclusive).
- OCC (occupancy rate) = the share of sold rooms against total rooms in the area (an estimate based on OTA sales inventory). In this article it is used solely as an assumption input for the business case.
- Data sources: MetroEngines Research & Consulting / MLIT Real Estate Information Library / MLIT National Land Numerical Information / Ministry of Internal Affairs and Communications & METI Economic Census
- — Against an investment of ¥25.66 billion, or ¥25.7 million per room (2025 actual RC construction cost of ¥2.026 million per tsubo), the breakeven ADR for a 6% yield is ¥13,200 at 80% OCC (a modeling assumption). That is already 1.5% below Mihama Ward’s prevailing ¥13,400.
- — A 400% floor area ratio on a 12,622.67 m² site yields a permitted gross floor area of 50,491 m². Assigning 70% of that to guestroom floors gives roughly 35.3 m² gross per room — the site conditions themselves dictate a compact-room product.
- — The 1,000 rooms represent +26.2% on top of the station-front cluster’s existing 3,811 rooms, 2.0% of Chiba Prefecture’s tracked stock of 49,169 rooms, and 6.3% of the city hotel segment. As a single project, it is an outlier in the prefecture in terms of magnitude of change.
- — The 292,000 room-nights per year required at 80% OCC (a modeling assumption) equate to roughly a 28% increase in demand across the cluster. The sources are three-layered: MICE (Tokyo Game Show 2025 drew 263,101 visitors over four days), a business cluster of 52,086 workers within 1 km, and cross-selling within the mixed-use complex.
- — On a two-axis ADR × OCC grid (25 cells), 21 cells clear a 6% yield. Because ADR is capped by the market ceiling while OCC can plausibly range from 72% to 88%, the swing variable sits on the occupancy side.
Executive Summary — A single building lifts the station-front cluster by +26%, and viability turns on building occupancy
Start with the conclusion: what determines whether this project works is not price but the build-up of occupancy. Mihama Ward’s estimated settled ADR is ¥13,400 over the most recent 11 confirmed months (N=12 properties). Meanwhile, the gross floor area per room implied by the site’s 400% floor area ratio is roughly 35 m² — corresponding to a compact-room product in the business/midscale band. Structurally, then, this project sits on the extension of Mihama Ward’s current price band, and recovering the investment through high rates is difficult to assume.
Costing the guestroom floors at 2025 construction levels (RC structure, ¥2.026 million per tsubo) gives an investment of roughly ¥25.7 billion including the land allocation, or about ¥25.7 million per room. Applying the standard scenario (ADR ¥15,500 / OCC 82% / GOP margin 40% — all modeling assumptions anchored on Mihama Ward’s prevailing levels as of August 2026 and on disclosed results from listed REITs, not measured occupancy at this property) yields a return of 7.2%, and the breakeven ADR securing a 6% yield is roughly ¥13,200 at 80% OCC — almost exactly Mihama Ward’s current level. Price is already within the viable range, and the question shifts to where the room-nights for 1,000 rooms will come from. Assuming station-front cluster demand continues at its current trajectory, roughly a 28% increase in demand would be newly required across the cluster.
This article posits three variables as the sources of that demand. First, MICE and large-event demand centered on Makuhari Messe; second, a business cluster of 52,086 workers within 1 km; and third, cross-selling with the bathing facility and cinema as part of the mixed-use complex. The third in particular offers a revenue layer that a standalone hotel does not have, with room to lift effective RevPAR.
Outline of the Plan — Reconfirming the 2019 long-term scheme against building-plan data
The framework of this project was announced in March 2019. The Chiba Prefecture Enterprise Land Management Bureau sold prefectural land in the Makuhari New City Town Center district (8 Hibino 1-chome, Mihama Ward, Chiba City / site area 12,622.67 m²), and Royal Lease Co., Ltd. acquired it. The sale price was ¥5.72 billion, equivalent to roughly ¥453,000 per m².
The originally announced scheme had two phases. In Phase 1, through 2024, the existing commercial facility “Messe Amuse Mall” would continue operating with partially renovated exterior and interior, centered on a cinema and restaurants. In Phase 2, redevelopment would begin from 2025 onward, with the new facility opening in the second half of 2027 — a long-horizon structure.
Building-plan data held by MetroEngines Research & Consulting (based on MLIT’s Construction Dynamics Statistics Survey) likewise confirms a registration at the same location for 1,000 guestrooms, 23 stories above ground, principal uses “hotel, cinema, restaurants, bathing facility,” developer Royal Lease Co., Ltd., construction start January 2025, scheduled completion December 2027. The published reports and the building plan are consistent.
| Item | Details | Source |
|---|---|---|
| Location | 8 Hibino 1-chome, Mihama Ward, Chiba City (in front of Kaihin-Makuhari Station, JR Keiyo Line) | Prefectural disclosure / building plan |
| Site area | 12,622.67 m² | Prefectural disclosure |
| Sale price | ¥5.72 billion (approx. ¥453,000/m²) | Prefectural disclosure |
| Acquisition date | March 27, 2019 | Press reports |
| Scale | 23 stories above ground / approx. 1,000 guestrooms | Press reports / building plan |
| Principal uses | Hotel, cinema, restaurants, bathing facility | Building plan |
| Developer | Royal Lease Co., Ltd. | Prefectural disclosure / building plan |
| Total investment | Approx. ¥30 billion (press-reported, as of 2019) | Press reports |
| Construction period | Start January 2025 — scheduled completion December 2027 (opening in H2 2027) | Building plan / press reports |
A note on timing and specifications: This is a long-horizon scheme announced in 2019 for a 2027 opening, and the room count, opening date, use mix and developer structure may change. As of our research date, information indicating the existing facility is still operating was confirmed, and no specific progress on demolition or groundbreaking has been disclosed. Because the schedule could also be revised in light of changes in construction costs and the materials procurement environment, all estimates below should be read as conditional calculations premised on the disclosed and registered specifications. The approximately ¥30 billion total investment is a press-reported figure from 2019, not an official disclosure by the developer.
Location Analysis — Commercial zoning, 400% FAR, and station-front land prices up 48.3% in seven years
The site is designated a commercial zone, with a specified floor area ratio of 400% and a building coverage ratio of 80%. Kaihin-Makuhari Station on the JR Keiyo Line handled an average of 56,995 boarding passengers per day (FY2024), ranking 70th within JR East’s network and third among the Keiyo Line’s intermediate stations after Shin-Kiba. Among stations served by a single line with no transfers to other operators, it is the busiest in Chiba Prefecture.
| Use district | Commercial zone |
| FAR / building coverage | 400% / 80% |
| Site area | 12,622.67 m² |
| Permitted gross floor area (max) | approx. 50,491 m² |
| Location optimization plan | Urban function induction area |
| Establishments | 1,199 |
| Employees | 52,086 |
| Office-sector share | 35.4% |
| 2025 | 44,306 |
| 2040 (projected) | 44,555 (+0.6% vs. 2025) |
| Working-age share | 71.1% |
Land prices are clearly in an upswing. The published land price for the standard site nearest the station (4 Hibino 2-chome, Mihama Ward / commercial land / 400% FAR / 0 m from the station) rose from ¥472,000/m² in 2019 to ¥700,000/m² in 2026, up 48.3% over seven years. Since 2024 in particular, near-double-digit growth has continued for three straight years at +7.6% → +11.9% → +10.8% YoY.
For the developer, this land price appreciation shows up as a gap against acquisition cost. The 2019 sale price was roughly ¥453,000 per m², slightly below the then-current published price of ¥472,000/m² for the station-front standard site. Applying the 2026 published price of ¥700,000/m² to the same site area gives roughly ¥8.8 billion, a difference of about ¥3.1 billion against the ¥5.72 billion acquisition price. Unrealized gains on the land have accumulated before construction even begins, and this functions as a safety margin for the project as a whole.
Looking at the population distribution, mesh cells with high population density run along the north and east sides of the station, while the business and exhibition district south of the station has thin resident population. Unusually for a Tokyo metropolitan suburb, the projected population within 1.5 km is set to move sideways, from 44,306 in 2025 to 44,555 in 2040 (+0.6%), and the working-age share is high at 71.1%. For a project assuming more than 20 years of ownership from a 2027 opening, the risk of catchment-area population decline eroding revenue is relatively small — that is the distinguishing feature of this location. The use mix of restaurants, bathing facility and cinema, which also captures local customers, is consistent with this demographic structure.
Supply Impact — 1,000 rooms is +26.2% for the station-front cluster and 2.0% of tracked prefectural stock
Within a 600 m radius of the site, eight lodging facilities totaling 3,811 rooms are clustered (excluding two training facilities with 315 rooms). Adding 1,000 rooms brings the cluster total to 4,811 rooms, an increase of 26.2%. For a single project, that is an exceptionally large swing.
| Property | Rooms | Distance from site | Est. settled ADR (Oct 2026) |
|---|---|---|---|
| APA Hotel & Resort Tokyo Bay Makuhari (アパホテル&リゾート〈東京ベイ幕張〉) | 2,007 | 129 m | ¥13,500 |
| Hotel New Otani Makuhari (ホテルニューオータニ幕張) | 418 | 554 m | ¥23,200 |
| KOKO HOTEL Premier Tokyo Bay Makuhari (KOKO HOTEL Premier 東京ベイ幕張) | 301 | 164 m | — (opened June 2026) |
| Hotel Springs Makuhari (ホテルスプリングス幕張) | 298 | 111 m | ¥15,000 |
| Hotel Shulanza MAKUHARI BAY (ホテルシュランザ MAKUHARI BAY) | 230 | 315 m | ¥14,400 |
| Hotel Francs (ホテルフランクス) | 222 | 420 m | ¥15,200 |
| Hotel Green Tower Makuhari (ホテルグリーンタワー幕張) | 205 | 391 m | ¥16,300 |
| Hotel The Manhattan (ホテル ザ・マンハッタン) | 130 | 410 m | ¥17,700 |
| (Planned) Hibino 1-chome mixed-use complex | 1,000 | — | — |
Widening the lens makes the significance of the scale even clearer. MetroEngines Research & Consulting confirms 736 operating lodging facilities with 49,169 rooms in Chiba Prefecture (as of August 2026). The 1,000 rooms amount to 2.0% of that. Limited to the city hotel segment (53 properties, 15,751 rooms), it is 6.3%. The largest new opening confirmed in the prefecture in 2026 was a 301-room property in Kaihin-Makuhari (June 2026); this project is 3.3 times that size. Where a single building of this size lands within the prefecture’s hierarchy is easier to place when read alongside our earlier comparison of the five areas of Urayasu, Narita, Makuhari, Kisarazu and Boso.
One caveat when discussing future supply: building-plan data is based on building-confirmation applications, which are usually filed one to two years before opening. Counts for 2028 and beyond therefore represent “the floor of the pipeline confirmed at present” and are likely to rise as further applications are filed.
Positioning — The product range implied by Mihama Ward’s ¥13,400, and the bands left open
To determine which price band 1,000 rooms will occupy, we work backward from Mihama Ward’s prevailing levels. The ward’s estimated settled ADR averages ¥13,400 over the most recent 11 confirmed months (August 2025 – June 2026) (N=12 properties, monthly range ¥11,200–¥15,700). Comparisons are made on a consistent basis. On the same basis (11-month confirmed average), Urayasu City is ¥24,600 (N=38–43 properties), about 1.8 times Mihama Ward, and Chuo Ward, Chiba City is ¥9,800 (N=34–45 properties). Switching to the forward-listing cross-section for October 2026 gives Mihama Ward ¥14,700 / Urayasu ¥25,500 / Chuo Ward ¥11,100 — levels rise across the board, but the ranking and the multiples among the three are unchanged. Mihama Ward sits mid-tier within the prefecture, in a stable price band supported by business and MICE demand.
Plotting room count against estimated settled ADR by property in the station-front cluster reveals the market structure. Among the eight existing properties, six are concentrated in the ¥13,000–¥18,000 band, with one property above at the ¥23,000 level. By room count, the 200–300-room band is the thickest, with a single 2,000-room-class property — a barbell structure.
Dense The thick band
¥13,000–¥18,000 × 130–420 rooms
The cluster’s main battleground. Six properties are concentrated here, functioning as the receptacle for MICE and business demand. New entrants need to differentiate on scale or function.
Range ① Large scale × mid price band
¥13,000–¥17,000 × 800–1,200 rooms
Given the roughly 35 m² gross per room dictated by the 400% FAR, this is the range the project fits most naturally. Only one existing property qualifies, leaving headroom as a receptacle for large-scale MICE.
Range ② Headroom in the upper-mid band
¥25,000–¥40,000 × 100–250 rooms
The cluster tops out at the ¥23,000 level. Setting aside part of the upper floors within the complex to leverage the bathing facility and high-floor views would create a two-tier structure with Range ① and an opportunity to lift the ADR mix.
Reverse-Engineering the Business Case — 35 m² gross per room dictated by 400% FAR, and a two-stage construction cost range
Applying the 400% specified FAR to the 12,622.67 m² site gives a permitted gross floor area of approximately 50,491 m² (15,273 tsubo). Delivering that floor area in a 23-story configuration implies an average floor plate of roughly 2,195 m², or a building footprint of just under 20% of the site. That is consistent with the typical mixed-use configuration of retail, bathing and cinema on the lower levels topped by a slender guestroom tower.
From here we estimate the guestroom floor area. Allocating 70% of the gross floor area to hotel use gives 35,343 m², which divided by 1,000 rooms comes to roughly 35.3 m² gross per room. Because that is gross including common areas and back-of-house, the effective private guestroom area lands broadly in the 22–25 m² band. This size band corresponds to a compact-room product — business/midscale specifications. In other words, the site conditions themselves place this project on the extension of Mihama Ward’s current price band rather than in the luxury tier. The reading in the previous section that Range ① is the project’s main battleground follows from this area calculation.
A two-stage construction cost estimate
The investment is bracketed in two stages: Stage 1 uses actual 2025 construction costs, and Stage 2 factors in inflation over the construction period.
| Category | Cost per tsubo | Construction cost for 10,691 tsubo of guestroom floor | Incl. land allocation (70%) | Per room |
|---|---|---|---|---|
| Stage 1 — RC structure (2025 actual) | ¥2.026 M | ¥21.66 bn | ¥25.66 bn | ¥25.7 M |
| Stage 1 — S structure (2025 actual) | ¥2.405 M | ¥25.71 bn | ¥29.72 bn | ¥29.7 M |
| Stage 2 — RC structure (post-inflation) | ¥2.187 M | ¥23.38 bn | ¥27.38 bn | ¥27.4 M |
| Stage 2 — S structure (post-inflation) | ¥2.596 M | ¥27.75 bn | ¥31.76 bn | ¥31.8 M |
The implication of this estimate is clear. Building the entire complex (50,491 m² gross floor area) at 2025 construction cost levels would cost ¥30.9 billion in RC or ¥36.7 billion in steel for construction alone, or ¥36.7–42.5 billion including land. The approximately ¥30 billion total investment reported in 2019 assumed the construction cost environment of that time; given subsequent increases in materials and labor costs, the investment figure in the business plan has likely been updated. In fact, hotel construction costs rose 41% between 2022 and 2024. How that increase is cutting into new supply nationwide is set out in Construction +41% & Labor Crunch Erase Japan’s 2027-2029 Hotel Supply.
That said, rising construction costs are not a one-directional risk. Because the same environment suppresses competing new supply, for a developer that has already acquired land and is advancing plans it functions as a barrier to entry. JLL research puts Japan’s new supply rate at 1.5–1.7% due to construction cost inflation, far below the Asia-Pacific average of 6.6%. Once 1,000 rooms come online in 2027, the likelihood of a comparable follow-on appearing within a short period is structurally low.
Viability Range — A breakeven ADR of ¥13,200 makes occupancy, not price, the variable
We model rooms-division revenue under three scenarios. ADR is set within the range of Mihama Ward’s prevailing levels plus a new-build premium, OCC assumes occupancy underpinned by business and MICE demand, and the GOP margin is anchored on disclosed results from listed REITs (38.9% for accommodation-led operations).
| Assumption | A. Conservative | B. Standard Base | C. Upside |
|---|---|---|---|
| ADR | ¥13,400 | ¥15,500 | ¥17,500 |
| OCC | 78% | 82% | 85% |
| Annual rooms revenue | ¥3.81 bn | ¥4.64 bn | ¥5.43 bn |
| GOP margin | 38% | 40% | 42% |
| GOP | ¥1.45 bn | ¥1.86 bn | ¥2.28 bn |
| Yield (investment ¥25.66 bn / Stage 1 RC) | 5.6% | 7.2% | 8.9% |
| Yield (investment ¥27.38 bn / Stage 2 RC) | 5.3% | 6.8% | 8.3% |
| Simple payback period (Stage 1 basis) | 17.7 years | 13.8 years | 11.3 years |
The breakeven ADR is already within reach
We back out the ADR required to secure a 6% yield at various occupancy levels. Assuming Stage 1 (RC structure, investment ¥25.66 billion) and a 40% GOP margin —
| OCC assumption | Required ADR (6% yield) | Gap vs. Mihama Ward level |
|---|---|---|
| 75% | ¥14,100 | +5.2% |
| 80% | ¥13,200 | -1.5% |
| 85% | ¥12,400 | -7.5% |
If 80% OCC can be secured, the required ADR falls below Mihama Ward’s current prevailing level. This is the single most important structural feature of the project. Without raising rates significantly, building occupancy alone brings it into viable territory. Conversely, the risk is concentrated not on the price side but on the occupancy side.
Sensitivity analysis
| Case (Stage 1, investment ¥25.66 bn) | Rooms revenue | GOP | Yield |
|---|---|---|---|
| Standard (ADR ¥15,500 / OCC 82% (modeling assumption)) | ¥4.64 bn | ¥1.86 bn | 7.2% |
| ADR -10% (¥13,950) | ¥4.17 bn | ¥1.67 bn | 6.5% |
| OCC -5 pt (77%) | ¥4.36 bn | ¥1.74 bn | 6.8% |
| Both (ADR -10% / OCC -5 pt) | ¥3.92 bn | ¥1.57 bn | 6.1% |
Two-axis ADR × OCC sensitivity grid — where the 6% yield contour runs
One-dimensional sensitivity makes it hard to see how far each variable can move before viability breaks. Below we expand the rooms-division yield for Stage 1 (investment ¥25.66 billion, GOP margin fixed at 40%) across two axes: ADR (¥13,000–¥17,500) and occupancy (72–88%).
| Occupancy (modeling assumption) \ ADR | ADR ¥13,000 | ADR ¥14,000 | ADR ¥15,500 | ADR ¥16,500 | ADR ¥17,500 |
|---|---|---|---|---|---|
| 72% | 5.3% | 5.7% | 6.3% | 6.8% | 7.2% |
| 76% | 5.6% | 6.1% | 6.7% | 7.1% | 7.6% |
| 80% | 5.9% | 6.4% | 7.1% | 7.5% | 8.0% |
| 84% | 6.2% | 6.7% | 7.4% | 7.9% | 8.4% |
| 88% | 6.5% | 7.0% | 7.8% | 8.3% | 8.8% |
What the grid shows is that the cells falling below viability (a 6% yield) are confined to the bottom-left corner. Of the 25 cells, 21 clear 6% and 13 of those clear 7%. Even cutting ADR to ¥14,000, securing 76% OCC (both modeling assumptions) delivers 6.1%; and even at the ¥13,000 band that matches Mihama Ward’s prevailing level, building occupancy to 84% reaches 6.2%. Conversely, pushing ADR all the way to ¥17,500 but sinking to 72% OCC stops at 7.2% — barely different from the standard case (¥15,500 × 80%, at 7.1%).
Because yield is proportional to the product of ADR and OCC, the slope of the sensitivity is itself symmetric (+0.46 pt per ¥1,000 of ADR; +0.35 pt per 4 pt of OCC — equalize the relative magnitude of change and the contributions are equivalent). What differs is how far each variable can actually move. ADR is capped by the market ceiling — Mihama Ward’s prevailing ¥13,400 and, even at the cluster’s peak, ¥23,200 — whereas OCC can realistically span the 16-point range of 72–88% used in this grid. This asymmetry is what pushes the swing variable to the occupancy side, corroborating this article’s reading that inventory absorption design, not pricing strategy, is the main battleground.
Even cutting ADR by 10% and taking OCC 5 points lower, the yield holds at 6.1%. That this resilience can be confirmed on a rooms-division-only basis is important material for assessing the project risk of the mixed-use development. In practice, moreover, the bathing facility, cinema and food & beverage divisions generate their own revenue from the remaining 30% of floor area, cushioning downside in the rooms division to some degree.
Conditions for Absorption — The room-nights 1,000 rooms require, and three sources of demand
Running 1,000 rooms at 80% OCC (a modeling assumption) requires 292,000 room-nights per year in demand. If the station-front cluster’s existing 3,811 rooms are assumed to run at 75%, that is roughly 1,043,000 room-nights per year; filling 1,000 new rooms at 80% while maintaining existing demand would require roughly a 28% increase in demand across the cluster. That is not a level achieved by organic growth alone — it requires clearly identified sources. On how far large events at Makuhari Messe lift surrounding lodging demand, we examined measured figures in Summer Sonic 2026: Hotel ADR Within 5km of Makuhari & Banpaku Park.
① MICE and large events
Large exhibition and concert demand centered on Makuhari Messe. Tokyo Game Show 2025 drew 263,101 total visitors over four days, and CEATEC 2025 registered 98,884 visitors. Lodging demand during these events cannot be absorbed by the neighboring cluster alone and spills over to central Tokyo and central Chiba City. A 1,000-room property directly at the station could be the mechanism to recapture that spillover.
② The business demand base
Within 1 km there are 1,199 establishments and 52,086 employees (office-sector share 35.4%), providing the depth to support weekday business-trip and training demand. That two training facilities (315 rooms combined) are located in the existing cluster also attests to the presence of this demand segment.
③ Cross-selling within the complex
A configuration placing a bathing facility, cinema and restaurants within the same building creates a revenue layer a standalone hotel does not have. On top of in-house spending by guests, day-trip use by local customers forms non-rooms revenue. With 44,306 residents within 1.5 km and a population holding roughly flat through 2040, the demographic structure supports the durability of this local-customer layer.
It is also worth examining the seasonal and day-of-week profile of demand. Tracking remaining inventory toward the check-in date for Chiba Prefecture’s city hotel segment (53 properties, 15,751 rooms), inventory is absorbed in stages from 90 days to 40 days of lead time (LT). Taking September 5, 2026 as an example, remaining inventory of 3,362 rooms at LT90 (across the 53 target properties) fell to 2,406 rooms by LT40, an absorption rate of 28.4% over that span. For August 22, 2026, by contrast, the path is more gradual, from 5,306 rooms at LT90 to 3,251 rooms at LT30.
What this curve shows is that city hotel demand in the prefecture builds from a relatively early lead time. That is consistent with the characteristics of MICE demand, where event dates are fixed well in advance, and is a tailwind for allocating inventory at 1,000-room scale in a planned way. Conversely, how to fill weekdays without events becomes the practical main battleground — and this is where ② business demand and ③ the local-customer layer come into play.
Risk factors and time horizon
| Factor | Description | Upside / offset |
|---|---|---|
| Schedule | A long-horizon scheme announced in 2019, leaving room for changes to groundbreaking and opening dates | The land was acquired back in 2019. On a published land price basis, roughly ¥3.1 billion in unrealized gains has accumulated |
| Construction cost | Up 41% from 2022 to 2024, with forecast increases of +5.3% in 2026 and +5.0% in 2027 | The same environment suppresses competing new supply. Japan’s new supply rate is internationally low at 1.5–1.7% |
| Demand build-up | Roughly a 28% increase in demand is needed across the cluster | Room to recapture MICE spillover, plus a hard-to-replicate location directly at the station |
| Price | A large increase above Mihama Ward’s prevailing ¥13,400 is difficult to assume | At 80% OCC (a modeling assumption), the breakeven ADR of ¥13,200 sits below prevailing levels. The burden on the price side is small |
| Catchment population | Tokyo metropolitan suburbs are generally in population decline | Within 1.5 km, 2040 is +0.6% vs. 2025 — essentially flat. The local-customer layer underpinning long-term ownership persists |
Conclusion — Read it not as “a 1,000-room hotel” but as “the lodging floors of a mixed-use complex”
To summarize the analysis:
First, the site conditions dictate the product. Of the 50,491 m² permitted gross floor area derived from a 400% FAR on a 12,622.67 m² site, allocating 70% to guestroom floors gives roughly 35 m² gross per room. That is a compact-room specification, and it places this project on the extension of Mihama Ward’s current price band — an estimated settled ADR of ¥13,400 (N=12 properties). The design does not presuppose recovering the investment through high rates.
Second, the burden on the price side is already small. Setting the guestroom-floor investment at ¥25.66 billion (¥25.7 million per room) using 2025 construction cost levels (RC structure, ¥2.026 million per tsubo), the breakeven ADR for a 6% yield is ¥13,200 at 80% OCC (a modeling assumption). That is 1.5% below Mihama Ward’s prevailing level, and even in a downside case of ADR -10% and OCC -5 pt, the yield holds at 6.1%. The issue is not price but the build-up of occupancy.
Third, the source of absorption lies in the mixed-use configuration itself. The 292,000 room-nights per year required at 80% OCC (a modeling assumption) equate to roughly a 28% increase in demand across the station-front cluster. Closing that gap falls to three layers: MICE demand centered on Makuhari Messe (Tokyo Game Show 2025 drew 263,101 visitors over four days), the business cluster of 52,086 workers within 1 km, and the local-customer layer created by the bathing facility, cinema and restaurants. Viewed as a standalone hotel the number is heavy, but viewed as the lodging floors of a mixed-use complex, a structure is built in whereby non-rooms revenue cushions downside in the rooms division.
Fourth, this is a location where time is on the developer’s side. Station-front published land prices rose 48.3% from 2019 to 2026, with the last three years at +7.6% → +11.9% → +10.8% YoY. Projected population within 1.5 km holds essentially flat at +0.6% in 2040 versus 2025, and the working-age share is high at 71.1%. For a project assuming more than 20 years of ownership in a Tokyo metropolitan suburb, the risk of catchment-area contraction is relatively small.
Finally, to repeat the caveats: the approximately ¥30 billion total investment is a press-reported figure from 2019, not an official disclosure by the developer. Building a mixed-use complex of the same scale at 2025 construction cost levels would come to ¥30.9 billion in RC or ¥36.7 billion in steel for construction alone, or ¥36.7–42.5 billion including land. The project’s specifications, including opening date, room count and use mix, may be updated. All estimates in this article should be referenced as conditional readings premised on the disclosed and registered specifications.
Related Reading
- Summer Sonic 2026: Hotel ADR Within 5km of Makuhari & Banpaku Park Hits +50% Over a Normal Friday — Reading the 25th-Anniversary Five-Day Wave
- Construction +41% & Labor Crunch Erase Japan’s 2027-2029 Hotel Supply — A New-Opening Map
- Utsunomiya 300-Room Hotel Plan: Supply Absorption Headroom Read Through LRT Extension and Business Demand
- Hotel Investment in Japan’s “Second-Tier” Cities: ADR, Supply and Yields in Saitama, Chiba, Hamamatsu, Niigata and Kitakyushu
- Japan Intra-Prefecture ADR Gaps Reach 5.2x: A Nationwide Municipal-Range Comparison of Polarization and White Space
References and Sources
■ Data sources
Estimated settled ADR is from MetroEngines Research & Consulting’s monthly municipal aggregates (Mihama Ward, Chiba City N=12–13 properties; Urayasu City N=38–43 properties; Chuo Ward, Chiba City N=34–45 properties). Level comparisons in the main text are aligned on the most recent 11 confirmed months (August 2025 – June 2026) average, and where forward-listing cross-sections are shown alongside, the month is stated explicitly as “October 2026.” Room stock (Chiba Prefecture 736 properties, 49,169 rooms; city hotel segment 53 properties, 15,751 rooms) is on an operation-confirmed basis as of August 2026. Project specifications (rooms, floors, uses, construction period) come from building-plan data based on MLIT’s “Construction Dynamics Statistics Survey”; land prices and use districts from the Real Estate Information Library; and the population mesh from National Land Numerical Information.
■ Modeling assumptions
A simplified rooms-division-only estimate. Permitted gross floor area of 50,491 m² = site area 12,622.67 m² × 400% specified FAR, of which 70% for hotel use = 35,343 m² (10,691 tsubo) is treated as guestroom floor area. Construction costs use the 2025 per-tsubo rates by structure type (RC ¥2.026 million / steel ¥2.405 million) as Stage 1, with Stage 2 incorporating +7.9% by placing the midpoint of the construction period in the first half of 2027. Land is allocated to guestroom floors at 70% of the ¥5.72 billion sale price. Yield = ADR × 1,000 rooms × 365 days × OCC × GOP margin ÷ investment. All OCC figures in this article are modeling assumptions, not measured occupancy at this property. The GOP margin is varied across 38–42% around the 38.9% actual result disclosed by Invincible Investment Corporation (FY ended December 2024, 91 MHM-operated properties).
■ Limitations and caveats
(1) The approximately ¥30 billion total investment is a press-reported figure from 2019, not an official disclosure by the developer. Opening date, room count and use mix may change. (2) Revenue from the bathing facility, cinema and food & beverage divisions is excluded from the estimate, so the project-wide yield will not match the figures here. (3) Estimated settled ADR has a median error of approximately 7% when cross-checked against property-level disclosures by listed hotel REITs (91 properties, most recent three months). Area figures are medians and are not the transacted prices of individual properties. (4) Monthly ADR from July 2026 onward is estimated from listed rate levels as of the research date and will fluctuate as the check-in date approaches. (5) The remaining-inventory trend is estimated from the absorption of OTA sales inventory and differs from actual property-wide occupancy. (6) Because building-plan data is based on building-confirmation applications, the pipeline for 2028 onward is a floor. This article is not investment advice; actual investment decisions require a detailed feasibility study.
■ Market data
- MetroEngines Research & Consulting — estimated settled ADR (Mihama Ward N=12 properties, Chuo Ward Chiba City N=33–45 properties, Urayasu City N=33–43 properties), operation-confirmed lodging stock (Chiba Prefecture 736 properties, 49,169 rooms), remaining-inventory trend (Chiba Prefecture city hotel segment N=53 properties)
■ Government statistics and public data
- MLIT Real Estate Information Library — published land prices (4 Hibino 2-chome, Mihama Ward, 2019–2026), use districts, location optimization plans
- MLIT National Land Numerical Information — projected future population by 250 m mesh (National Institute estimate, R6)
- MIC & METI “Economic Census — Activity Survey” — establishments and employees (boundaries = 2020 national census small areas)
- MLIT “Construction Dynamics Statistics Survey” — building-plan data (rooms, floors, uses, construction period), construction cost per tsubo by structure type
- Chiba Prefecture, “Overview of Makuhari New City” (Enterprise Land Management Bureau)
- Chiba City, “Makuhari New City Overview”
- JR East, “Passengers by Station, FY2024” — Kaihin-Makuhari Station, 56,995 average daily boarding passengers
■ REIT and industry reports
- Invincible Investment Corporation — operating GOP margin of 38.9% (FY ended December 2024, 91 MHM-operated properties)
- JLL, “Japan Hotel Investment Market 2025” — new supply rate of 1.5–1.7% (Asia-Pacific average 6.6%)
- Turner & Townsend — construction inflation forecasts (+5.3% in 2026, +5.0% in 2027)
■ News and public announcements
- Nihon Keizai Shimbun, “Royal Lease to build mixed-use complex in front of Kaihin-Makuhari Station, targeting 2027” (March 2019)
- Nikkan Kensetsu Times, “Station-front complex to be rebuilt in Makuhari New City; transferred to Royal Lease (Prefectural Enterprise Land Management Bureau)”
- FASHIONSNAP, “Kaihin-Makuhari commercial facility ‘Messe Amuse Mall’ renovated”
- 4Gamer, “Tokyo Game Show 2025 draws 263,101 total visitors over four days”
A note on ADR for future dates: Among the ADR figures in this article, months from July 2026 onward are estimates based on selling prices published on OTAs and similar channels as of the research date, and will fluctuate as the check-in date approaches. The business estimates in this article are also simplified calculations premised on disclosed and registered specifications; actual investment decisions require a detailed feasibility study.