

Most analyses of a lodging market stop at “how many rooms does the area have?” In practice, the more important question is how many buildings those rooms are split across. Two markets can both have 2,000 rooms, yet one where a single property holds 900 of them and one where rooms are spread over 70 properties react completely differently when one new hotel opens. In this article we aggregated Japan’s lodging facilities property by property (one building = one unit) at the municipality level and calculated two concentration metrics: “largest-property share” and “top-3 share.” We then set these against estimated settled ADR and estimated occupancy, overlaid building-plan data, and identified the markets where a single new hotel rewrites the market structure.
Metric Definitions Used in This Article
- Largest-property share: The share of a municipality’s total room count held by a single property (one building). Counted at the property level, not at the chain or group level.
- Top-3 share: Likewise, the combined rooms of the three largest properties as a share of total rooms.
- ADR (Average Daily Rate): An estimated settled rate (tax-excluded equivalent), calculated by applying segment-specific adjustment factors to the lowest-plan rate each property publishes on OTAs (per room, two guests, tax included). Checked against property-level results disclosed by listed hotel REITs (91 properties, most recent 3 months), the median error is about 7%. These are estimates and differ from each property’s actual settled prices and accounting figures. Area-level ADR is the median across the properties covered (the level of a typical property in the area).
- OCC (Occupancy): Rooms sold as a share of total rooms in the area (an estimate based on OTA sales inventory; consistency checks against REIT monthly disclosures show accuracy within roughly a few percentage points). Wherever listed prices are mentioned, they are per-room rates for two guests (tax included).
- Data sources: MetroEngines Research & Consulting (properties and room counts, estimated settled ADR, estimated occupancy) / Ministry of Land, Infrastructure, Transport and Tourism (MLIT), “Building Construction Statistics” (building plans)
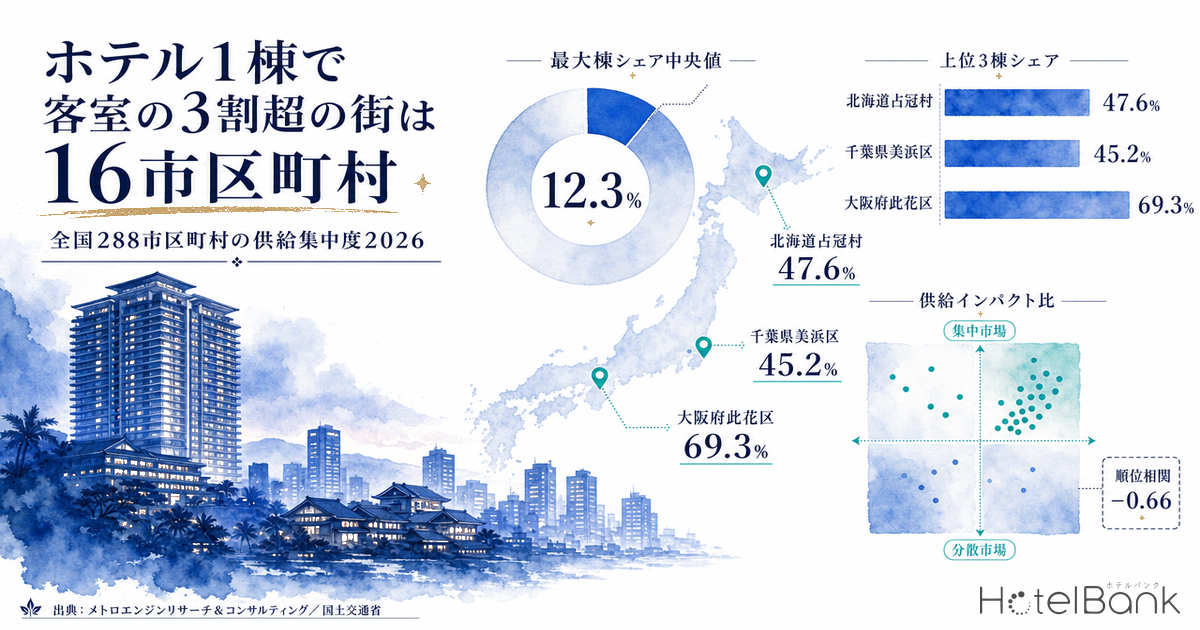
- — Across 288 municipalities nationwide (1,000+ total rooms and 5+ properties), the median largest-property share is 12.3%. Only 16 municipalities exceed 30%, and 46 exceed 20%.
- — What drives concentration is market size. The rank correlation with total room count is −0.66: the smaller the market, the heavier the weight of a single property.
- — Concentration explains neither rates nor occupancy. Rank correlations with estimated settled ADR and estimated occupancy were both weaker than −0.1.
- — What matters is the next single property. Planned rooms exceed 20% of existing stock in 12 municipalities, led by Konohana Ward, Osaka at 69.3% (if all plans are realized).
- — Of the largest properties in the 46 concentrated markets, only one is owned by a listed hotel REIT. The single property that sways a town’s supply and demand sits outside the public markets.
Median Largest-Property Share Is 12.3% — Distribution Across 288 Municipalities
The analysis covers 19,424 properties tracked by MetroEngines Research that have at least 10 rooms and were recently confirmed to list sales inventory on OTAs. Extracting municipalities with at least 1,000 total rooms and at least 5 properties as “markets” yields 288 municipalities, comprising 12,719 properties and 1,133,723 rooms. The median market has 31 properties and 2,082 rooms.
Calculating the largest-property share for these 288 markets gives a median of 12.3%. In other words, “in a typical town, the single largest hotel holds roughly one-eighth of the market.” The median top-3 share is 30.2%, meaning the three largest properties hold about 30% of the market. The distribution is skewed toward low values: 105 municipalities (36.5% of the total) are below 10%, while 16 municipalities have a largest-property share above 30%. Widening the threshold to 20% or more gives 46 municipalities.
Source: MetroEngines Research & Consulting (N=288 municipalities, 12,719 properties)
Concentration Is Really About Market Size — Rank Correlation of −0.66
Why does concentration differ between markets? Most of the answer lies in market size. The rank correlation between total room count (log) and largest-property share is −0.661: the larger the market, the lower the largest-property share. Indeed, the 46 markets with a largest-property share of 20% or more average just 16.9 properties, while the 105 markets below 10% average 76.1. Concentration is not a case of “someone monopolizing the market”; it is the mathematical consequence of having few properties.
Source: MetroEngines Research & Consulting (N=288 municipalities)
| Market size band (total rooms) | Municipalities | Median largest-property share | Median top-3 share | Median estimated settled ADR |
|---|---|---|---|---|
| 1,000–2,000 rooms | 136 | 16.0% | 39.6% | ¥8,800 |
| 2,000–5,000 rooms | 95 | 9.6% | 24.4% | ¥9,100 |
| 5,000–10,000 rooms | 32 | 6.2% | 16.3% | ¥8,000 |
| 10,000+ rooms | 25 | 6.3% | 13.7% | ¥11,100 |
Source: MetroEngines Research & Consulting (N=288 municipalities)
Top 15 Municipalities by Largest-Property Share — One Property Holds Over 30%
The table below lists the 15 most concentrated markets. At the top is Shimukappu Village, Hokkaido (北海道占冠村), where one large resort holds 47.6% of all rooms in the village and the top three properties hold 95.8%. It is an extreme case of a standalone resort location.
Among urban markets, Mihama Ward, Chiba City (Kaihin-Makuhari) stands out. Against a total market of 4,440 rooms, a single property with one of the largest room counts in Japan — APA Hotel & Resort Tokyo Bay Makuhari (アパホテル&リゾート〈東京ベイ幕張〉) — accounts for 2,007 rooms, a 45.2% share. The structure allows one building to absorb the demand from large events at Makuhari Messe, a configuration backed by real drawing power. Similarly, Naeba Prince Hotel (苗場プリンスホテル) holds 1,216 rooms, or 37.2%, of Yuzawa Town, Niigata, and APA Hotel Shin-Osaka Ekimae (アパホテル〈新大阪駅前〉) holds 660 rooms, or 36.0%, of Higashiyodogawa Ward, Osaka. Each of these properties “takes on a substantial portion of its town’s lodging demand single-handedly.”
Looking at the largest property in each of the 46 concentrated markets (largest-property share of 20% or more) by segment, business hotels are the most common at 22, followed by resort hotels (9), city hotels (8), deluxe hotels (4), and ryokan (3). Two patterns sit side by side under the same label of “concentration”: large business hotels anchoring supply near stations and expressway interchanges in regional cities, and a single large resort shaping the town in resort areas.
| # | Municipality | Properties | Total rooms | Largest-property share | Top 3 | Est. ADR | Est. OCC | Largest property |
|---|---|---|---|---|---|---|---|---|
| 1 | Shimukappu Village, Hokkaido | 6 | 1,123 | 47.6% | 95.8% | ¥34,700 | — | Hoshino Resorts Tomamu The Tower (星野リゾート トマム ザ・タワー) (535 rooms) |
| 2 | Mihama Ward, Chiba City | 13 | 4,440 | 45.2% | 61.4% | ¥10,946 | — | APA Hotel & Resort Tokyo Bay Makuhari (アパホテル&リゾート〈東京ベイ幕張〉) (2,007 rooms) |
| 3 | Yuzawa Town, Niigata | 55 | 3,273 | 37.2% | 53.9% | ¥14,190 | 86.3% | Naeba Prince Hotel (苗場プリンスホテル) (1,216 rooms) |
| 4 | Yomitan Village, Okinawa | 12 | 1,252 | 37.1% | 76.8% | ¥20,126 | — | Grand Mercure Okinawa Cape Zanpa Resort (グランドメルキュール沖縄残波岬リゾート) (465 rooms) |
| 5 | Ichikawa City, Chiba | 13 | 1,258 | 36.6% | 56.6% | ¥8,729 | — | Toyoko Inn Nishi-Funabashi Baraki Inter (東横INN西船橋原木インター) (461 rooms) |
| 6 | Nachikatsuura Town, Wakayama | 19 | 1,003 | 36.4% | 55.0% | ¥12,495 | — | Hotel Urashima (ホテル浦島) (365 rooms) |
| 7 | Higashiyodogawa Ward, Osaka City | 14 | 1,835 | 36.0% | 55.5% | ¥8,043 | — | APA Hotel Shin-Osaka Ekimae (アパホテル〈新大阪駅前〉) (660 rooms) |
| 8 | Inawashiro Town, Fukushima | 24 | 1,038 | 35.6% | 52.1% | ¥9,942 | — | Hotel Listel Inawashiro Wing Tower (ホテルリステル猪苗代ウイングタワー) (370 rooms) |
| 9 | Minato Ward, Osaka City | 16 | 1,353 | 33.6% | 62.2% | ¥10,732 | — | Art Hotel Osaka Bay Tower (アートホテル大阪ベイタワー) (454 rooms) |
| 10 | Higashi Ward, Fukuoka City | 13 | 1,534 | 33.0% | 56.6% | ¥12,910 | — | HOTEL AZ Fukuoka Wajiro (HOTEL AZ 福岡和白店) (506 rooms) |
| 11 | Hachimantai City, Iwate | 24 | 1,238 | 32.4% | 58.0% | ¥10,246 | 88.3% | ANA Crowne Plaza Resort Appi Kogen (ANAクラウンプラザリゾート安比高原) (401 rooms) |
| 12 | Minami Ward, Sapporo | 26 | 2,793 | 32.3% | 66.5% | ¥19,940 | 90.9% | APA Hotel & Resort Sapporo (アパホテル&リゾート〈札幌〉) (903 rooms) |
| 13 | Iwakuni City, Yamaguchi | 15 | 1,609 | 31.9% | 56.5% | ¥5,950 | — | HOTEL AZ Yamaguchi Iwakuni (HOTEL AZ 山口岩国店) (514 rooms) |
| 14 | Nishi Ward, Hamamatsu (Shizuoka) | 13 | 1,168 | 31.6% | 55.9% | ¥13,208 | — | Grand Mercure Lake Hamana Resort & Spa (グランドメルキュール浜名湖リゾート&スパ) (369 rooms) |
| 15 | Ginowan City, Okinawa | 13 | 1,105 | 30.8% | 74.2% | ¥15,877 | — | Okinawa Prince Hotel Ocean View Ginowan (沖縄プリンスホテルオーシャンビューぎのわん) (340 rooms) |
Estimated settled ADR is the median of monthly values for June–August 2026. Estimated OCC is for August 2026. Markets with too few OTA-listed properties to ensure estimation accuracy are shown as “—”. Source: MetroEngines Research & Consulting
Bottom 15 Municipalities by Largest-Property Share — Where a Single Property’s Impact Disappears
In contrast, some markets have extremely low largest-property shares. Chuo City, Tokyo has 186 properties and 26,858 rooms, yet its largest property has 497 rooms — a share of just 1.9%, with the top three at only 5.2%. Taito City has 280 properties and a 2.0% share, and Chuo Ward, Osaka has 247 properties, 37,826 rooms and a 2.4% share. In these markets, adding one 500-room hotel moves total market room count by only about 2%.
This is not limited to big cities. Hakone Town, Kanagawa has 176 properties and 6,269 rooms with a largest-property share of 3.2%, and Yamanouchi Town, Nagano (Yudanaka and Shibu Onsen) has 84 properties and 2,813 rooms at 4.0%. Hot-spring towns lined with many small and mid-sized ryokan are, structurally, also “fragmented markets.”
| # | Municipality | Properties | Total rooms | Largest-property share | Top 3 | Est. ADR | Est. OCC |
|---|---|---|---|---|---|---|---|
| 1 | Chuo City, Tokyo | 186 | 26,858 | 1.9% | 5.2% | ¥15,680 | 93.3% |
| 2 | Taito City, Tokyo | 280 | 23,752 | 2.0% | 5.5% | ¥11,988 | 92.7% |
| 3 | Chuo Ward, Sapporo | 170 | 27,198 | 2.2% | 6.1% | ¥13,956 | 94.9% |
| 4 | Hakata Ward, Fukuoka City | 211 | 25,683 | 2.3% | 6.2% | ¥12,789 | 95.2% |
| 5 | Naha City, Okinawa | 231 | 22,119 | 2.4% | 5.8% | ¥9,645 | 90.6% |
| 6 | Chuo Ward, Osaka City | 247 | 37,826 | 2.4% | 5.9% | ¥9,290 | 88.6% |
| 7 | Nakagyo Ward, Kyoto City | 161 | 12,966 | 2.5% | 7.5% | ¥11,324 | 86.3% |
| 8 | Shimogyo Ward, Kyoto City | 237 | 20,884 | 2.6% | 7.4% | ¥11,111 | 87.4% |
| 9 | Hakone Town, Kanagawa | 176 | 6,269 | 3.2% | 8.1% | ¥23,332 | 90.5% |
| 10 | Naka Ward, Nagoya | 100 | 18,241 | 3.4% | 9.3% | ¥8,293 | 90.0% |
| 11 | Kagoshima City, Kagoshima | 80 | 9,381 | 3.8% | 10.7% | ¥6,380 | — |
| 12 | Kanazawa City, Ishikawa | 112 | 13,355 | 3.8% | 11.0% | ¥8,694 | 88.4% |
| 13 | Takayama City, Gifu | 122 | 5,568 | 4.0% | 11.8% | ¥15,198 | 92.6% |
| 14 | Yamanouchi Town, Nagano | 84 | 2,813 | 4.0% | 10.2% | ¥10,983 | 93.9% |
| 15 | Matsuyama City, Ehime | 94 | 8,203 | 4.0% | 11.6% | ¥8,814 | 92.2% |
Estimated settled ADR is the median of monthly values for June–August 2026. Estimated OCC is for August 2026. Source: MetroEngines Research & Consulting
Concentration Explains Neither Rates Nor Occupancy — Rank Correlations Weaker Than −0.1
This is the central finding of the article. The intuition that “towns where one property dominates the market must command higher prices” was not supported by the data. The rank correlation between largest-property share and estimated settled ADR is just −0.097, and −0.156 for top-3 share. The correlation with estimated occupancy is −0.092. In every case, there is effectively no correlation.
Splitting the 288 markets into quartiles by largest-property share, the median estimated ADR declines gently from ¥9,700 on the fragmented side to ¥8,600 on the concentrated side, but this gap most likely reflects differences in market size (larger urban markets have higher rates) rather than concentration itself. Estimated occupancy is essentially flat, ranging from 89.9% to 91.6% (as of August 2026, estimated from OTA-listed inventory, N=163 municipalities).
Estimated occupancy is calculated only for the 163 municipalities with enough OTA-listed properties to ensure estimation accuracy (note that the fourth quartile has a small base of 16 municipalities). Source: MetroEngines Research & Consulting
In short, concentration is not a metric for reading pricing strategy or the strength of supply and demand. Where concentration matters is when a new property enters the market. If a 200-room hotel opens in the median market (2,082 rooms), that one property alone accounts for 8.8% of the market. In the fourth quartile (median 1,304 rooms), it is 13.3%. Supply of a size that would be mere noise in a fragmented market becomes a structural change in a concentrated one.
12 Municipalities Where One Property Changes the Structure — Supply Impact Seen Through Building Plans
Using MLIT’s “Building Construction Statistics,” we aggregated by municipality the lodging building plans filed for completion or operation from September 2026 onward (344 projects and 54,219 rooms nationwide after removing duplicates). Of these, 120 municipalities and 43,728 rooms fall within the 288 markets in this study. The “supply impact ratio” — planned rooms divided by existing rooms — exceeds 20% in 12 municipalities. For the distribution of the same ratio on a new-opening basis with confirmed opening dates, see our separate Hotel Supply Pressure Ranking 2026-2027.
Source: Compiled by MetroEngines Research & Consulting from MLIT “Building Construction Statistics” / Existing room counts: MetroEngines Research & Consulting
| Municipality | Existing properties | Existing rooms | Largest-property share | Planned projects | Planned rooms | Supply impact ratio | Largest plan | Scheduled completion | Est. ADR |
|---|---|---|---|---|---|---|---|---|---|
| Konohana Ward, Osaka City | 19 | 4,785 | 15.9% | 2 | 3,317 | 69.3% | 2,500 rooms | Oct 2029 | ¥14,681 |
| Kutchan Town, Hokkaido | 42 | 3,236 | 15.6% | 5 | 1,132 | 35.0% | 482 rooms | Sep 2027 | ¥16,273 |
| Minami Ward, Hiroshima City | 35 | 4,844 | 15.0% | 6 | 1,687 | 34.8% | 600 rooms | Apr 2028 | ¥10,246 |
| Miyakojima City, Okinawa | 98 | 5,602 | 5.9% | 2 | 1,902 | 34.0% | 1,726 rooms | Mar 2028 | ¥16,509 |
| Yokkaichi City, Mie | 32 | 2,784 | 8.5% | 3 | 928 | 33.3% | 385 rooms | Dec 2027 | ¥7,140 |
| Furano City, Hokkaido | 26 | 1,515 | 26.9% | 2 | 395 | 26.1% | 200 rooms | Dec 2027 | ¥16,094 |
| Osaki City, Miyagi | 32 | 1,729 | 13.3% | 1 | 428 | 24.8% | 428 rooms | Dec 2026 | ¥8,820 |
| Mihama Ward, Chiba City | 13 | 4,440 | 45.2% | 1 | 1,000 | 22.5% | 1,000 rooms | Dec 2027 | ¥10,946 |
| Ozu Town, Kumamoto | 14 | 1,833 | 11.6% | 1 | 400 | 21.8% | 400 rooms | Dec 2026 | ¥8,085 |
| Aoi Ward, Shizuoka City | 31 | 2,972 | 10.3% | 2 | 642 | 21.6% | 418 rooms | Apr 2027 | ¥8,191 |
| Tachikawa City, Tokyo | 18 | 1,625 | 15.4% | 2 | 351 | 21.6% | 211 rooms | Mar 2027 | ¥9,919 |
| Tsuruoka City, Yamagata | 39 | 2,280 | 8.6% | 2 | 485 | 21.3% | 300 rooms | Aug 2027 | ¥10,220 |
*Based on building-confirmation applications as of the survey date. Project and room counts are expected to rise as further applications are filed; treat these figures as the lower bound of the currently confirmed pipeline. Source: MLIT “Building Construction Statistics” / MetroEngines Research & Consulting
A Range Based on How Much of the Pipeline Materializes — Three-Case Comparison
The supply impact ratios in the table above assume every filed plan is realized. Because building-confirmation applications are filed one to two years before opening, cancellations or downsizing may occur, while additional applications could push the numbers higher. Here we show a range for the 12 municipalities by splitting plan realization into three cases. Case A: the single largest plan is cancelled and only the rest are realized. Case B: only the single largest plan is realized. Case C: all plans are realized (the figures used in the main body of this article).
| Municipality | Existing rooms | Case A Largest plan cancelled | Case B Largest plan only | Case C All plans realized | Range |
|---|---|---|---|---|---|
| Konohana Ward, Osaka City | 4,785 | 17.1% | 52.2% | 69.3% | 17.1–69.3pt |
| Kutchan Town, Hokkaido | 3,236 | 20.1% | 14.9% | 35.0% | 14.9–35.0pt |
| Minami Ward, Hiroshima City | 4,844 | 22.4% | 12.4% | 34.8% | 12.4–34.8pt |
| Miyakojima City, Okinawa | 5,602 | 3.1% | 30.8% | 34.0% | 3.1–34.0pt |
| Yokkaichi City, Mie | 2,784 | 19.5% | 13.8% | 33.3% | 13.8–33.3pt |
| Furano City, Hokkaido | 1,515 | 12.9% | 13.2% | 26.1% | 12.9–26.1pt |
| Osaki City, Miyagi | 1,729 | 0.0% | 24.8% | 24.8% | 0.0–24.8pt |
| Mihama Ward, Chiba City | 4,440 | 0.0% | 22.5% | 22.5% | 0.0–22.5pt |
| Ozu Town, Kumamoto | 1,833 | 0.0% | 21.8% | 21.8% | 0.0–21.8pt |
| Aoi Ward, Shizuoka City | 2,972 | 7.5% | 14.1% | 21.6% | 7.5–21.6pt |
| Tachikawa City, Tokyo | 1,625 | 8.6% | 13.0% | 21.6% | 8.6–21.6pt |
| Tsuruoka City, Yamagata | 2,280 | 8.1% | 13.2% | 21.3% | 8.1–21.3pt |
Case A = (planned rooms − rooms in largest plan) ÷ existing rooms; Case B = rooms in largest plan ÷ existing rooms; Case C = planned rooms ÷ existing rooms. Source: MLIT “Building Construction Statistics” / MetroEngines Research & Consulting
The nature of the range differs from market to market. In Konohana Ward (Osaka), Miyakojima City, Mihama Ward (Chiba), Osaki City and Ozu Town, a single largest plan accounts for most of the pipeline, so whether that one project goes ahead determines the conclusion outright. By contrast, in Minami Ward (Hiroshima), Kutchan Town and Yokkaichi City, supply builds up from multiple plans, so even if one drops out, a supply increase of around 20% remains. The former requires tracking the progress of individual projects; the latter requires assessing the absorptive capacity of the market as a whole.
The Share a New Property Can Capture — Sensitivity to Market Size × Room Count
From an investment and development perspective, the position a property of a given size can capture changes completely depending on the size of the market it enters. The table below varies existing room count and the new property’s room count, and calculates the share that property holds of the post-opening market (existing + new). The median existing room count across the 288 markets is 2,082; adding 200 rooms to that median market yields an 8.8% share. The same 200 rooms would reach only 3.8% in a 5,000-room market but 16.7% in a 1,000-room market.
| Existing rooms \ New property | 100 rooms | 200 rooms | 300 rooms | 500 rooms | 1,000 rooms |
|---|---|---|---|---|---|
| 1,000 rooms | 9.1% | 16.7% | 23.1% | 33.3% | 50.0% |
| 1,500 rooms | 6.2% | 11.8% | 16.7% | 25.0% | 40.0% |
| 2,082 rooms (median of 288 markets) | 4.6% | 8.8% | 12.6% | 19.4% | 32.4% |
| 3,000 rooms | 3.2% | 6.2% | 9.1% | 14.3% | 25.0% |
| 5,000 rooms | 2.0% | 3.8% | 5.7% | 9.1% | 16.7% |
Darker cells indicate higher share. Existing room counts as of August 2026. Source: MetroEngines Research & Consulting
As this article’s analysis shows, concentration itself explains neither estimated settled ADR nor estimated occupancy (rank correlations weaker than −0.1 in both cases). This table therefore does not suggest that “capturing share raises rates”; rather, it shows how much influence a single property has over the market’s inventory curve. In combinations where share exceeds 20%, that one property’s decisions to stop selling or release inventory directly affect supply and demand for the entire market.
Map of Concentrated Markets and Supply Pipelines
Plotting concentrated markets (largest-property share of 20% or more) and markets with a supply impact ratio of 15% or more on a map shows that the two barely overlap. Concentrated markets are scattered across regional mid-sized cities and resort areas, whereas large building plans cluster at specific locations tied to urban redevelopment, airports and large-scale tourism projects. Circle size represents largest-property share; blue marks markets with supply plans.
Coordinates are the locations of each municipality’s largest property. Sources: MetroEngines Research & Consulting; MLIT “Building Construction Statistics”
Four Cases — What the Next Property Changes
Mihama Ward, Chiba City (Kaihin-Makuhari): concentration eases
Against 4,440 existing rooms across 13 properties, a mixed-use development of about 1,000 rooms in front of Kaihin-Makuhari Station is scheduled to open in the second half of 2027. If realized, the market will grow to 5,440 rooms and the current 45.2% largest-property share will fall to 36.9%. The new property alone would account for 18.4% of the market. Unusually for a concentrated market, this is a case where new supply shifts the structure toward fragmentation. We examine this development’s absorption capacity in detail in Kaihin-Makuhari 1,000-Room ¥30bn Mixed-Use Development.
Konohana Ward, Osaka City: from fragmented to concentrated in one move
4,785 existing rooms across 19 properties. The largest is Liber Hotel Osaka (リーベルホテル大阪) with 760 rooms, a 15.9% share — currently a moderately fragmented market. Waiting in the pipeline are plans totalling 3,317 rooms, including about 2,500 rooms tied to the integrated resort on Yumeshima (scheduled to open in autumn 2030). The supply impact ratio of 69.3% is the highest in Japan. Once all plans are in place, the market will reach 8,102 rooms and the largest-property share will jump to 30.9%. It is one of the few cases in Japan where a single development converts a fragmented market into a concentrated one.
Miyakojima City, Okinawa: 1,726 rooms into a 98-property fragmented market
A typical fragmented market, with 5,602 existing rooms shared among 98 properties and a largest-property share of just 5.9%. But if a large resort planned in the Gusukube district (1,726 rooms) is added, that one property alone would account for 23.0% of the market. Estimated settled ADR is ¥16,500, among the highest in Japan, and estimated occupancy is also high at 89.9% (as of August 2026, same basis as above). The market’s ability to absorb demand makes the plan plausible, but it is worth noting that the structure would change to one in which a single property’s operating policy could influence price levels across the entire island.
Minami Ward, Hiroshima City and Yokkaichi City, Mie: restructuring mid-sized cities
Minami Ward in Hiroshima City has 6 plans totalling 1,687 rooms against 4,844 existing rooms across 35 properties (supply impact ratio 34.8%), and Yokkaichi City has 3 plans totalling 928 rooms against 2,784 existing rooms across 32 properties (33.3%). Both involve several overlapping properties of 300–600 rooms each; rather than dramatically shifting the largest-property share, they lift the total room count of the market by about one-third. For Yokkaichi, we analyze its distinctive demand driven by scheduled plant maintenance shutdowns (turnarounds) in Petrochemical Turnaround Year 2026.
The Largest Properties in Concentrated Markets Sit Outside Listed REITs
For the 46 markets with a largest-property share of 20% or more, we checked against our ownership master data whether the largest property is owned by a listed hotel REIT. Only one matched: in Suminoe Ward, Osaka. Nearly all of the core properties in concentrated markets lie outside listed REIT portfolios. We covered the structure in which the seven listed REITs own only a fraction of Japan’s hotel rooms in 970,000 Hotel Rooms Untouched by REITs; viewed through the lens of concentration, a further implication emerges: the more a single property sways a town’s supply and demand, the more likely it is to sit outside the public markets. Area analysis built solely on listed REITs’ monthly disclosures cannot fully capture the reality of concentrated markets.
Practical Implications
For properties operating in concentrated markets. In markets where the largest-property share exceeds 20%, a large property’s decisions to release inventory or stop selling directly move the inventory curve of the whole market. When reading your own booking curve, also observing when the largest property in your market releases inventory and when it fills up makes it easier to plan the timing of rate changes. In addition, in markets where a new property’s opening is already known, clarifying your own strengths (location, facilities, dining, room size) one to two years before that opening helps secure room to be chosen even as supply increases. We have measured how long it takes new properties’ rates to catch up with market levels in New Hotel ADR Recovery: Median 2 Months.
For properties operating in fragmented markets. In markets where the largest-property share is below 5%, there is little need to be overly wary of a single competitor opening. What matters more is cumulative supply, and tracking the annual rate of supply growth is more practical than following individual opening announcements.
From an investment and development perspective. Concentrated markets offer room to take a clear position in an area’s supply structure through the acquisition or development of a single property. Adding 200 rooms to the median market (2,082 rooms) yields an 8.8% share, and 13.3% in a market of around 1,300 rooms. On the other hand, because rate and occupancy levels cannot be predicted from concentration, the ADR and OCC assumptions underpinning a business plan need to be built individually from the market’s size band and segment mix.
Methodology and Sources
Property and room counts are based on a population of 19,424 properties (1,501,842 rooms) tracked by MetroEngines Research that have at least 10 rooms and were confirmed in the most recent survey to list sales inventory on OTAs. Of these, the 288 municipalities with at least 1,000 total rooms and at least 5 properties are analyzed. Ryokan, minshuku and simple lodging facilities not listed on OTAs are not included. Where the same property is listed under multiple names, we consolidate by name, but some duplicates may remain due to spelling variations. Properties split into separate wings or buildings are counted according to their listing units.
Estimated settled ADR is the median of monthly values for June–August 2026 (median number of properties covered: N=27.5 per municipality). The most recent month includes estimates based on sales prices listed on OTAs as of the survey date and may change. Estimated occupancy is the monthly average for August 2026; municipalities with fewer OTA-listed properties than a set threshold are excluded (calculated for 163 of the 288 markets). Building plans are based on MLIT’s “Building Construction Statistics” and aggregate lodging-use projects filed for completion or operation from September 2026 onward, excluding duplicates with the same municipality and the same room count.
⚠ Note on building-plan data: Planned room counts in this article are based on building-confirmation applications as of the survey date; such applications are usually filed one to two years before opening. Project and room counts are expected to increase as further applications are filed, so please treat these figures as the lower bound of the currently confirmed pipeline. Plans may also be cancelled or changed.
Related Articles
- Kaihin-Makuhari 1,000-Room ¥30bn Mixed-Use Development — Absorption Capacity of Chiba’s Largest Pipeline
- 970,000 Hotel Rooms, 4,934 Properties Untouched by REITs — The Listed 7 Hold Just 4.5% of Rooms
- 34% of Japan’s Hotel Pipeline Is Operator Self-Build — 69 Projects and 15,189 Rooms by Developer Type, 2026
- New Hotel ADR Recovery Takes a Median 2 Months — 182 Openings Measured and How to Build It Into a Business Plan
- Central Kumamoto Room Supply +26.0% vs 2019 — Estimated Settled ADR in a Supply Growth Phase
- Hotel Supply Pressure Ranking 2026-2027 — Ozu Town, Kumamoto Tops the Ratio to Existing Stock at 30.8%
- Does New Hotel Supply Lower ADR? Tested Across 47 Prefectures — It Only Bites Below 13,000 Rooms
- Tokyo 23 Wards Hotel Supply Pressure 2026 — Arakawa at 16.0% of Existing Stock, Minato Just 4.5% Despite Leading in Rooms
References and Sources
■ Data sources
Property and room counts cover 19,424 properties and 1,501,842 rooms tracked by MetroEngines Research & Consulting that have at least 10 rooms and were confirmed in the most recent survey to list sales inventory on OTAs. Of these, 288 municipalities with at least 1,000 total rooms and at least 5 properties (12,719 properties, 1,133,723 rooms) were analyzed. Estimated settled ADR is the median of monthly values for June–August 2026 (median number of properties covered: N=27.5 per municipality); estimated occupancy is the monthly average for August 2026 (163 municipalities where calculable). Building plans are projects in MLIT’s “Building Construction Statistics” scheduled for completion or operation from September 2026 onward (344 projects and 54,219 rooms after de-duplication). REIT ownership was determined by matching against our ownership master data.
■ Calculation assumptions
Largest-property share = rooms in a single property ÷ total rooms in the municipality; top-3 share = combined rooms of the three largest properties ÷ the same; supply impact ratio = planned rooms ÷ existing rooms. All are calculated at the property (single-building) level, not the chain or group level. In the three-case comparison, Case A = (planned rooms − rooms in largest plan) ÷ existing rooms, Case B = rooms in largest plan ÷ existing rooms, and Case C = planned rooms ÷ existing rooms. Post-opening share in the sensitivity table = new rooms ÷ (existing rooms + new rooms). The relationship between concentration and rates/occupancy was evaluated using Spearman’s rank correlation.
■ Limitations and caveats
Ryokan, minshuku and simple lodging facilities not listed on OTAs are not included in the population. Properties listed under multiple names are consolidated, but some duplicates due to spelling variations may remain. Properties split into separate wings or buildings are counted by listing unit and may not match actual building units. Building plans are based on building-confirmation applications, which are usually filed one to two years before opening, so the figures represent the lower bound of the currently confirmed pipeline (they may increase with further applications or decrease with cancellations or changes). Estimated settled ADR and estimated occupancy are estimates based on publicly available OTA inventory and differ from each property’s actual settled prices and accounting figures. Estimated settled ADR for the most recent month includes estimates based on listed prices as of the survey date and may change.
■ Market data
- MetroEngines Research & Consulting — property and room counts (OTA listing-confirmed basis, N=19,424 properties), estimated settled ADR, estimated occupancy, REIT ownership master data
■ Government statistics and public data
- Ministry of Land, Infrastructure, Transport and Tourism (MLIT), “Building Construction Statistics” (lodging-use building plans)
■ News and press releases
- Makuhari New City Town Center District (8 Hibino 1-chome, Mihama Ward, Chiba City) (in Japanese)
- Osaka IR breaks ground on Yumeshima — full launch toward an autumn 2030 opening (MICE TIMES ONLINE, in Japanese)
- Miyakojima’s largest resort to be developed by Nansei Rakuen — 1.36 million m², golf course and lodging in Gusukube Tomori (Ryukyu Shimpo, in Japanese)
■ Related articles