

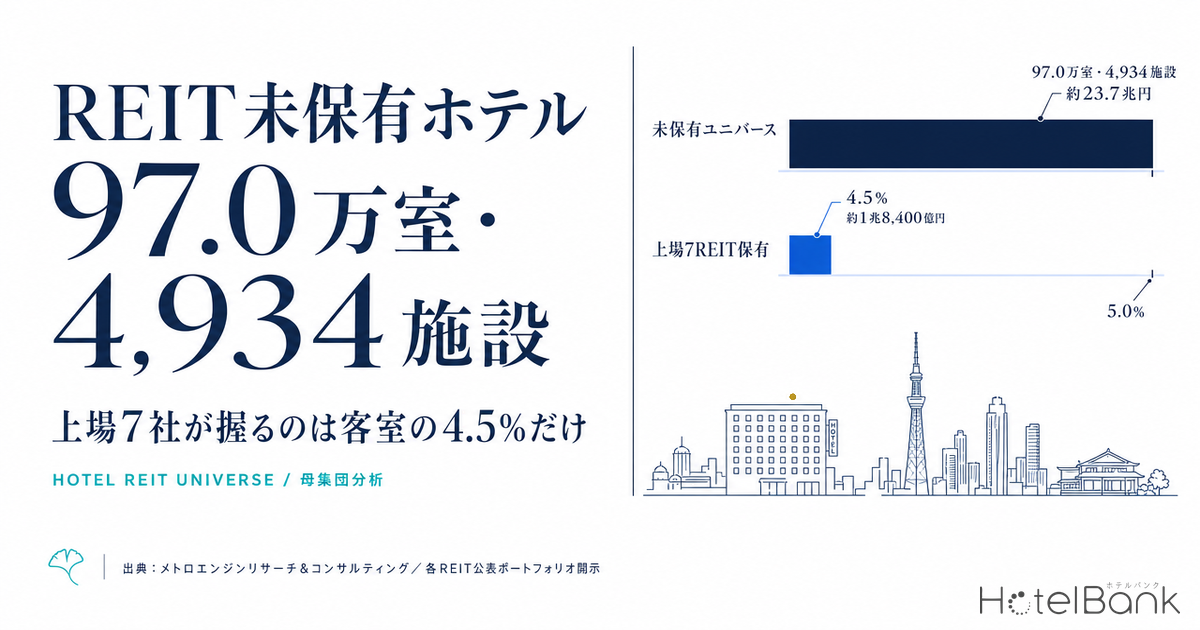
Most writing on hotel REITs takes apart what the investment corporations already own — how acquisition prices per room have polarised, how portfolio granularity differs, how far current appraisal values have drifted from purchase prices. All of it looks inside the 302 properties already held. This article inverts that view. Its subject is the size of the universe that no one has acquired yet. How many properties and how many rooms in Japan are not held by the seven listed REITs whose primary investment target is hotels — and what shape does that pool take when cut by property attributes: size, vintage and area? Counting the outline of that pool is what this article contributes.
Let us draw the line against our earlier work up front. First, the articles covering acquisition-price polarisation, portfolio granularity and the gap between purchase price and appraisal value were all breakdowns of held portfolios; their denominator was the properties REITs own. The denominator here is the properties REITs do not own. Second, the earlier mapping of acquisition headroom in areas REITs have not entered selected areas by demand signal — supply-demand tightness. This article defines the universe by property attributes (size, vintage, ownership), not demand; a different axis entirely. Third, where earlier work on the future supply pipeline counted rooms yet to be built, this article counts rooms that already exist and have not yet passed into institutional hands.
Metric and Universe Definitions Used in This Article
- Target universe: properties located in Japan with 100 or more guest rooms, for which sales activity was observed online for check-in dates up to three weeks ahead of the survey date. Aggregated within the scope MetroEngines Research can observe; properties not listed online are excluded. This is not a complete census.
- REIT-held: properties registered in the ownership master (snapshot as of 24 August 2026) of the seven listed REITs whose primary investment target is hotels — Ichigo Hotel REIT (いちごホテルリート投資法人), Invincible Investment Corporation (インヴィンシブル投資法人), Nippon Hotel & Residential Investment Corporation (日本ホテル&レジデンシャル投資法人), Japan Hotel REIT (ジャパン・ホテル・リート投資法人), Hoshino Resorts REIT (星野リゾート・リート投資法人), Mori Trust REIT (森トラストリート投資法人) and Kasumigaseki Hotel REIT (霞ヶ関ホテルリート投資法人). Mori Trust REIT is a diversified vehicle holding offices and hotels as core assets; only its hotel properties are counted here. Holdings by diversified REITs outside those seven, private funds, operating companies and individual owners are not captured, so the not-held figures in this article should be read as an upper bound.
- ADR (average daily rate): an estimated settled rate (tax-exclusive equivalent) derived by applying a segment-specific adjustment factor to each property's lowest publicly listed plan level online (two guests per room, per-room rate, tax-inclusive). Cross-checked against property-level results disclosed by listed hotel REITs (Invincible Investment Corporation's published property-level ADR, N=184 property-months, April–May 2026), the median error is about 7%. These are estimates and differ from each property's actual transacted rates and accounting figures. Area-level ADR is the median across the properties covered — the level of a typical property in that area.
- Vintage: the opening year registered in the property master. Effective renewal through renovation or rebranding is not reflected.
- Data sources: MetroEngines Research & Consulting / portfolio disclosures published by each REIT
- — Of the 5,128 properties and 1,015,610 rooms in Japan with 100+ rooms and confirmed operation, the seven listed REITs whose primary target is hotels hold 194 properties and 45,273 rooms — just 4.5% on a room basis.
- — Not held: 4,934 properties and 970,337 rooms. Extrapolated at the REITs' own median price per room, the pool is worth roughly ¥19–24 trillion — 10 to 13 times the ¥1.84 trillion the seven have spent in total.
- — 75.6% of not-held rooms sit in the 100–299-room mid-size band. At ¥2–5 billion per deal, that is below the standard ticket size of listed REITs and demands a platform able to stack up deal count.
- — 47.0% of the not-held pool opened in 2010 or later. The intuition that not-held means ageing stock does not hold, and near-term capex burden is comparatively light.
- — Within this universe, 13 prefectures contain no property held by the listed seven at all — 614 properties and 104,116 rooms. The 13,183 rooms acquired between 2019 and 2025 amount to only 5.0% of the 261,243 rooms newly supplied over the same period.
Conclusion — listed hotel REITs have touched only one-twentieth of the investable stock
Japan has 5,128 properties and 1,015,610 rooms with 100 or more guest rooms for which sales were actually observed online for near-term check-in dates. Of these, the seven listed REITs whose primary investment target is hotels hold just 194 properties and 45,273 rooms — 3.8% on a property basis, 4.5% on a room basis. Put the other way round, 4,934 properties and 970,337 rooms remain outside the listed hotel REITs.
To grasp what that means, set it against the seven REITs' combined acquisition spend. Since inception they have assembled 302 properties for roughly ¥1.84 trillion. Applying, by size band, the median price per room the REITs have themselves actually paid to the 970,337 rooms not held gives a theoretical pool value of about ¥23.7 trillion. Even applying a single median drawn only from the 100+-room properties of the three limited-service-focused REITs (about ¥19.24 million per room) yields roughly ¥18.7 trillion. The listed hotel REIT sector has left untouched a pool more than ten times the size of the assets it has taken in.
The acquisition of Hyatt Regency Tokyo (ハイアット リージェンシー 東京; opened September 1980, 712 rooms after renovation) by Japan Hotel REIT (ジャパン・ホテル・リート投資法人), announced in February 2026 at ¥126 billion, was the largest hotel purchase ever made by a domestic REIT. Even so, that single deal accounts for 0.07% of the rooms in the not-held pool and about 0.5% of its theoretical value. The pool is not of a size that any one large transaction visibly shrinks. We analysed the economics and operating performance of that deal in detail in JHR's ¥126 Billion Hyatt Regency Tokyo Acquisition — Operating Performance of the Largest REIT Deal on Record.
Cut by size — 75% of not-held rooms sit in the 100–299-room mid-size band
Breaking the universe down by room-count band shows clearly where the not-held stock piles up. The three mid-size bands — 100–149, 150–199 and 200–299 rooms — account on their own for 4,425 properties and 733,470 rooms, 75.6% of all not-held rooms. REIT penetration in these bands runs at 2.8–4.0% on a room basis, below the 4.5% overall average.
By contrast, penetration reaches 8.4% in the 300–499-room band and 6.8% above 1,000 rooms: the larger the property, the deeper listed REITs have gone. That is the rational outcome of how investment corporations behave. The bigger the ticket, the more thinly due-diligence costs and the fixed costs of operator arrangements can be spread, so large assets were taken in first. Read the other way, the 100–299-room band, where a deal runs ¥2–5 billion, falls below the standard ticket size of listed REITs, and most of that pool has therefore been left as it is. This band is the centre of gravity for portfolio build-out.
| Room-count band | Properties | Rooms | REIT-held properties | REIT-held rooms | Rooms not held | Share held |
|---|---|---|---|---|---|---|
| 100–149 rooms | 2,008 | 243,482 | 54 | 6,791 | 236,691 | 2.8% |
| 150–199 rooms | 1,372 | 235,085 | 55 | 9,353 | 225,732 | 4.0% |
| 200–299 rooms | 1,199 | 281,630 | 45 | 10,583 | 271,047 | 3.8% |
| 300–499 rooms | 409 | 148,328 | 32 | 12,509 | 135,819 | 8.4% |
| 500–999 rooms | 118 | 76,674 | 6 | 3,968 | 72,706 | 5.2% |
| 1,000+ rooms | 22 | 30,411 | 2 | 2,069 | 28,342 | 6.8% |
| Total | 5,128 | 1,015,610 | 194 | 45,273 | 970,337 | 4.5% |
Cut by vintage — the not-held stock is new, not old
The phrase not-held pool invites a picture of ageing stock that listed REITs have avoided. The data rejects that intuition. By vintage band, room-basis penetration by the listed seven is highest for properties opened in the 1990s (8.8%), followed by pre-1989 (6.0%). It is lowest for the 2010s (2.6%) and 2020 onwards (2.1%).
In other words, listed hotel REIT portfolios are concentrated in large properties built around the bubble era, and have barely reached the newer limited-service stock delivered in volume during the inbound boom. Properties opened from 2010 onwards total 2,389 properties and 466,541 rooms, of which 455,580 rooms are not held — 47.0% of the entire not-held pool. About half of the pool that has not yet been acquired consists of relatively new buildings opened since 2010, and that is the finding with the most practical consequence in this article.
That structure changes how large-scale renovation risk should be read. In the conventional discussion, which assumed ageing stock, taking in the not-held pool looked synonymous with shouldering heavy capex. In reality the core of the pool is newer buildings at or around their first equipment-renewal cycle, so near-term capital expenditure is comparatively light. The 186,503 not-held rooms opened before 1989 are a different matter: at 37 years or more since opening, decisions on renewal investment versus rebuilding or conversion are approaching, and they should be treated as a separate class of stock. We examine where that older band splits between renovation and rebuilding, using data on 588 buildings, in 236,000 Rooms Under the Old Seismic Code, 19.1% of All Rooms — Renovate or Rebuild: the Dividing Line Across 588 Buildings.
| Opening decade | Properties | Rooms | REIT-held rooms | Rooms not held | Share held |
|---|---|---|---|---|---|
| Pre-1989 | 918 | 198,344 | 11,841 | 186,503 | 6.0% |
| 1990s | 750 | 145,565 | 12,825 | 132,740 | 8.8% |
| 2000s | 1,038 | 200,462 | 9,646 | 190,816 | 4.8% |
| 2010s | 1,263 | 240,468 | 6,311 | 234,157 | 2.6% |
| 2020 onwards | 1,126 | 226,073 | 4,650 | 221,423 | 2.1% |
Cut by segment — 630,000 rooms in limited-service, listed REITs reaching just 3.3%
By segment, the principal component of the not-held pool becomes clear. Limited-service properties (the business-hotel classification) account for 3,517 properties and 652,650 rooms, 64.3% of universe rooms, with penetration by the listed seven at just 3.3%. Full-service properties (the city-hotel classification) number 732 properties and 181,344 rooms at 6.9% penetration, and the deluxe classification 109 properties and 34,446 rooms at 11.0% — the higher the rate segment, the deeper the penetration.
That distribution is consistent with how investment corporations run their strategies. Full-service assets carry a larger ticket and offer more upside under variable-rent schemes. Limited-service assets are smaller per deal and require deal count to be stacked, so building a portfolio takes time. Despite the stability advantage limited-service properties offer on occupancy, this is the segment whose absorption lags furthest behind the size of its pool.
Mid-size, limited-service
100–299 rooms × limited-service
The principal component of not-held rooms. At ¥2–5 billion per deal it falls below the standard ticket size of listed REITs, and calls for the operating capacity to stack deal count.
Newer, high-supply generation
455,580 not-held rooms opened in 2010 or later
47.0% of the not-held pool. At or around the first equipment-renewal cycle, so near-term capex burden is comparatively light.
Older stock at the renewal decision point
186,503 not-held rooms opened before 1989
37 years or more since opening. Decisions on renewal investment and conversion are close, and this stock should be assessed on a different axis from the two groups above.
Cut by area — 13 prefectures with zero properties held by the listed seven, holding 104,000 rooms
Reorganising the not-held stock by prefecture reveals the pool's geographic skew. The largest absolute volumes of not-held rooms are in Tokyo (721 properties, 164,848 rooms), followed by Osaka (435 properties, 105,050 rooms) and Hokkaido (332 properties, 68,488 rooms). Because the universe itself is large in these three, however, penetration by the listed seven reaches 4.5–5.3%, roughly the national average.
The more structural white space appears where penetration is low. Shizuoka has 167 properties and 26,724 rooms not held at 1.7% penetration; Kyoto has 213 properties and 40,560 rooms not held at 1.8%. In two prefectures carrying some of the strongest tourism demand in Japan, listed hotel REIT properties can be counted on one hand.
Going further, within this universe (100+ rooms) there are 13 prefectures containing not a single property held by the seven listed REITs whose primary target is hotels: Miyagi (114 properties, 20,941 rooms), Saitama (78 properties, 13,629 rooms), Nagasaki (60 properties, 10,837 rooms), Ibaraki (66 properties, 10,682 rooms), Akita, Shiga, Yamagata, Fukui, Wakayama, Shimane, Tottori, Saga and Tokushima. Together they hold 614 properties and 104,116 rooms — 10.7% of the not-held pool sits in prefectures that have never been selected as an investment target by a listed hotel REIT.
| Prefecture | Universe properties | Universe rooms | Properties not held | Rooms not held | Share held by REITs | Estimated settled ADR |
|---|---|---|---|---|---|---|
| Tokyo | 757 | 172,672 | 721 | 164,848 | 4.5% | ¥12,600 |
| Osaka | 454 | 109,969 | 435 | 105,050 | 4.5% | ¥8,800 |
| Hokkaido | 350 | 72,302 | 332 | 68,488 | 5.3% | ¥12,200 |
| Aichi | 236 | 47,949 | 228 | 45,986 | 4.1% | ¥8,200 |
| Fukuoka | 232 | 47,094 | 220 | 43,750 | 7.1% | ¥10,900 |
| Kyoto | 217 | 41,309 | 213 | 40,560 | 1.8% | ¥12,200 |
| Kanagawa | 185 | 38,806 | 174 | 36,686 | 5.5% | ¥12,800 |
| Chiba | 155 | 40,771 | 146 | 36,185 | 11.2% | ¥9,300 |
| Okinawa | 179 | 37,923 | 166 | 34,488 | 9.1% | ¥13,700 |
| Shizuoka | 170 | 27,181 | 167 | 26,724 | 1.7% | ¥12,700 |
| Hyogo | 135 | 25,018 | 131 | 23,926 | 4.4% | ¥12,000 |
| Miyagi | 114 | 20,941 | 114 | 20,941 | 0.0% | ¥8,800 |
Theoretical size of the pool — ¥19–24 trillion at the REITs' own acquisition prices
Now translate the size of the not-held pool into money. The reference point is the price per room the REITs have themselves actually paid. From the 286 properties among the seven REITs' holdings that disclose both room count and acquisition price, we calculated the median price per room by size band and applied it to the not-held room counts.
■ Assumptions
- Price per room is the median of each REIT's disclosed acquisition price divided by room count. Acquisition dates are spread across 1975–2025 and do not match current transaction levels.
- Medians by size band: 100–149 rooms ¥18.4M, 150–199 rooms ¥17.6M, 200–299 rooms ¥24.1M, 300–499 rooms ¥39.3M, 500+ rooms ¥35.2M.
- Sensitivity: applying a single median of ¥19.2M — from the 109 properties of 100+ rooms held by the three limited-service-focused REITs (Ichigo Hotel REIT, Invincible Investment Corporation, Nippon Hotel & Residential Investment Corporation) — gives about ¥18.7 trillion; the first quartile of ¥12.0M gives about ¥11.6 trillion and the third quartile of ¥35.2M about ¥34.2 trillion.
- This is an order-of-magnitude estimate for the pool as a whole. It takes no account of individual appraisal values, transactability or owners' willingness to sell. Only a small fraction of this pool will ever come to market.
The central case using size-band medians is about ¥23.7 trillion; the conservative case applying the three limited-service REITs' single median is about ¥18.7 trillion; the quartile range runs ¥11.6–34.2 trillion. Against that, the combined acquisition price of the 302 properties the seven listed hotel REITs have assembled since inception is about ¥1.84 trillion. The pool sits outside the sector at 10 to 13 times the assets the sector holds.
| Assumed price per room | Theoretical pool value | 1% liquidated | 3% liquidated | 5% liquidated | 10% liquidated |
|---|---|---|---|---|---|
| First quartile ¥12.0M | 11.6 | 0.12 | 0.35 | 0.58 | 1.16 |
| Median of the 3 limited-service REITs ¥19.2M | 18.7 | 0.19 | 0.56 | 0.94 | 1.87 |
| Size-band medians (central case, ¥24.4M equivalent) | 23.7 | 0.24 | 0.71 | 1.19 | 2.37 |
| Third quartile ¥35.2M | 34.2 | 0.34 | 1.03 | 1.71 | 3.42 |
Liquidation rate = an assumed share of not-held rooms whose owners actually decide to sell and bring them to market. Individual appraisal values, title arrangements and the transferability of management contracts are not factored in.
Source: MetroEngines Research & Consulting / portfolio disclosures published by each REIT (unit-price base N=286 properties)
Recast on two axes, the assumed liquidation rate moves the conclusion far more than the absolute size of the pool does. Even at the central price per room (¥24.4M), a 1% liquidation rate leaves an acquirable volume of only ¥0.24 trillion — 13% of the seven REITs' cumulative ¥1.84 trillion. If liquidation reaches 5% the figure is ¥1.19 trillion, and at 10% ¥2.37 trillion, enough to rewrite the sector's cumulative spend within a single generation. Converting the acquisition pace of the last three years (2,282 rooms a year on average) at the central price gives about ¥55.7 billion a year; at that speed even the ¥1.19 trillion implied by a 5% liquidation rate would take more than 20 years to absorb. The size of the pool is not the constraint. The constraints lie with sellers' willingness to sell and with the platform capacity to take the assets on.
Absorption speed — at the pace of the last three years, working through the pool takes over 400 years
The size of the pool means something only when set beside the speed at which it is absorbed. For the domestic properties of the four REITs whose acquisition dates can be identified from disclosure — Invincible Investment Corporation, Hoshino Resorts REIT, Ichigo Hotel REIT and Nippon Hotel & Residential Investment Corporation — we aggregated rooms by acquisition year. Over the seven years from 2019 to 2025 they acquired 84 properties and 13,183 rooms, an average of 1,883 rooms a year. The last three years (2023–2025) have recovered to 2,282 rooms a year, but even that equates to 425 years of work on a simple division into the 970,337 rooms not held. How that pace swings quarter by quarter, and how heavily it depends on a handful of large deals, is broken down by year in Hotel Capital Allocation 2026 — One Deal Is 27% of J-REIT Quarterly Acquisitions, ¥941.9 Billion Broken Down by Year.
Overlaying what happened on the supply side over the same period sharpens the picture. Properties of 100+ rooms opened between 2019 and 2025 total 261,243 rooms. The 13,183 rooms listed REITs acquired in that period are only 5.0% of newly formed stock. Far from shrinking, the pool has been building up at 20 times the speed at which listed REITs absorb it.
Two caveats apply to this comparison. First, newly supplied rooms are based on opening years in the property master and on confirmed online listings, so the most recent years are understated by listing lag. The 25,325 rooms recorded for 2025 will most likely rise as listings are added, which would push the REIT absorption ratio lower still. Second, REIT acquisitions are not confined to new builds; they include purchases from existing stock. The 5.0% above should therefore be read not as the share of new supply that REITs secured but as the ratio of absorption to the volume of flow being formed.
Supply pipeline — the pool keeps growing
The not-held pool is not a static balance. As new rooms keep arriving, the gap against the speed of listed REIT absorption widens. Extracting lodging projects of 100+ rooms scheduled for completion from 2026 onwards from planning data in the MLIT Survey of Building Construction Dynamics gives 42 projects and 9,850 rooms. By year: 18 projects and 4,787 rooms due in 2026, 15 projects and 3,488 rooms in 2027, and 7 projects and 1,375 rooms in 2028.
These figures are a floor, not a ceiling. Building confirmation applications are normally filed one to two years before opening, so counts for 2028 and beyond will certainly rise as further applications come in. Reading this as evidence that the pipeline dries up after 2028 would be wrong; it should be treated strictly as the lower bound of the confirmed pipeline as at the survey date.
| Scheduled completion | Projects | Rooms | How to read it |
|---|---|---|---|
| 2026 | 18 | 4,787 | Filed and under construction; confirmed |
| 2027 | 15 | 3,488 | Near-certain; little room for further filings |
| 2028 | 7 | 1,375 | Expected to rise as more filings come in |
| 2029 onwards | 2 | 200 | Only early filings from large redevelopments |
How to read this pool — three caveats and three implications
Before connecting these numbers to any investment decision, the limits of this aggregation should be stated plainly.
| Caveat | Detail | Effect on the figures |
|---|---|---|
| Observable ownership | REIT-held covers only the ownership master of the seven listed REITs whose primary target is hotels. Diversified REITs, private funds, operating companies holding via trust beneficiary interests and individual owners are not observable. | The 970,337 not-held rooms are an upper bound. Effective institutional ownership is higher. |
| Observable universe | Limited to properties whose sales could be observed online. Properties running mainly on direct or corporate-contract business, or allocating little inventory to online channels, may not be captured. | The 1,015,610-room universe leans towards a lower bound. This is not a complete census. |
| Timing differences in acquisition prices | The 286 properties behind the unit price were acquired across 1975–2025. Through a period of rising construction costs and land prices, older acquisitions sit below today's replacement cost. | The ¥23.7 trillion central case is prone to erring on the conservative side. |
With that said, the shape of this pool carries three implications.
First, the growth constraint on the listed hotel REIT sector is not a shortage of target properties. Against a pool of 970,337 not-held rooms worth a theoretical ¥19–24 trillion, the seven REITs have spent ¥1.84 trillion in total. There is no ceiling in the sense of running out of acquisition headroom, at least not from the property-attribute side. The constraints lie elsewhere: funding cost, operator arrangements, and sellers' willingness to sell.
Second, the principal component of the pool is mid-size, limited-service and relatively new. The 100–299-room band holds 75.6% of not-held rooms, stock opened from 2010 onwards makes up 47.0% of the pool, and limited-service properties account for 64.3% on a room basis. That centre of gravity differs from the large, full-service, older assets listed REITs have traditionally favoured. Absorbing the pool would require a platform capable of stacking up many ¥2–5 billion deals. The recent listing of new investment corporations centred on limited-service assets is explained by exactly this shift in centre of gravity.
Third, white space on the map does not mean weak demand. The 13 prefectures with no property held by the listed seven contain 614 properties and 104,116 rooms. Miyagi, the largest of them, recorded a +4.61% change in commercial land prices in the 2026 published figures; Saitama +3.2%, with Omiya Ward in Saitama City reaching +7.6%. When land prices rise, the economics of new development worsen and acquiring existing stock becomes relatively more attractive. The natural reading is not that these prefectures were overlooked as investment targets, but that few properties there reached the size and price band that listed REITs' selection criteria cover. If an operating model built on stacking mid-size assets works, this white space can be filled.
On the nature of the figures in this article: the theoretical value estimate is an order-of-magnitude approximation for the pool as a whole. It factors in none of the following: individual appraisal values, transactability, owners' willingness to sell, title arrangements, or the transferability of management contracts. Only a small fraction of this pool will ever come to market. Room counts and opening years in the property master are compiled from publicly listed values online and from materials released by each company, and may not match figures measured at individual properties.
Summary
Viewed from the held-portfolio side, hotel REITs look like a world defined by 302 properties and roughly ¥1.84 trillion. The moment the denominator is switched to the pool that has not yet been acquired, those 302 properties shrink to one-twentieth of Japan's investable stock. Of the 5,128 properties and 1,015,610 rooms in Japan with 100+ rooms and confirmed operation, the seven listed hotel REITs have secured 4.5% on a room basis. The remaining 4,934 properties and 970,337 rooms sit in the mid-size band by room count, in the post-2010 generation by vintage, in limited-service by segment, and — by area — include 13 prefectures that are entirely blank.
And over the seven years from 2019 to 2025, listed REITs took in 13,183 rooms — 5.0% of the 261,243 rooms of new stock formed in the same period. The pool has not shrunk. It has been building at 20 times the speed of absorption. Invert the hotel investment discussion from which properties are held to how much is not held, and the sector's growth headroom presents itself as a question of speed, not of balance. The next thing to test is how much of this pool could actually be liquidated — estimating sale probability from owner attributes and holding periods.
Related reading
- Hotel Capital Allocation 2026 — One Deal Is 27% of J-REIT Quarterly Acquisitions, ¥941.9 Billion Broken Down by Year
- JHR's ¥126 Billion Hyatt Regency Tokyo Acquisition — Operating Performance of the Largest REIT Deal on Record
- 236,000 Rooms Under the Old Seismic Code, 19.1% of All Rooms — Renovate or Rebuild: the Dividing Line Across 588 Buildings
- 226,000 Hotel Rooms in 32 Regional Core Cities, 42.7% Opened Before 1996 — a Renewal Headroom Map Read Through Vintage
- Seven Major Hotel REITs, May 2026 Monthly Data Compared — Operating Performance on the Eve of the Summer Peak
- 1,242 Openings and 33,749 Rooms in 2026 — 47% of Projects Are Vacation Rentals, 42% of Rooms Are Business Hotels
References and sources
■ Data sources
The target universe covers properties located in Japan with 100 or more rooms for which sales were observed online for check-in dates up to three weeks ahead of the survey date (5,128 properties, 1,015,610 rooms, as of August 2026). REIT-held refers to properties registered in the ownership master of the seven listed REITs whose primary investment target is hotels (snapshot as of 24 August 2026, 302 properties). Prefecture-level estimated settled ADR is the median across all properties in the prefecture (July 2026, N=214–1,136 properties). The supply pipeline is planning data on a building confirmation basis.
■ Estimation assumptions
The theoretical pool value is an extrapolation applying, by room-count band, the median price per room derived from each REIT's disclosed acquisition price divided by room count, to the 970,337 rooms not held. The unit price is based on the 286 properties disclosing both room count and acquisition price (Kasumigaseki Hotel REIT is excluded because its disclosure format differs). Absorption speed aggregates rooms by acquisition year for the domestic properties of the four REITs whose acquisition dates can be identified from disclosure. The liquidation rates in the two-axis sensitivity (Table 6) are assumptions, not actuals.
■ Limitations and notes
This is not a complete census and excludes properties not listed online, so the 1,015,610-room universe leans towards a lower bound. Not held here means outside the seven listed hotel REITs; because it includes holdings by diversified REITs, private funds, operating companies and individual owners, it should be read as an upper bound. The 286 properties behind the unit price were acquired across 1975–2025 and do not match current transaction levels. The theoretical value is an order-of-magnitude approximation and factors in none of the following: individual appraisal values, transactability, owners' willingness to sell, title arrangements, or the transferability of management contracts. Opening years are property-master values and do not reflect effective renewal through renovation or rebranding.
■ Market data
- MetroEngines Research & Consulting — property master (room count, opening year, location), online listed-price data, estimated settled ADR (N=5,128 properties, Japan, 100+ rooms, operation confirmed)
■ Government statistics and public data
- MLIT, Survey of Building Construction Dynamics (lodging pipeline on a planning / building confirmation basis)
- Saitama Prefecture, 2026 Published Land Prices (Saitama) — continued increases across all uses: residential, commercial and industrial (17 March 2026)
- Miyagi Prefecture, 2026 Published Land Prices (Miyagi)
- Published and benchmark land prices around Sendai Station (2026)
■ REIT and investment corporation disclosures
- Japan Hotel REIT (ジャパン・ホテル・リート投資法人), Portfolio list
- Invincible Investment Corporation (インヴィンシブル投資法人), Portfolio list
- Hoshino Resorts REIT (星野リゾート・リート投資法人), Portfolio list
- Ichigo Hotel REIT (いちごホテルリート投資法人), Portfolio
- Nippon Hotel & Residential Investment Corporation (日本ホテル&レジデンシャル投資法人)
- Mori Trust REIT (森トラストリート投資法人), Portfolio list
- Kasumigaseki Hotel REIT (霞ヶ関ホテルリート投資法人) — 15 properties, ¥49.2 billion in total acquisition price as of 31 January 2026
■ News and press materials
- Domestic REIT makes largest-ever hotel acquisition: Hyatt Tokyo for ¥126 billion, Nikkei
- Hyatt Japan, press materials, April 2026 (Hyatt Regency Tokyo: opened September 1980, 712 rooms after renovation)
Source: Hyatt Japan, press materials, April 2026