

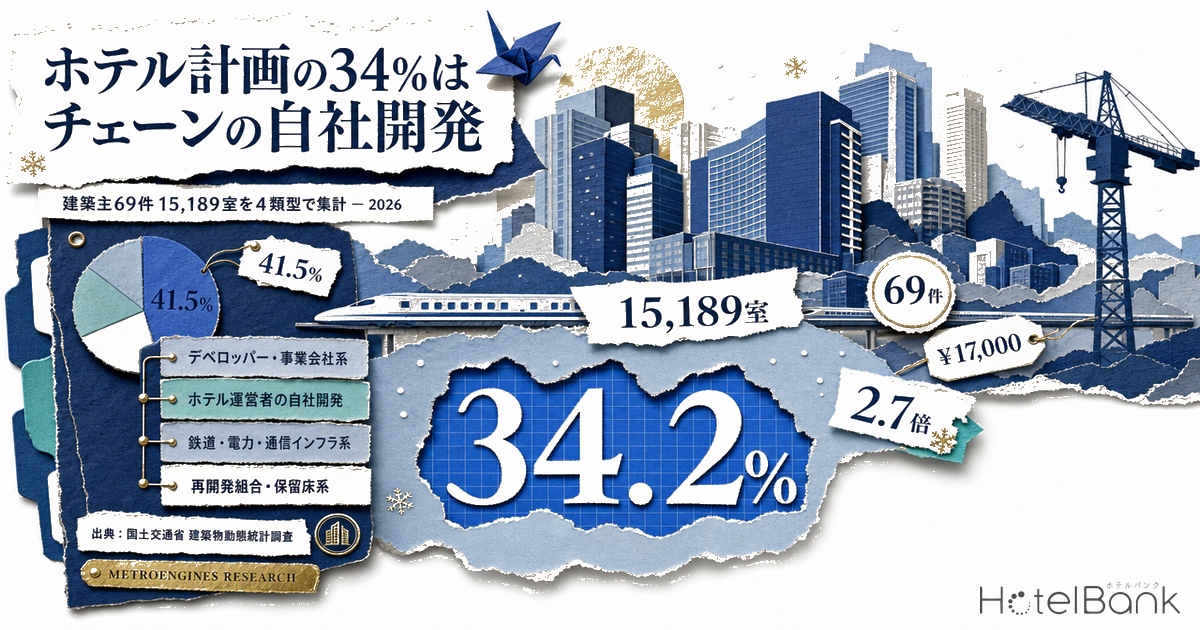
When people talk about new hotel supply, the discussion almost always narrows to “how many rooms” and “when do they open.” This article deals with the step before that: who is actually building them. We aggregated hotel projects that are planned or under construction (50 rooms or more) from Japan’s Ministry of Land, Infrastructure, Transport and Tourism (MLIT) Building Starts Statistics, and sorted the registered developer of record into four types by the lineage of capital behind the name. The point is to establish, in numbers, who you are bidding against for land — and whether that counterparty is bidding with the same cost structure you are.
Earlier articles built on the same planning dataset read it through the lens of building specifications — the period from groundbreaking to completion, floor area per room, and so on. The axis here is not the building but ownership and capital. Change whose balance sheet the land cost comes out of, and the room rate that makes a project work changes with it — even on the same site. That is where the boundary of opportunity for a new entrant sits.
- — 41.5% of rooms belong to developers and corporates (25 projects, 6,306 rooms); 34.2% to hotel operators developing for their own account (26 projects, 5,197 rooms). By project count the operators lead with 26, making them the counterparty that shows up most often as a buyer of land.
- — Operator self-development is single-use in all 26 projects. All 5 redevelopment-association projects and 9 of 11 infrastructure projects are mixed-use, so the four types are not competing for the same sites.
- — Median groundbreaking-to-completion runs 22.1 months for operators versus 67.0 months for redevelopment associations. What drives the gap is not the sponsor but the use mix: 23.7 months single-use versus 48.5 months mixed-use, almost the same spread.
- — In a 200-room model, the ADR required to clear the hurdle is about ¥6,300 with zero land cost and about ¥17,000 at the average commercial land price of Tokyo’s five central wards. That 2.7x gap cannot be closed by better occupancy or GOP.
- — The single largest supplier is APA Group at 11 projects and 2,714 rooms (17.9% of rooms). A sponsor carrying a standard design at roughly 18.8 m² of gross floor per room can bid a higher total on the same mid-size site.
Metric Definitions Used in This Article
- ADR (average daily rate): an estimated transacted rate (tax-exclusive equivalent) derived by applying a segment-specific adjustment factor to the lowest publicly listed plan rate each property posts on online travel agencies (double occupancy, per-room rate, tax-inclusive). Cross-checked against property-level disclosures from listed hotel REITs (91 properties, most recent three months), the median error is approximately 7%. These are estimates and differ from each property’s actual transacted rates and accounting figures. Area-level ADR is the median across the properties in scope (the level of a typical property in that area).
- Developer of record: the sponsoring entity named in the building plan data. Where several companies are listed jointly, we determine the capital lineage from the order of listing and which party leads the project.
- Single-use / mixed-use: single-use means the principal planned use is hotel (plus parking) only; mixed-use means the hotel is built together with offices, residential, retail or other uses.
- Occupancy: the occupancy rate used in this article’s modelling is an assumption set with reference to published figures from the Japan Tourism Agency’s Overnight Travel Statistics Survey. It differs from area-level estimated occupancy (OCC = rooms sold divided by total rooms in the area) and from any individual property’s actual results.
- GOP (gross operating profit): total revenue from rooms, food and beverage and other departments less the costs directly attributable to operations. Here GOP ratio = GOP ÷ total revenue, and GOP is used in the modelling as a proxy for NOI (net operating income).
- NOI yield: NOI ÷ total investment (land cost + construction cost). Because NOI is proxied by GOP, the figure is before property tax, insurance and FF&E reserve. Please note it therefore reads higher than a practitioner’s NOI yield.
- Groundbreaking-to-completion: months between the scheduled start date and the scheduled completion date in the plan data. For mixed-use buildings this is the schedule for the whole building, not for the hotel component alone.
- Data sources: MLIT Building Starts Statistics; MetroEngines Research & Consulting; MLIT Official Land Price Survey; Japan Tourism Agency Overnight Travel Statistics Survey
The classification — splitting developers of record into four capital lineages
The developer field in the building plan data contains 50 different name strings. Some are single names; one lists seven companies jointly. Laying them out as-is reveals no structure, so we split them into four types on a single question: what is that entity’s core business? Where a name was borderline, we gave priority to the capital lineage further upstream. JR Tokai Hotels and Hankyu Hanshin Hotels, for example, are hotel operating companies, but because the land originates from the parent group’s holdings and rail-corridor assets, we placed them under rail and infrastructure.
| Type | Developers included in this type | Projects | Rooms | Room share |
|---|---|---|---|---|
| Developers & corporates | Diversified real estate, property companies, leasing and investment firms, and general corporates — names whose core business is not hotel operation. Orix Real Estate, Mitsubishi Estate, Nomura Real Estate, Kasumigaseki Capital, Nippon Escon, Belluna and others | 25 | 6,306 | 41.5% |
| Hotel operator self-development | Hotel chains and their operating companies, including group development arms. APA Home / APA Mansion, Route Inn Japan, Kyoritsu Maintenance, Toyoko Inn, AB Hotel, Imperial Hotel, Hoshino Resorts and others | 26 | 5,197 | 34.2% |
| Rail, power & telecom infrastructure | Infrastructure operators holding their own land — rail, power, telecom — and their group companies. JR East, JR Tokai Hotels, JR West Group, NTT Urban Development, TEPCO Power Grid, Tokyu Group, Hankyu Hanshin Hotels and others | 11 | 2,476 | 16.3% |
| Redevelopment associations | Urban redevelopment associations, preparatory associations, high-quality building development associations and redevelopment companies. Where private companies are also named as project collaborators, the project still falls here if the association is the developer of record | 5 | 997 | 6.6% |
| No developer data | Projects with a blank developer field. Not filled in by inference; counted separately | 2 | 213 | 1.4% |
| Total | 69 | 15,189 | 100.0% |
Because the classification involves editorial judgment, the borderline cases are worth stating. Hulic Hotel Management is the operating arm of a real estate group, but since the developer of record is the operating company itself we placed it under operator self-development. The seven-company consortium in Naka Ward, Yokohama, led by Mitsui Fudosan also includes Keikyu Corporation and Tokyu, but we classified it by its lead company as developers and corporates. Kumoidori 5-chome Redevelopment Co. in Chuo Ward, Kobe, is not an “association,” but because it is the vehicle producing reserved floor area out of a redevelopment scheme it is included under redevelopment associations.
41.5% of rooms are developer-led, 34.2% are hotel operators building for themselves
By type, developers and corporates lead with 25 projects and 6,306 rooms (41.5% of rooms). Hotel operator self-development follows at 26 projects and 5,197 rooms (34.2%), then rail, power and telecom infrastructure at 11 projects and 2,476 rooms (16.3%), and redevelopment associations at 5 projects and 997 rooms (6.6%). Two projects totalling 213 rooms have a blank developer field; rather than infer a name we left them in a separate bucket.
Rank the same data by project count and the order flips. Operator self-development is the largest at 26 projects (37.7%), edging past the 25 of developers and corporates. Because average rooms per project run 252.2 for developers against 199.9 for operators, the room-count ranking reverses. In terms of how often a party actually appears in the market as a buyer of land, hotel operators themselves are the counterparty you meet most frequently.
Sorted by scheduled completion year: 22 projects and 5,304 rooms in 2025, 20 projects and 4,639 rooms in 2026, 17 projects and 3,618 rooms in 2027, 8 projects and 1,428 rooms in 2028, and 2 projects and 200 rooms in 2029 or later. The declining count in later years does not mean the pipeline is drying up. Building confirmation applications are normally filed one to two years before opening, so the further out the year, the more plans are simply not yet in the dataset. Figures from 2028 onward should be read as the floor of the currently confirmed pipeline.
All 26 operator projects are single-use — the four types are not fighting over the same sites
This is the metric that separates most cleanly in the whole dataset. All 26 hotel operator self-development projects, without exception, are single-use hotel buildings. By contrast, all 5 redevelopment-association projects are mixed-use, and 9 of the 11 infrastructure projects are mixed-use, leaving just 2 single-use (18%). Developers and corporates split almost evenly, with 13 single-use projects (52%).
| Type | Single-use (hotel-only building) | Mixed-use (built with other uses) | Single-use ratio | Median floors | Average rooms per project |
|---|---|---|---|---|---|
| Developers & corporates | 13 / 2,301 rooms | 12 / 4,005 rooms | 52% | 14 | 252.2 |
| Hotel operator self-development | 26 / 5,197 rooms | 0 / 0 rooms | 100% | 12 | 199.9 |
| Rail, power & telecom infrastructure | 2 / 396 rooms | 9 / 2,080 rooms | 18% | 28 | 225.1 |
| Redevelopment associations | 0 / 0 rooms | 5 / 997 rooms | 0% | 14 | 199.4 |
The difference goes beyond product type. A single-use hotel building goes up on a mid-size site that works at roughly 3,000–8,000 m² of gross floor area. A mixed-use building stacking offices, residential and retail is an order of magnitude larger, and median floor count for the infrastructure type stands out at 28. In other words, the sites hotel operators are hunting and the city blocks infrastructure players and redevelopment associations handle are simply different in size. “Competition for land” does not mean all four types blending evenly: it appears as a two-tier structure in which operators and developers converge on mid-size sites that work as single-use, while the large blocks are locked up by infrastructure and redevelopment players.
22.1 months for operators, 67.0 for redevelopment associations — who carries the time
For the 58 projects with both a scheduled start date and a scheduled completion date, we measured the months in between. Medians: 22.1 months for hotel operator self-development (N=18), 34.5 months for developers and corporates (N=24), 50.6 months for rail and infrastructure (N=11), and 67.0 months for redevelopment associations (N=5). Shortest to longest is a threefold spread.
| Type | Median start to completion | Projects measurable | Single-use ratio (repeated) |
|---|---|---|---|
| Developers & corporates | 34.5 months | N=24 | 52% |
| Hotel operator self-development | 22.1 months | N=18 | 100% |
| Rail, power & telecom infrastructure | 50.6 months | N=11 | 18% |
| Redevelopment associations | 67.0 months | N=5 | 0% |
| Reference: single-use only (across all types) | 23.7 months | N=32 | — |
| Reference: mixed-use only (across all types) | 48.5 months | N=26 | — |
It would be a mistake, however, to read this gap as a measure of sponsor competence. Ignore type and cut the data by single-use versus mixed-use alone, and you get 23.7 months single-use (N=32) against 48.5 months mixed-use (N=26) — a spread of almost the same width. Within developers and corporates the same split appears: 27.1 months single-use, 46.0 months mixed-use. What sets the duration is principally the use mix of the building, and the four types are strongly correlated with that use mix, which is why the difference surfaces along type lines. An earlier construction-period analysis found the same direction — 1.96 years single-use against 4.00 years mixed-use — and these figures are consistent with it.
The practical implication runs in the opposite direction from the sequence you might expect. On redevelopment-association projects, five and a half years pass from the urban planning decision through rights conversion, groundbreaking and completion. The capital tied up over that period, and the inflation risk carried alongside it, ultimately get priced into the acquisition cost of the reserved floor area — that is, into the rent or acquisition price the hotel operator pays. The length of time is an internal cost to the sponsor and, simultaneously, a cost of goods for the tenant moving in.
Median gross floor per room: 18.8 m² versus 75.5 m² — the same “hotel plan,” different design logic
For the 37 single-use projects with a known gross floor area, we divided gross floor area by room count to get floor area per room. The median is 18.8 m² per room for hotel operator self-development (N=23) and 75.5 m² per room for developers and corporates (N=12). Within the same planning dataset, a fourfold spread.
This is not a question of better or worse but of different products. Operator self-development skews to lodging-focused formats, designed to extract as many rooms as possible from a constrained site. APA Group’s nine projects in particular run 15.5–20.3 m² per room (median 16.4 m²), an efficient use of floor that secures more rooms from the same gross floor area. That floor efficiency is the source of the land-acquisition power discussed below.
At the top of the developer-and-corporate range, meanwhile, sit projects in Hakone (187.3 m² per room) and Kyoto (152.2 m² per room). These are resort and upper-tier products with large baths, restaurants and banquet space, committing an order of magnitude more floor per room. Among operators too, Kyoritsu Maintenance, which runs onsen-and-dining stay formats, spans 35.9–124.9 m² per room, and Imperial Hotel’s Gion, Kyoto project sits at 196.4 m² per room — the most floor-intensive of any operator self-development here.
Sites spread across 23 prefectures, Tokyo leading with 18 projects and 3,497 rooms — metro dependence is flat across types
The project sites span 23 prefectures. Tokyo leads with 18 projects and 3,497 rooms, followed by Hokkaido with 9 projects and 2,345 rooms, then Kyoto, Chiba and Kanagawa with 5 each. Hokkaido mixes large resort projects in Kutchan (500 rooms) and around Niseko with projects in central Sapporo, averaging 260.6 rooms per project — above Tokyo’s 194.3.
| Prefecture | Projects | Rooms | Avg per project |
|---|---|---|---|
| Tokyo | 18 | 3,497 | 194 |
| Hokkaido | 9 | 2,345 | 261 |
| Kyoto | 5 | 737 | 147 |
| Chiba | 5 | 2,164 | 433 |
| Kanagawa | 5 | 1,087 | 217 |
| Osaka | 4 | 1,042 | 260 |
| Hyogo | 3 | 398 | 133 |
| Saitama | 3 | 767 | 256 |
| Okayama | 2 | 490 | 245 |
| Aichi | 2 | 270 | 135 |
| Other 13 prefectures | 13 | 2,392 | 184 |
Concentration in the three major metropolitan areas (Tokyo, Kanagawa, Chiba, Saitama, Osaka, Kyoto, Hyogo and Aichi) runs 68% for developers and corporates, 65% for operator self-development, 73% for rail and infrastructure and 60% for redevelopment associations — almost no difference by type. A tidy split of “operators in the regions, developers in the centre” does not appear in this data. The difference lies not in geography but in the use mix and site size covered in the previous section.
¥6,300 required ADR at zero land cost, ¥17,000 at central Tokyo land prices — a 2.7x asymmetry
Of the four types, only rail, power and telecom infrastructure operates under a structurally different condition: because it already owns the land, no external land cost has to be injected into the project. JR East’s projects in Shinagawa, Takanawa and Shibaura, TEPCO Power Grid and NTT Urban Development in Uchisaiwaicho, and Tokyu Group in Dogenzaka all rise on land the group already holds. To size what that difference is worth, we model a 200-room, single-use hotel.
■ Model assumptions
| Assumption | Value | Basis |
|---|---|---|
| Rooms | 200 | Rounded from this dataset’s 220.1 average rooms per project and the 193.5 median for hotel operator self-development |
| Gross floor per room | 18.8 m² | Median of the 23 single-use operator self-development projects (measured in this dataset) |
| Gross floor area | 3,760 m² (1,137 tsubo) | 200 rooms × 18.8 m² |
| Construction cost rate | ¥2.405m per tsubo | 2025 nationwide steel-frame hotel cost per tsubo, based on MLIT Building Starts Statistics |
| Construction cost inflation | +5% p.a. × 2 years | A conservative figure informed by the latest year-on-year readings of the Construction Price Building Cost Index (March 2026: RC apartment buildings +5.5%, wood-frame +5.9%) |
| Construction cost (after inflation) | ¥3.02bn | 1,137 tsubo × ¥2.405m × 1.05² |
| Floor area ratio | 600% | Standard designated FAR in a commercial zone. Site area = gross floor ÷ FAR = 627 m² |
| Assumed occupancy | 82% | Set as a stabilised level informed by the Japan Tourism Agency Overnight Travel Statistics Survey: 75.3% nationwide for business hotels for full-year 2025, and 80.5% monthly for Tokyo (November 2025) |
| GOP ratio | 40% | Close to the 38.9% GOP recorded across the 91 MHM-operated properties disclosed by Invincible Investment Corporation (fiscal year ended December 2024) |
| Target NOI yield | 5.0% | Target on total investment. GOP used as a proxy for NOI |
■ Results by land condition
| Land assumption | Land cost | Total investment | Land as % of total | ADR required for target yield | NOI yield at prevailing ADR |
|---|---|---|---|---|---|
| Zero land cost (using own land) | ¥0 | ¥3.02bn | 0.0% | ¥6,298 | 11.3% |
| Average commercial land, “other wards” of the 23 wards (¥1,709,400/m²) | ¥1.07bn | ¥4.09bn | 26.2% | ¥8,535 | 8.4% |
| Average commercial land, all 23 wards (¥4,015,100/m²) | ¥2.52bn | ¥5.53bn | 45.5% | ¥11,552 | 6.2% |
| Average commercial land, five central wards (¥8,211,500/m²) | ¥5.15bn | ¥8.16bn | 63.0% | ¥17,043 | 4.2% |
The result is unambiguous. With zero land cost, an ADR of about ¥6,300 is enough to clear the 5.0% target. Buy the site at the average commercial land price of the 23 wards’ “other wards” (the 18 wards outside the five central ones) and you need about ¥8,500; at the all-23-wards average, about ¥11,600; at the five-central-wards average, about ¥17,000. Lightest to heaviest condition, a 2.7x spread.
The estimated transacted ADR for Tokyo business hotels averages ¥14,273 over the most recent 12 months (August 2025 – July 2026, N=894–924 properties). Apply that, and a zero-land-cost project still clears its target yield with ADR running 56% below the prevailing level, whereas a project bought at the all-23-wards commercial average has 19% of headroom, and at the five-central-wards average the prevailing ADR does not reach the required level at all. That is precisely why the combination of acquiring land at the average central-five commercial price and building a single-use, lodging-focused hotel does not appear even once in this dataset. Every plan standing in the five central wards shows up instead as a large mixed-use block.
■ Sensitivity analysis (ADR required for a 5.0% target NOI yield)
| Sensitivity case | Zero land cost | “Other wards” avg | 23 wards avg | Five central wards avg |
|---|---|---|---|---|
| Occupancy 75% (assumption; Japan Tourism Agency Overnight Travel Statistics Survey, full-year 2025 basis) | ¥6,885 | ¥9,331 | ¥12,630 | ¥18,634 |
| Occupancy 82% (base case; same basis) | ¥6,298 | ¥8,535 | ¥11,552 | ¥17,043 |
| Occupancy 88% (same basis) | ¥5,868 | ¥7,953 | ¥10,764 | ¥15,881 |
| GOP ratio 35% | ¥7,197 | ¥9,754 | ¥13,202 | ¥19,478 |
| GOP ratio 45% | ¥5,598 | ¥7,586 | ¥10,268 | ¥15,150 |
Push occupancy down to 75%, or squeeze the GOP ratio to 35%, and the zero-land-cost case still works below ¥7,200. Run it the other way and the five-central-wards case still needs ¥15,881 at 88% occupancy and ¥15,150 at a 45% GOP ratio — the distance to the prevailing ADR does not close (each sensitivity moves one variable at a time). The presence or absence of a land cost is not a gap that better occupancy or GOP can bridge.
In the 2026 Official Land Price Survey (as of 1 January 2026), commercial land in Tokyo rose 12.2% year on year, and 13.8% across the 23 wards. Even in the “other wards” outside the central five, the rise was 14.0% — the increase is not confined to the centre. The required ADR for a buyer of land ratchets up every year, while for a party using land it already owns it rises only by construction cost inflation. Read alongside our earlier work backing out the supportable ground rent under a leasehold structure, it becomes clear that the form of land tenure is itself a primary variable in project feasibility.
12 groups hold multiple projects — 42 projects, 8,361 rooms; the other 27 are one-offs
After consolidating groups, 39 distinct developers remain. Of these, 12 groups have two or more projects in planning, accounting for 42 projects and 8,361 rooms (55.0% of rooms). The remaining 27 projects belong to single-project sponsors — regional operating companies and one-off investment plays, widely dispersed.
| Rank | Developer (after group consolidation) | Type | Projects | Rooms | Room share |
|---|---|---|---|---|---|
| 1 | APA Group (APA Home / APA Mansion) | Hotel operator self-development | 11 | 2,714 | 17.9% |
| 2 | Mitsubishi Estate Group | Developers & corporates | 5 | 1,375 | 9.1% |
| 3 | Royal Lease | Developers & corporates | 1 | 1,000 | 6.6% |
| 4 | Route Inn Japan | Hotel operator self-development | 4 | 726 | 4.8% |
| 5 | JR East (sole and joint) | Rail, power & telecom infrastructure | 3 | 702 | 4.6% |
| 6 | Kyoritsu Maintenance | Hotel operator self-development | 4 | 642 | 4.2% |
| 7 | Belluna | Developers & corporates | 1 | 605 | 4.0% |
| 8 | Schoening Investment | Developers & corporates | 1 | 500 | 3.3% |
| 9 | Hankyu Hanshin Hotels | Rail, power & telecom infrastructure | 1 | 482 | 3.2% |
| 10 | NTT Urban Development (incl. joint) | Rail, power & telecom infrastructure | 3 | 416 | 2.7% |
| 11 | Toyoko Inn (sole and joint) | Hotel operator self-development | 2 | 406 | 2.7% |
| 12 | Mitsui Fudosan (sole and as lead company) | Developers & corporates | 2 | 406 | 2.7% |
The largest single supplier is APA Group (under the APA Home and APA Mansion names) with 11 projects and 2,714 rooms, or 17.9% of rooms. Roughly one in six of all 69 projects belongs to that group. As the previous section showed, it has standardised a floor-efficient design and can stack more rooms than rivals onto a site that works as mid-size. The ability to bid a higher total — room rate times room count — on the same piece of land is what underpins that volume. From the perspective of someone looking for land, it is a counterparty you will meet with high probability on mid-size urban sites.
Route Inn Japan follows with 4 projects and 726 rooms, Kyoritsu Maintenance with 4 and 642 rooms, and Toyoko Inn with 2 and 406 rooms (one of them jointly named with a real estate company). The leaders in operator self-development are all national chains — sponsors with standard designs and in-house construction capability. On the developer side, Mitsubishi Estate Group leads with 5 projects and 1,375 rooms, and among single projects the 1,000-room plan in Mihama Ward, Chiba (the mixed-use development in front of Kaihin-Makuhari Station) stands out.
What it means if you are looking for land — three readings
1. On mid-size sites, you are competing with operators
On sites of roughly 3,000–8,000 m² gross floor area that work as single-use, hotel operator self-development (26 projects, 5,197 rooms) and the single-use projects of developers and corporates (13 projects, 2,301 rooms) stand on the same ground. A sponsor with a floor-efficient standard design can draw more rooms from the same site, which makes it easier for them to come out on top on the price offered for the land.
2. On large blocks, you are buying time
Large mixed-use blocks are held by infrastructure players and redevelopment associations, and take 50.6 to 67.0 months from groundbreaking to completion. Entering here means acquiring or leasing reserved floor area rather than acquiring land, and the time cost carried by the sponsor is loaded into your cost base. Even in this dataset, projects arising out of redevelopment schemes — in Chuo Ward, Kobe; Kita Ward, Okayama; and Utsunomiya — account for 5 projects and 997 rooms.
3. You cannot beat a zero-land-cost counterparty on price
In the 200-room model, the ADR that makes the project work is about ¥6,300 with zero land cost and about ¥17,000 at the five-central-wards commercial average. That 2.7x gap will not be closed by improving occupancy or GOP. On blocks where a landholding party is active, the realistic move is to switch to competing on product, operations and timing rather than on price.
Frequently asked questions
Q. Does this analysis show the full picture of new hotel supply?
A. No. The scope is the 69 planned or under-construction projects with 50 rooms or more, drawn from MLIT’s Building Starts Statistics. Projects under 50 rooms, conversions of existing buildings, and plans for which no building confirmation application has yet been filed are excluded. Because applications are normally filed one to two years before opening, years from 2028 onward are structurally undercounted. Please read the figures as the floor of the currently confirmed pipeline.
Q. Does “hotel operator self-development at 34.2%” mean the chains are buying the land themselves?
A. It means the developer of record is a hotel chain or its operating company. Whether the land was acquired outright, held under a leasehold, or is a rebuild of an existing asset cannot be determined from this planning data. What is common to all of them is that, by standing as the developer of record, that entity carries the investment decision and the financing for the building.
Q. Why does the groundbreaking-to-completion period differ threefold across types?
A. The principal factor is the use mix of the building. Ignore type and split by single-use versus mixed-use, and you get 23.7 months (N=32) against 48.5 months (N=26) — a spread of almost the same width. Because all 26 operator self-development projects are single-use and all 5 redevelopment-association projects are mixed-use, the gap looks amplified when read by type. It is not an indication of how well or badly a sponsor runs its projects.
Q. Is the zero-land-cost scenario realistic?
A. Even land already owned carries an opportunity cost, so in accounting terms the book value or internal valuation of the land is added. This model shows the floor in the case where no external cash outlay for land arises; in a real investment decision the result shifts with how intra-group asset values are set. The figures are a simplified calculation intended to show how sensitive feasibility is to the land condition, and any individual project requires a detailed feasibility study.
Q. How were projects with a blank developer field handled?
A. Two projects totalling 213 rooms were blank. Rather than fill them in by inference, we counted them separately as “no developer data” and kept them in the denominator for the share calculations by type. Separately, one project (328 rooms) that appeared as two rows with the same site, room count and scheduled completion date was judged a duplicate and excluded, leaving 69 projects and 15,189 rooms in the analysis.
A note on the data
- 70 records were retrieved, but one of them (Toshima Ward, Tokyo; 328 rooms; scheduled completion September 2026) appeared as two rows with the same site, room count and scheduled completion date and was judged a duplicate, leaving 69 projects and 15,189 rooms in the analysis.
- The four-type classification of developers is the HotelBank Editorial Team’s own and is not an official categorisation. Projects with several companies named jointly are judged from the order of listing and which party leads the project. We make no assertions about group relationships beyond what the plan data states.
- Projects with a scheduled completion year of 2025 include some that have already completed and opened. Because the data is based on building confirmation applications, records remain after completion.
- Project and room counts from 2028 onward are expected to rise as further applications are filed. Please treat them as the floor of the currently confirmed pipeline.
- The modelling by land condition is a simplified calculation built on assumptions drawn from published statistics. Any actual investment decision requires a detailed, project-specific feasibility study.
Related reading
- Hotel Build Times: 2.80-Year Median, 1.96 Solo vs 4.00 Mixed-Use
- Leasehold Hotel Development: 1.38x Land Price Reach Across 9 Markets
- Tokyo 23 Wards Supply Pressure 2026: Arakawa 16.0%, Minato Just 4.5%
- Hotel Supply Pressure Ranking 2026-2027: Ozu Kumamoto Tops at 30.8%
- Kaihin-Makuhari 1,000-Room ¥30bn Mixed-Use: Breakeven ADR ¥13,200
- Policy Rate 1.00%: Break-Even ADR Across Japan’s 8 Hotel Markets
- Does New Hotel Supply Cut ADR? Only Below 13,000 Rooms, 47 Prefectures
- Frozen Pipeline & the Supply Gap: Cancelled Hotel Projects and Investor Implications
References and sources
■ Data sources
Developer of record, room counts, gross floor area and scheduled start and completion dates come from planned and under-construction projects (50 rooms or more) in MLIT’s Building Starts Statistics (Building Construction Starts Survey), retrieved on 27 August 2026. Of the 70 records retrieved, one (328 rooms) that appeared as two rows with the same site, room count and scheduled completion date was excluded as a duplicate, leaving a population of 69 projects and 15,189 rooms. The four developer types were classified by the HotelBank Editorial Team according to the capital lineage behind each name and are not an official categorisation. ADR is our estimated transacted rate (Tokyo, business hotels, 12-month average August 2025 – July 2026, N=894–924 properties); land prices are from the Tokyo Metropolitan Government Bureau of Finance’s 2026 Official Land Price table of municipal averages by use; occupancy references published figures from the Japan Tourism Agency’s Overnight Travel Statistics Survey.
■ Limitations and caveats
Because this data is based on building confirmation applications, it excludes projects under 50 rooms, conversions of existing buildings, and plans not yet filed. Since applications are normally filed one to two years before opening, years from 2028 onward are structurally undercounted and should be read as the floor of the currently confirmed pipeline. Projects with a scheduled completion year of 2025 include some that have already opened. The modelling by land condition is a simplified calculation built on assumptions drawn from published statistics: occupancy of 82% (on the basis of the Japan Tourism Agency’s Overnight Travel Statistics Survey, full-year 2025), a GOP ratio of 40% and a target NOI yield of 5.0% are all assumptions, not actual results. Because NOI is proxied by GOP, the figures are before property tax, FF&E reserve and similar deductions, and therefore read higher than a practitioner’s NOI yield. Any individual project requires a detailed feasibility study.
■ Market data
- MetroEngines Research & Consulting — aggregation of planned and under-construction hotel projects (N=69 projects, 15,189 rooms, retrieved 27 August 2026); estimated transacted ADR for Tokyo business hotels (N=894–924 properties)
■ Government statistics and public data
- MLIT, Building Starts Statistics (Building Construction Starts Survey)
- Tokyo Metropolitan Government Bureau of Finance, Official Land Prices 2026 (Tokyo) — municipal average price table by use and year-on-year change table
- Japan Tourism Agency, Overnight Travel Statistics Survey
- Geospatial Information Authority of Japan, place name search (used to locate project sites)
■ Construction cost and profitability benchmarks
- archi-book, “What level is hotel construction cost per tsubo? (2025 edition)” (compiled from MLIT Building Construction Starts Survey)
- Trends in the Construction Price Building Cost Index (March 2026: RC apartment buildings 143.3, +5.5% year on year)
- Invincible Investment Corporation, portfolio (38.9% GOP across 91 MHM-operated properties, fiscal year ended December 2024)
■ Press