

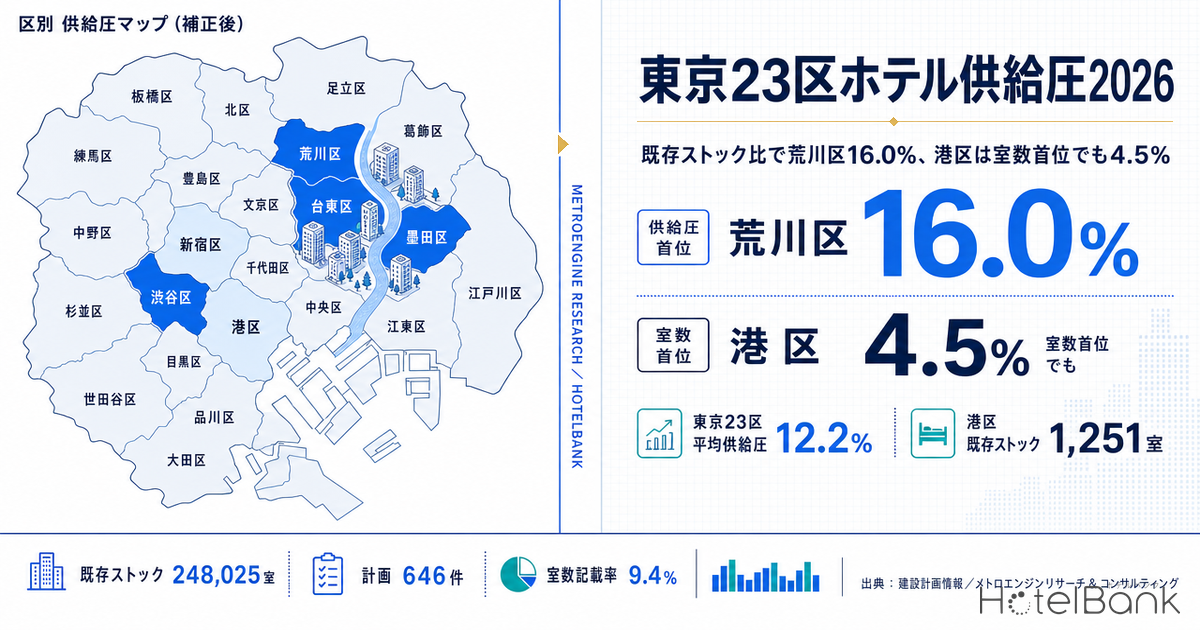
How many hotel rooms are about to land in Tokyo’s 23 wards? Answering that with absolute numbers — 1,251 rooms in Minato, 964 in Toshima — shows only half of what an investor needs. The denominator, the existing room stock, differs by nearly 20x from ward to ward. This article re-measures the incoming supply visible in construction planning records as a ratio to existing room stock: supply pressure. The ranking changes. And when we disclose how often the room-count field in the planning data is simply missing, it changes again.
Metric Definitions Used in This Article
- Existing stock: properties located in Tokyo’s 23 wards with 10 or more guest rooms whose primary business is lodging, within the scope tracked by MetroEngines Research (rental villas, cottages, minshuku, pensions, glamping, lodges and machiya are excluded). 2,439 properties, 248,025 rooms. Before exclusions the full set is 3,616 properties and 251,635 rooms.
- Incoming supply (pipeline): lodging-use projects in the construction planning records located within the 23 wards with a scheduled completion date of 1 January 2026 or later. 646 projects were identified as of the survey date. The data is based on building confirmation applications and construction plans, so project and room counts are expected to grow as further applications are filed. Treat it as a lower bound on the confirmed pipeline at this point in time.
- Supply pressure: rooms of incoming supply divided by rooms of existing stock, expressed as a percentage.
- Floor-area adjustment of room counts: for projects whose room-count field is empty but whose use can be identified as lodging-only, an estimated room count derived by dividing total floor area by 86.6 sqm per room (the median across lodging-only projects for which both room count and total floor area were available, N=70). Projects that are mixed-use with offices or retail were excluded from the estimate because the lodging portion cannot be separated out.
- Occupancy (estimated, based on OTA-listed inventory): the share of sold rooms against total rooms in the area, estimated from OTA sales inventory. It is an estimate based on how listed inventory is being taken up on OTAs and differs from a property’s actual overall occupancy.
- LT (lead time): days remaining until the check-in date. LT0 = same day.
- Data sources: MetroEngines Research & Consulting, construction planning records, MLIT “Statistical Survey on Building Construction Starts”
- — Adjusted supply pressure peaks at Arakawa, 16.0%, the highest of the 23 wards. Minato leads on absolute volume with 1,251 reported rooms, but against its existing 38,960 rooms that is only 4.5%.
- — Of the 646 construction plans across the 23 wards, only 61 — 9.4% — have the room-count field filled in. A ranking built on reported rooms alone reflects how completely the records were filed, not how supply is actually distributed.
- — Correcting for the missing values using total floor area (86.6 sqm per room, N=70) lifts Taito from 6th to 2nd and Sumida from 11th to 4th, which matches the development distribution shown by independent outside research.
- — Moving the adjustment coefficient by ±25% leaves Arakawa 1st and Taito 2nd unchanged. Below that the order does shift, and Sumida — with a fill rate of 2.7% — moves by 5.0pt.
- — Overlaying supply pressure with current inventory sell-through, Sumida (10.4%, occupancy 81.0%) and Chuo (9.1%, 83.0%) show demand capable of absorbing it, whereas Arakawa (16.0%, 66.8%) calls for a concept that reshapes the character of the market itself (occupancy is an estimate for a 19 September 2026 check-in as of LT40).
Pipeline by completion year: 2026 is the peak, but the plateau runs through 2028
Start with the overall shape. Within the 23 wards, 646 lodging-use construction plans are on record with completion scheduled for 2026 or later. Split by completion year, that is 166 projects in 2026, 261 in 2027 and 143 in 2028 — the peak in project count falls in 2027. On a room basis, however, 2026 stands out at 3,697 rooms, and from there the number of projects carrying a room count drops away quickly.
That shape — many projects, few rooms — is itself a property of planning data. The further out completion sits, the less likely the room count has been fixed, and the project is registered with the room-count field left empty. Follow rooms alone and supply appears to thin out the further into the future you look. In reality it simply has not been counted yet. The chart below stacks the total for projects with a room count on record (dark) against the portion estimated from total floor area (light).
Source: compiled by MetroEngines Research & Consulting from construction planning records (building confirmation applications and construction plans)
With the adjustment applied, 2027 adds an estimated 3,181 rooms on top of the 1,457 reported, for 4,638 in total, and 2028 reaches 4,132 — roughly level with 2026’s 4,801. In other words the supply peak is not a single year: it runs for at least three, through 2028. From 2029 the total falls to 1,159 rooms, but again that is only because confirmation applications have not yet been filed; the figure will accumulate over time. For the time axis — when a plan actually turns into rooms — we break down the gap between single-use and mixed-use projects in Hotel Build Times: 2.80-Year Median, 1.96 Solo vs 4.00 Mixed-Use.
Supply pressure by ward: put the denominator in and the ranking changes
Here is the core of it. Divide incoming supply by existing stock. Counting only projects that carry a room count, Minato leads on absolute volume at 1,251 rooms — but against its existing 38,960 rooms that is just 3.2%. Arakawa has only 179 rooms coming, yet its existing stock is only 2,013, so it comes out at 8.9%. The same 179 rooms weigh more in Arakawa than Minato’s 1,251 do in Minato.
| Ward (highest supply pressure first) | Existing rooms | Plans | Reported rooms | Supply pressure (reported) | Adjusted rooms | Supply pressure (adjusted) |
|---|---|---|---|---|---|---|
| 1. Arakawa | 2,013 | 9 | 179 | 8.9% | 323 | 16.0% |
| 2. Taito | 33,262 | 211 | 679 | 2.0% | 4,045 | 12.2% |
| 3. Shibuya | 10,420 | 27 | 783 | 7.5% | 1,084 | 10.4% |
| 4. Sumida | 7,774 | 73 | 70 | 0.9% | 808 | 10.4% |
| 5. Chuo | 33,617 | 101 | 845 | 2.5% | 3,046 | 9.1% |
| 6. Toshima | 14,714 | 15 | 964 | 6.6% | 1,074 | 7.3% |
| 7. Chiyoda | 22,095 | 39 | 949 | 4.3% | 1,298 | 5.9% |
| 8. Edogawa | 3,823 | 11 | 65 | 1.7% | 195 | 5.1% |
| 9. Minato | 38,960 | 62 | 1,251 | 3.2% | 1,744 | 4.5% |
| 10. Ota | 13,863 | 12 | 306 | 2.2% | 576 | 4.2% |
| 11. Shinagawa | 11,250 | 8 | 363 | 3.2% | 432 | 3.8% |
| 12. Koto | 12,496 | 12 | 302 | 2.4% | 340 | 2.7% |
| 13. Shinjuku | 28,476 | 60 | 11 | 0.0% | 608 | 2.1% |
Source: compiled from construction planning records / MetroEngines Research & Consulting (existing stock)
Note: the 13 wards with 8 or more planned projects are shown. Bunkyo, Katsushika, Suginami, Nakano and Meguro each have 1-2 plans; Kita, Adachi, Itabashi, Setagaya and Nerima have none (all as of the survey date).
Between the reported basis and the adjusted basis, the ranking changes once more. On reported rooms the order is Arakawa 8.9%, Shibuya 7.5%, Toshima 6.6%. Adjusted, it becomes Arakawa 16.0%, Taito 12.2%, Shibuya 10.4% and Sumida 10.4% — Taito and Sumida jump into the top group. Taito carries 211 projects and Sumida 73, but only 11 and 2 of them respectively have a room count on record. Rank by rooms alone and these two wards look far lighter than they are.
Source: compiled from construction planning records / MetroEngines Research & Consulting (existing stock)
The table below sets out how positions move between the absolute-volume ranking and the ratio ranking.
| Rank by volume | Ward | Reported rooms | Rank by adjusted supply pressure | Move |
|---|---|---|---|---|
| 1 | Minato | 1,251 rooms | 9 | ▼8 |
| 2 | Toshima | 964 rooms | 6 | ▼4 |
| 3 | Chiyoda | 949 rooms | 7 | ▼4 |
| 4 | Chuo | 845 rooms | 5 | ▼1 |
| 5 | Shibuya | 783 rooms | 3 | ▲2 |
| 6 | Taito | 679 rooms | 2 | ▲4 |
| 7 | Shinagawa | 363 rooms | 11 | ▼4 |
| 8 | Ota | 306 rooms | 10 | ▼2 |
| 9 | Koto | 302 rooms | 12 | ▼3 |
| 10 | Arakawa | 179 rooms | 1 | ▲9 |
| 11 | Sumida | 70 rooms | 4 | ▲7 |
| 12 | Edogawa | 65 rooms | 8 | ▲4 |
| 13 | Shinjuku | 11 rooms | 13 | — |
Source: compiled from construction planning records / MetroEngines Research & Consulting (existing stock)
Minato drops from 1st on rooms to 9th on supply pressure; Toshima falls from 2nd to 6th. In the other direction Taito rises from 6th to 2nd and Sumida from 11th to 4th, while Shinjuku stays 13th — but its reported figure of 11 rooms becomes essentially meaningless. For a ward that already holds a large stock, a few hundred additional rooms sit within the margin of error; for a ward with thin stock, the same volume can change the character of the market. That obvious structure only becomes visible once the denominator is included.
Disclosing the room-count gap: this is where the analysis runs out of road
There is one constraint to keep in mind when reading every figure above. Of the 646 plans in the 23 wards, only 61 — 9.4% — have the room-count field filled in. The remaining 585 have no room count on record. The 6,769 reported rooms amount to 2.73% of existing stock, but that is not the full picture: it is a lower bound accumulated from a 9.4% sample.
| Ward | Plans | With room count | Fill rate | Reported rooms | Rooms estimated from floor area |
|---|---|---|---|---|---|
| Shinjuku | 60 | 1 | 1.7% | 11 | 597 |
| Sumida | 73 | 2 | 2.7% | 70 | 738 |
| Taito | 211 | 11 | 5.2% | 679 | 3,366 |
| Chuo | 101 | 8 | 7.9% | 845 | 2,201 |
| Edogawa | 11 | 1 | 9.1% | 65 | 130 |
| Arakawa | 9 | 1 | 11.1% | 179 | 144 |
| Minato | 62 | 9 | 14.5% | 1,251 | 493 |
| Ota | 12 | 2 | 16.7% | 306 | 270 |
| Koto | 12 | 2 | 16.7% | 302 | 38 |
| Toshima | 15 | 3 | 20.0% | 964 | 110 |
| Shinagawa | 8 | 2 | 25.0% | 363 | 69 |
| Chiyoda | 39 | 10 | 25.6% | 949 | 349 |
| Shibuya | 27 | 9 | 33.3% | 783 | 301 |
Source: compiled by MetroEngines Research & Consulting from construction planning records (building confirmation applications and construction plans)
Fill rates range from 1.7% (Shinjuku) to 33.3% (Shibuya). That spread has nothing to do with how many hotels will be built in a ward — it depends on the route by which each project entered the planning records. So the lower a ward’s fill rate, the smaller its reported room count looks relative to reality. Shinjuku showing 11 reported rooms and 0.0% supply pressure does not mean rooms will barely increase in Shinjuku. It means that of 60 plans, 59 carry no room count.
The adjustment in this article is an attempt to fill that hole with total floor area, and it is not a cure-all either. In large redevelopments whose use is listed as a mix — offices, retail, hotel, other — there is no way to judge from outside what share of the floor area is guest rooms, so those projects are left out of the estimate. Projects in Chiyoda’s Otemachi and Uchisaiwaicho areas fall into this category. That means the adjusted figures still lean towards the low side, and actual incoming supply is likely to exceed them.
Source: compiled from construction planning records / MetroEngines Research & Consulting (existing stock)
The scatter plot makes the structure plain. Wards with large existing stock on the horizontal axis — Minato, Chuo, Taito, Shinjuku — tend to cluster to the lower right, on the relatively low supply-pressure side. Within that group, Taito stands out for sitting towards the upper right. It carries the third-largest stock in the 23 wards at 33,262 rooms and still builds up adjusted supply pressure of 12.2%. As the size of the bubble (211 plans) shows, the sheer number of projects is an order of magnitude above the other wards.
Sensitivity of the adjustment coefficient: moving 86.6 sqm per room by ±25%
The adjusted figures depend entirely on a single coefficient: 86.6 sqm per room. It is worth checking how far the conclusions hold when that coefficient moves. We swung the 86.6 sqm median by ±25%, setting a high-density case at 65.0 sqm (more rooms from the same floor area) and a large-room case at 108.3 sqm. Reported rooms stay as they are; only the estimated rooms rise and fall in inverse proportion to the coefficient.
| Ward | Room-count fill rate | 65.0 sqm/room (high density) | 86.6 sqm/room (median — used here) | 108.3 sqm/room (large rooms) | Range width |
|---|---|---|---|---|---|
| Arakawa | 11.1% | 18.4% | 16.0% | 14.6% | 3.8pt |
| Taito | 5.2% | 15.5% | 12.2% | 10.1% | 5.4pt |
| Sumida | 2.7% | 13.5% | 10.4% | 8.5% | 5.0pt |
| Shibuya | 33.3% | 11.4% | 10.4% | 9.8% | 1.6pt |
| Chuo | 7.9% | 11.2% | 9.1% | 7.7% | 3.5pt |
| Minato | 14.5% | 4.9% | 4.5% | 4.2% | 0.7pt |
| Shinjuku | 1.7% | 2.8% | 2.1% | 1.7% | 1.1pt |
| 23 wards total | 9.4% | 7.5% | 6.3% | 5.6% | 1.9pt |
Source: HotelBank Editorial Team calculations from construction planning records / MetroEngines Research & Consulting (existing stock)
Two things stand out. First, the robustness of the ranking. Arakawa 1st and Taito 2nd holds in all three cases. The central conclusion of this article — that two wards invisible in absolute terms come out on top on supply pressure — does not depend on how the coefficient is set. Below that, positions do move. Sumida is 3rd in the high-density case (13.5%) but drops to 4th in the large-room case (8.5%), swapping with Shibuya. The finer ordering should not be read as settled.
Second, the size of the sensitivity is almost fully explained by the room-count fill rate. Shibuya, with a 33.3% fill rate, has a range of 1.6pt, and Minato at 14.5% moves only 0.7pt. Reported rooms already account for most of their totals, so changing the coefficient on the estimated portion barely moves the whole. Conversely Sumida at a 2.7% fill rate moves 5.0pt and Taito at 5.2% moves 5.4pt. For these two wards the numbers are in practice almost entirely estimates and can only be read as a range. Rather than treating Taito’s “12.2%” as a point, “somewhere between 10% and 15%” is the right distance to keep from this data.
Cross-checking against outside research: the conclusion that Taito and Sumida rank high holds up
Rather than closing the loop on our own data alone, it is worth testing against independent outside research. According to the Tokyo 23 Wards Hotel Development Trends Survey by real-estate research firm Mercury (株式会社マーキュリー), 113 newly built hotels are scheduled for completion in 2026 — the most since the COVID-19 pandemic. Total gross floor area across those buildings reaches 1.4x the previous peak year of 2020 (161 buildings). The same survey states that “looking at completions from 2026 onward, Taito, Chuo and Sumida account for the top positions,” and that Chiyoda is largest by gross floor area, with the major Otemachi and Uchisaiwaicho redevelopments scheduled for completion in 2027.
That is consistent with the adjusted ranking here. The top of adjusted supply pressure is Arakawa, Taito, Shibuya, Sumida and Chuo — three of which, Taito, Sumida and Chuo, overlap with what the Mercury survey points to. Put the other way: looking only at the reported-rooms ranking (Arakawa, Shibuya, Toshima, Chiyoda) would have missed Taito and Sumida entirely. The outside research supports the view that adjusting the missing room counts with floor area was the right direction of travel.
The project counts sit at different levels. Against the Mercury survey’s 113 buildings completing in 2026, this article counts 166 projects completing in 2026. The gap is explained by how the populations are defined. The Mercury survey counts newly built hotel buildings; the construction planning records used here also pick up extensions and renovations, small projects, and the lodging portion of mixed-use buildings, each as one project. Count buildings and you get 113; count at the granularity of plans and you get 166. Note also that Mercury’s published materials give 86 projects completing in 2026, 44 in 2025 and 161 at the 2020 peak — the aggregates are updated depending on the survey date.
As a macro cross-check, look at construction starts for lodging-industry buildings in Tokyo in MLIT’s “Statistical Survey on Building Construction Starts.” It is a different cut — construction starts, and all of Tokyo rather than the 23 wards — but it confirms the phase of the supply cycle.
Source: compiled by the HotelBank Editorial Team from MLIT “Statistical Survey on Building Construction Starts” (e-Stat)
Building count peaked at 213 in 2019, fell to 35 in 2021, and has recovered to 67 in 2024. What deserves attention is floor area: 2024 recorded 530,755 sqm, the highest in the statistics. Building count is less than a third of 2019 while floor area is at a record — projects are fewer but each is larger. The pattern the Mercury survey identified, fewer buildings than 2020 but 1.4x the gross floor area, is observable in the same shape from the construction-starts side. Supply in the form of hotels embedded in large mixed-use developments in central Tokyo has become the mainstream of the past few years.
Another layer that adds to supply depth
When arguing about the depth of room supply, counting hotel plans alone misses a layer of the real market. Within a 2 km radius of the Asakusa View Hotel (浅草ビューホテル), against 242 hotels and 16,997 rooms there are 3,371 listed short-stay rental units with capacity for 15,408 guests — 90.7 guest places per 100 hotel rooms. Composition matters more than the total, though: of those 3,371 listings the 3-4 guest band is the thickest at 1,534 (45.5%), average floor area is 44.8 sqm (N=1,284), and by building type apartments and condominiums account for 2,377 (70.5%). They do not compete directly with single- and twin-room business hotels; they absorb family and group demand. In assessing incoming supply in Taito, how much capacity this layer already holds is a precondition for any plan aimed at multi-guest rooms chasing the same demand.
| Capacity band | Listings | Share | Building type | Listings | Share |
|---|---|---|---|---|---|
| 1-2 guests | 624 | 18.5% | Apartment / condominium | 2,377 | 70.5% |
| 3-4 guests | 1,534 | 45.5% | Detached house | 387 | 11.5% |
| 5-6 guests | 693 | 20.6% | Guest room | 339 | 10.1% |
| 7-10 guests | 402 | 11.9% | Serviced apartment | 94 | 2.8% |
| 11 or more guests | 118 | 3.5% | Other (condominium, etc.) | 174 | 5.2% |
Source: MetroEngines Research (2 km radius centred on the Asakusa View Hotel, N=3,371, listed inventory as of January 2027 / data retrieved 14 August 2026)
Source: MetroEngines Research (250 m mesh aggregation, 2 km radius centred on the Asakusa View Hotel, listed inventory as of January 2027)
“Minpaku” here is not limited to private lodging under the Private Lodging Business Act: it refers to listed short-stay inventory including properties operating under the Hotel Business Act and under National Strategic Special Zone rules (special-zone minpaku). Listing counts therefore do not match the number of registrations filed with the authorities. Because properties governed by different statutes are mixed together and the regulatory environment differs by municipality, keep this difference in regulatory regime in mind when comparing counts across areas.
Reading absorption capacity: overlay supply pressure with current sell-through
High supply pressure is in itself neither a mark of a ward’s appeal nor of its risk. What a judgement needs is the demand side laid over it: how much inventory that ward is taking up right now. Below, for check-in on Saturday 19 September 2026, we line up inventory sell-through by ward as of 40 days’ lead time. Because check-in date and lead time are held constant, the wards can be compared with each other.
| Ward | Supply pressure (adjusted) | Occupancy at LT40 (estimated) | Observed / target properties | Reading |
|---|---|---|---|---|
| Arakawa | 16.0% | 66.8% | 19/21 | Ramp-up design matters |
| Taito | 12.2% | 77.9% | 224/228 | Ramp-up design matters |
| Shibuya | 10.4% | 75.1% | 38/40 | Ramp-up design matters |
| Sumida | 10.4% | 81.0% | 42/44 | Room to absorb |
| Chuo | 9.1% | 83.0% | 168/169 | Room to absorb |
| Toshima | 7.3% | 79.5% | 63/64 | Steady-state range |
| Chiyoda | 5.9% | 81.1% | 89/92 | Steady-state range |
| Edogawa | 5.1% | 88.5% | 22/22 | Demand side is deep |
| Minato | 4.5% | 75.2% | 151/155 | Steady-state range |
| Ota | 4.2% | 81.8% | 63/64 | Steady-state range |
| Shinagawa | 3.8% | 84.9% | 41/43 | Demand side is deep |
| Koto | 2.7% | 88.2% | 44/44 | Demand side is deep |
| Shinjuku | 2.1% | 85.3% | 119/122 | Demand side is deep |
Source: MetroEngines Research; compiled by the HotelBank Editorial Team
Note: “observed properties” in this table are those whose publicly listed OTA inventory could be tracked continuously, a different population from the existing-stock aggregate given above (2,439 properties, 248,025 rooms). Room counts quoted alongside sell-through in the text are totals for the observed properties and do not match the room counts of existing stock.
Wards where supply pressure is high and current sell-through is also strong — Sumida (supply pressure 10.4%, occupancy 81.0%, estimated for a 19 September 2026 check-in as of LT40) and Chuo (9.1%, 83.0%) — can be read as already having demand-side capacity to take the incoming supply. Chuo’s inventory is roughly five times as deep as Sumida’s 5,277 observed rooms, and it has taken up 83.0% of its 25,028 observed rooms by LT40. Even with 3,046 rooms added, the pace of take-up seen so far puts it in a range that can be absorbed.
Taito (12.2%, 77.9%) sits in between. It carries 228 observed properties and 19,779 rooms — the largest property count in the 23 wards — and reaches 77.9% at LT40. Supply pressure ranks second, but existing take-up leaves a little slack. For a new entrant this becomes a design question: rather than fighting on the same ground as existing properties, how to capture the multi-guest, kitchen-equipped demand layer described in the previous section. Because the 3-4 guest band is already thickly supplied in this market, what you can add on top of that layer will determine how quickly a property ramps up.
Arakawa (16.0%, 66.8%) has a different character. It is a small market — 2,013 existing rooms, 19 observed properties — and its LT40 occupancy of 66.8% (estimated for a 19 September 2026 check-in as of LT40) is the lowest among the wards covered here. Supply pressure of 16.0% is the highest in the 23 wards, but with a small base a single project added or removed moves the figure substantially, which is worth noting. Rather than filing this under “room to absorb,” it is closer to reality to see it as an area with room to change the character of the existing market itself. How the flow of visitors from Ueno and Nippori is combined with the price bands Arakawa already has could redraw the outline of the market.
Source: MetroEngines Research; compiled by the HotelBank Editorial Team
In the other direction, wards where supply pressure is low and sell-through is strong — Koto (2.7%, 88.2%), Shinjuku (2.1%, 85.3%) and Shinagawa (3.8%, 84.9%) — have depth on the demand side while the planning data shows thin incoming supply. But the missing-data point applies here too. Shinjuku carries 60 plans with a room count recorded for only one, so its 2.1% supply pressure is built almost entirely from floor-area estimates. The conclusion “supply is thin in Shinjuku” should not be drawn from that number alone.
Summary: keep three denominators in mind
Translated into practice, this analysis leaves three denominators to keep in view when making an investment judgement.
First, existing stock. Minato’s 1,251 rooms and Arakawa’s 179 become 3.2% and 8.9% once run through denominators of 38,960 and 2,013 rooms — and the meaning reverses. If you are assessing incoming supply in a ward where you hold a property, check the denominator first.
Second, the rate of missing room counts. Only 9.4% of the 646 plans across the 23 wards have a room count recorded. A ranking based on rooms partly reflects how completely records were filed rather than how supply is distributed. Compare supply pressure without looking at fill rates of 5.2% in Taito, 2.7% in Sumida and 1.7% in Shinjuku, and you will systematically underestimate those three wards. Apply the floor-area adjustment and Taito comes to 12.2% and Sumida to 10.4%, matching the development distribution shown by outside research.
Third, the demand side’s capacity to take it up. Overlaying inventory sell-through measured on a constant check-in date and constant lead time shows whether supply pressure sits in a range that can be absorbed. Wards like Sumida and Chuo, high on both supply pressure and take-up, have demonstrable capacity; a ward like Arakawa, where supply pressure is exceptionally high and the market is small, rewards a design that reaches for upside outside the existing frame.
Every figure here is a lower bound at this point in time, on a building-confirmation basis. Plans look thin from 2028 onward not because supply is tapering but because the applications have not been filed yet. We would suggest updating both numerator and denominator quarterly and watching them together.
⚠ On the treatment of forward-looking data: The incoming supply in this article is based on projects identifiable as building confirmation applications or construction plans as of the survey date, and is a lower bound at this point in time; project and room counts are expected to increase as further applications are filed. Inventory sell-through for September 2026 check-in is likewise an estimate based on inventory publicly listed on OTAs and elsewhere as of the survey date, and will move as the check-in date approaches.
Related reading
- Tokyo 2026: 2,055 New Rooms, 55.6% Business Hotels, ADR Turns Negative
- Median 39.2% of Rooms Online — Allocation Across 12,941 Hotels
- Hotel Build Times: 2.80-Year Median, 1.96 Solo vs 4.00 Mixed-Use
- 1,002 New Japan Openings H1 2026: ADR 1.14x, Ryokan Lag +18.8pt
References and Sources
■ Data sources
MetroEngines Research & Consulting property master (Tokyo 23 wards, 10 or more rooms, lodging as primary business; 2,439 properties, 248,025 rooms); construction planning records (building confirmation applications and construction plans; 646 projects in the 23 wards with completion scheduled from 1 January 2026); estimated inventory sell-through from continuous observation of publicly listed OTA inventory (check-in 19 September 2026, as of LT40); listed short-stay inventory (2 km radius centred on the Asakusa View Hotel, N=3,371, data retrieved 14 August 2026); MLIT “Statistical Survey on Building Construction Starts” (e-Stat statistics ID 0003114490, Tokyo, lodging-industry buildings).
■ Calculation assumptions
Supply pressure = rooms of incoming supply / rooms of existing stock. For projects with an empty room-count field whose use can be identified as lodging-only, room counts were estimated by dividing total floor area by the median across lodging-only projects for which both room count and total floor area were available (86.6 sqm per room, N=70). Mixed-use projects with offices or retail were excluded from the estimate because the lodging portion cannot be separated out. For the sensitivity check the coefficient was swung to the median ±25% (65.0 sqm / 108.3 sqm) to confirm the range of supply pressure and the robustness of the ranking. Inventory sell-through is compared across wards on a constant check-in date and constant lead time (LT40).
■ Limitations and caveats
Construction planning records are on a building-confirmation basis, and project and room counts will accumulate further as applications are filed. The supply pressure in this article is a lower bound on what can be confirmed today. Room-count fill rates range from 1.7% to 33.3% by ward, and the lower the fill rate, the smaller the reported figures look relative to reality. Because large mixed-use redevelopments are excluded from the estimate, the adjusted values also lean low. Inventory sell-through is an estimate based on publicly listed OTA inventory, differs from a property’s actual overall occupancy, and the population of observed properties does not match the existing-stock aggregate. Listed short-stay inventory does not match the number of registrations filed with the authorities and mixes properties governed by different statutes — the Private Lodging Business Act, the Hotel Business Act and National Strategic Special Zone rules.
■ Market data
- MetroEngines Research & Consulting — existing room stock in Tokyo’s 23 wards (2,439 properties, 248,025 rooms), construction planning records (646 projects), estimated inventory sell-through
- MetroEngines Research — supply composition of listed short-stay inventory (2 km radius centred on the Asakusa View Hotel, N=3,371)
■ Government statistics
- MLIT “Statistical Survey on Building Construction Starts” (e-Stat statistics ID: 0003114490, Tokyo, lodging-industry buildings, 2014-2024)
■ External research and press