

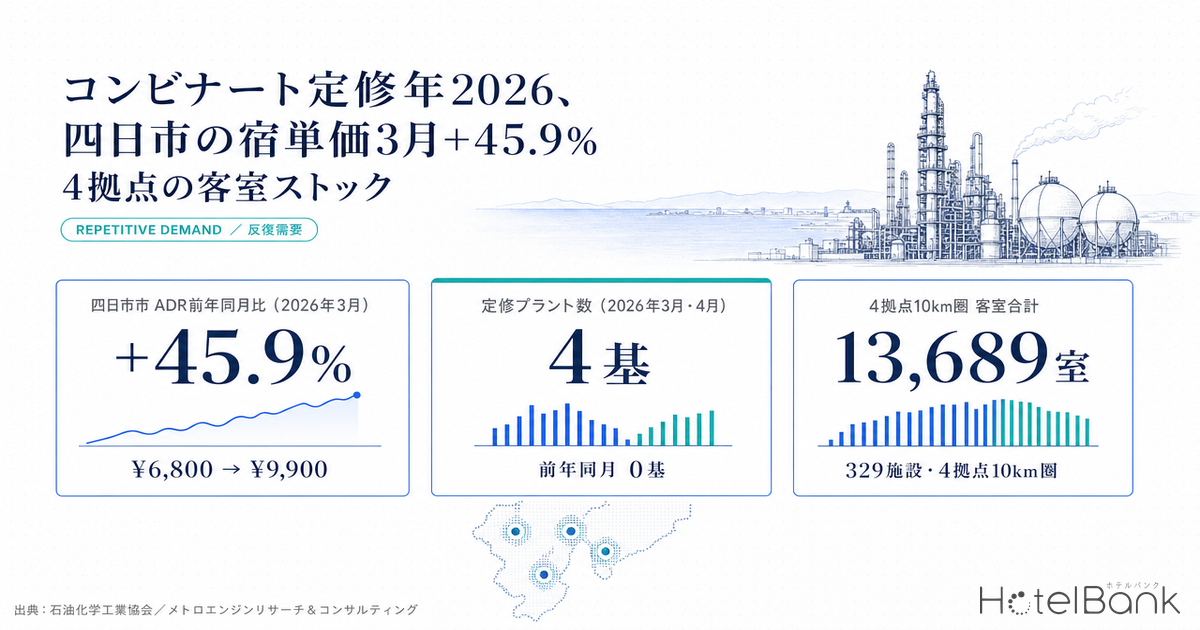
A turnaround at a petrochemical complex — the scheduled maintenance shutdown in which plants are stopped and equipment opened for inspection — comes around only once every few years. When it does, inspection, piping, insulation and scaffolding technicians converge from across Japan, and for the duration of the work they book hundreds of nearby hotel rooms at a time. In 2026, those turnarounds overlapped across Japan’s naphtha crackers all at once. Tracking the monthly performance memos published by the Japan Petrochemical Industry Association (JPCA) shows four crackers under turnaround in both March and April 2026. In the same months a year earlier, the figure was zero.
This article examines four complexes — Yokkaichi (Mie), Ichihara (Chiba), Mizushima (Kurashiki, Okayama) and Oita — and cross-references the concentration of turnarounds, the surrounding room stock, the movement actually observed in room rates, land prices and zoning restrictions, and the supply pipeline. The semiconductor clusters, data centres, offshore wind projects and decommissioning sites HotelBank has covered previously all generate one-off construction-phase demand: a peak spanning the few years from groundbreaking to completion, after which it disappears. Turnaround demand is different in kind. It repeats on a multi-year cycle, returning to the same place at the same scale each time. The investment question shifts accordingly — not “how do we capture the peak?” but “how do we evaluate and smooth NOI (net operating income) that swings on a four-year cycle?” Our earlier piece “Mie August Booking Curves: Business Hotels Swing 25.5pt, Ryokan 9.7pt” covered booking curves for Mie Prefecture as a whole, where Yokkaichi appears only as one component of business demand. Here we treat Yokkaichi on its own terms, as the lodging base for turnaround demand.
Metric Definitions Used in This Article
- ADR (average daily rate): an estimated settled rate (tax-exclusive equivalent) calculated by applying a segment-specific adjustment coefficient to the lowest published plan rate each property lists on OTAs and similar channels (double occupancy, per-room rate, tax-inclusive). Cross-checked against property-level actuals disclosed by listed hotel REITs (91 properties, most recent three months), the median error is approximately 7%. These are estimates and differ from each property’s actual transacted rates and accounting figures. Area-level ADR is the median across the properties in scope (the level of a typical property in that area).
- Occupancy rates cited in this article: quoted directly from the property-level occupancy each REIT discloses monthly. Our own estimated occupancy is not used. Occupancy figures used in the modelling are explicitly stated assumptions.
- GOP (gross operating profit): revenue less costs directly attributable to operations, such as payroll and utilities — profit before deducting rent, depreciation and interest expense. The modelling in this article applies an assumed GOP margin to room revenue and therefore differs from GOP as reported in financial accounts.
- Number of plants under turnaround: the count of naphtha crackers recorded in the Japan Petrochemical Industry Association’s monthly “Performance Overview (Memo)” as having undergone scheduled maintenance in the month concerned.
- Room stock: the number of lodging properties and rooms located within straight-line distance bands from each complex’s centre point, to the extent captured by MetroEngines Research.
- Data sources: MetroEngines Research & Consulting / Japan Petrochemical Industry Association / MLIT Real Estate Information Library / MLIT Building Construction Starts Statistics (e-Stat)
- — Four crackers were under turnaround in March and April 2026 (zero in the same months a year earlier). Countable in the JPCA’s monthly memos, this was the year in which four-year-cycle repeat demand fired simultaneously.
- — Yokkaichi’s estimated settled ADR rose 45.9% year on year in March 2026 (¥6,806 → ¥9,932, N=26 properties). The 10km compset (N=19) was also up 37.2%, with rates moving in step with the turnaround work window.
- — Lodging capacity varies by as much as 8.3x across the four complexes. Within 5km, Yokkaichi has 3,023 rooms against Oita’s 364. At Mizushima (Kurashiki), where the population of properties is large and leisure demand carries more weight, the lift is diluted and never surfaces in rates.
- — For a 150-room limited-service hotel, GOP in a turnaround year is +12.8% (¥122.4m → ¥138.1m); annualised over four years the contribution is +¥3.9m. Against an estimated new-build cost of roughly ¥4.45bn that is 0.09% — not a basis for development.
- — Mizushima faces production consolidation targeted for fiscal 2030, giving its repeat demand an end date. If you underwrite on cyclicality, you also have to count how many cycles are left.
Four plants under turnaround simultaneously in March–April 2026 — against zero a year earlier
The turnaround cycle is tied to the continuous-operation period permitted by law. Under the certified operator system of the High Pressure Gas Safety Act, a certified plant may run continuously for four years or such other period as approved by the minister, and facilities holding “super certification” may set their own interval of up to eight years. In other words, “once every four years” is not an industry custom but a periodicity that falls out of how the rules are designed. Crasus Chemical (Oita) states as much on its own website: “In 2026 we plan to carry out the major scheduled maintenance of our ethylene cracker, which takes place once every four years.”
The degree of concentration can be counted mechanically from the JPCA’s monthly performance memos. The chart below sets the number of crackers under turnaround in each month side by side for 2025 and 2026. In 2025, January through April were zero and one or two crackers were sporadically down between May and August. In 2026 there was one in January, two in February, and then four shut down simultaneously in March and April. Ethylene output fell to 272,600 tonnes in March, down 38.8% year on year.
One caveat is in order. The 2026 output decline was not caused by turnarounds alone. For June 2026 the JPCA broke the decline down as “turnaround-related factors -5.8%, utilisation-rate variation -13.3%”, with difficulty sourcing naphtha following the effective closure of the Strait of Hormuz at the end of February contributing at the same time. The size of the production drop cannot be read directly as the scale of turnaround activity. What matters for lodging demand is not output volume but the number of plants shut down and the length of the work window. Turnarounds go ahead as scheduled even when feedstock is not arriving; if anything, a longer shutdown widens the window for the work. At Tosoh’s Yokkaichi Complex (Yokkaichi, Mie), the major turnaround scheduled for March–April was followed by a restart that was postponed because of the naphtha shortage, with the plant eventually coming back online on 25 April.
Lodging capacity differs by up to 8.3x — 364 rooms within 5km at Oita against 3,023 at Yokkaichi
Turnaround technicians want to be as close to the site as possible, but petrochemical complexes sit almost without exception in exclusive industrial districts, and there are no hotels next door. In practice they stay within “car or bus commuting range”. We therefore counted the properties and rooms captured by MetroEngines Research in 5km, 10km and 15km distance bands from each complex’s centre point.
| Location | Within 5km | Within 10km | Within 15km | Opened since 2020, within 15km |
|---|---|---|---|---|
| Yokkaichi (Yokkaichi, Mie) | 50 properties, 3,023 rooms | 69 properties, 3,395 rooms | 136 properties, 6,896 rooms | 25 properties, 731 rooms |
| Ichihara (Ichihara, Chiba) | 39 properties, 1,550 rooms | 75 properties, 3,530 rooms | 184 properties, 10,779 rooms | 27 properties, 2,371 rooms |
| Mizushima (Kurashiki, Okayama) | 38 properties, 1,392 rooms | 139 properties, 5,128 rooms | 174 properties, 5,881 rooms | 33 properties, 981 rooms |
| Oita (Oita, Oita) | 9 properties, 364 rooms | 46 properties, 1,636 rooms | 109 properties, 7,062 rooms | 6 properties, 818 rooms |
The structural differences are stark. Yokkaichi has 3,023 rooms within 5km, and the cluster of business hotels in front of Kintetsu Yokkaichi Station serves directly as the base for turnaround work. Ichihara is thin within 5km at 1,550 rooms, but thickens rapidly to 3,530 at 10km and 10,779 at 15km, because central Chiba City comes into range. Mizushima reaches 5,128 rooms within 10km, most of them around Kurashiki Station. And Oita has just 9 properties and 364 rooms within 5km, the thinnest of the four, rising only to 1,636 rooms at 10km. The main hotel cluster in front of Oita Station sits 13–15km from the complex. Compared within 5km, Yokkaichi holds 8.3 times as many rooms as Oita.
| Neighbourhood commercial district | 14 parcels |
| Category I residential district | 7 parcels |
| Category II mid/high-rise exclusive residential district | 7 parcels |
| Commercial district | 6 parcels |
| Category II residential district | 6 parcels |
Yokkaichi’s estimated settled ADR rose 45.9% year on year in March 2026 — Mizushima shows nothing
So did the turnarounds actually move room rates? We compared estimated settled ADR at the municipal level against the same month a year earlier, restricted to months on a consistent actuals basis (through July 2026). Future months are estimates based on currently listed rates and sit on a different basis from actuals months, so they are excluded from the year-on-year comparison.
Yokkaichi was up 45.9% year on year in March (estimated settled ADR ¥6,800 → ¥9,900), clearly separated from the other three cities. That is exactly the window in which Tosoh’s Yokkaichi Complex ran its March–April turnaround. April reversed to -10.0%, suggesting demand peaks early, in the ramp-up phase of the work. Oita had two peaks — +21.4% in January and +11.1% in March — while Ichihara clustered at the start of the year, +16.1% in January and +25.0% in February. Kurashiki, by contrast, had almost no positive months across 2026, running below the prior year at -13.4% in May and -25.9% in June.
Because municipal aggregates also sweep in leisure demand and other business demand, we ran the same calculation on a compset (comparison group) limited to properties within 10km of a complex with 30 or more rooms. The results point in much the same direction as the municipal figures.
| Location | Properties | 2025 average | Largest lift month, 2026 | YoY that month |
|---|---|---|---|---|
| Yokkaichi | N=19 | ¥7,455 | March ¥10,535 | +37.2% |
| Oita | N=9 | ¥5,431 | January ¥7,033 | +28.8% |
| Ichihara | N=24 | ¥6,982 | February ¥7,946 | +6.0% |
| Mizushima | N=32 | ¥8,310 | March ¥8,421 | -0.7% |
Where the difference comes from is readable once you set this against the room stock in Table 1. Yokkaichi has 3,023 rooms within 5km, and the 19 business-oriented properties in front of Kintetsu Yokkaichi Station form the core of the compset. Turnaround demand lands squarely on that narrow trade area, so it showed up in rates without much interference. Oita has only 364 rooms within 5km to begin with, making it easy for demand to concentrate on scarce inventory. Mizushima, by contrast, has most of its 5,128 rooms within 10km around Kurashiki Station, mixed in with leisure demand for the Bikan Historical Quarter. The larger the population of properties, and the heavier the weight of leisure demand, the more the lift from repeat demand is diluted until it becomes invisible. This is the same structure we found in the semiconductor-cluster rate analysis in “TSMC Fab 2 & Kumamoto’s Chip Corridor: Kikuyo–Koshi–Ozu ADR 2024–2026”: whether a demand event can be detected in rates is determined not by the size of the demand but by the dilution rate on the supply side.
Land prices up 9.2% at Ichihara and 4.7% at Oita against 0.5% around Mizushima — trade areas are diverging
As background to the investment case, we checked land prices and building regulations at each location from the MLIT Real Estate Information Library. For commercial land in the 2026 Published Land Prices, we aggregated the standard sites within the tiles covering each location’s lodging cluster.
| Location | Highest site | YoY | Dominant zoning |
|---|---|---|---|
| Yokkaichi | ¥495,000/sqm (Kintetsu Yokkaichi) | +6.9% | Neighbourhood commercial / commercial |
| Ichihara | ¥319,000/sqm (Goi) | +7.8% | Category I low-rise residential / Category I residential |
| Mizushima | ¥77,700/sqm (Kojima) | +0.5% | Exclusive industrial / quasi-industrial |
| Oita | ¥754,000/sqm (Oita) | +4.1% | Commercial / Category I residential |
Commercial land at Ichihara (Goi) is rising fastest of the four at a median +9.2% year on year, but the sample is small at n=3 and logistics and residential demand around Tokyo Bay is mixed in. Yokkaichi is up 2.6% and Oita 4.7% — steady increases. The area around Mizushima is up just 0.5%, essentially flat. Mizushima’s zoning is also dominated by exclusive industrial and quasi-industrial districts, which limits the parcels on which a hotel could be built at all. Land pricing that is not moving indicates a market expectation of the status quo for this trade area.
Positioning within 10km of Yokkaichi — the business tier above ¥16,000 is empty
For Yokkaichi, where turnaround demand showed up most clearly in rates, we mapped the 19 properties within 10km with 30 or more rooms by room count and estimated settled ADR. The horizontal axis is room count, the vertical axis is average estimated settled ADR for January–July 2026, and circle size is proportional to room count.
Dense The occupied zone
¥5,800–¥8,800 x 73–237 rooms
15 of the 19 properties fall in this band. Limited-service hotels in front of the station sit side by side, and even with a temporary lift during a turnaround the top of the range is hard to move.
WS1 Mid-tier geared to multi-night and extended stays
¥9,000–¥16,000 x 60–150 rooms
Three properties qualify. A turnaround generates multi-night demand running one to two months, and there is room to grow in a mid-tier product equipped with cooking facilities, laundry and provision for work clothing.
WS2 Business tier above ¥16,000
¥16,000 and above
No property within 10km. Because managers, supervisors and manufacturer engineers all arrive together during a turnaround, demand for the upper tier may be leaking out of Yokkaichi altogether.
The supply pipeline is limited — 7 projects, 2,654 rooms across the four prefectures on a building-application basis
We checked how the supply side is responding to this repeat demand using two sources: new openings on an OTA-listing-confirmed basis (establishment dates in the property master), and building plans from MLIT’s Building Construction Dynamics Statistics Survey.
| Prefecture | Opened 2025 | Opened 2026 | Planned (building-application basis) | Lodging-use construction starts, 2024 |
|---|---|---|---|---|
| Mie | 33 properties, 268 rooms | 20 properties, 335 rooms | — | 42 buildings, 10,759 sqm |
| Chiba | 72 properties, 1,521 rooms | 43 properties, 1,598 rooms | 5 projects, 2,164 rooms | 209 buildings, 47,255 sqm |
| Okayama | 18 properties, 641 rooms | 12 properties, 879 rooms | 2 projects, 490 rooms | 19 buildings, 25,791 sqm |
| Oita | 50 properties, 664 rooms | 39 properties, 309 rooms | — | 91 buildings, 26,345 sqm |
New openings across the four prefectures are numerous in property terms but small in scale — 17 rooms per property in Mie in 2026 and 8 in Oita. These are mostly vacation rentals and simple lodgings, not at a scale that can absorb group demand from a turnaround. On a building-application basis, 5 projects totalling 2,164 rooms are confirmed in Chiba and 2 projects totalling 490 rooms in Okayama, while Mie and Oita currently have none. No new supply aimed at this demand has entered the trade areas where repeat demand is observable.
The investment question — how to evaluate NOI volatility on a four-year cycle
The investment significance of turnaround demand lies not in the single-year revenue impact but in how to underwrite an NOI that swings on a regular four-year cycle. We modelled the turnaround-year uplift for a typical business-oriented hotel within 10km of the Yokkaichi complex.
■ Modelling assumptions
- Subject: a 150-room limited-service hotel (around the middle of the size band in the Yokkaichi 10km compset)
- Normal-year ADR: ¥7,455 (average of the 12 monthly medians for 2025 in that compset, N=18–19)
- Turnaround-year ADR lift: +¥2,859 (March 2026 ¥10,535 less March 2025 ¥7,676)
- Duration of the lift: 61 days (roughly two months, the typical turnaround work window)
- Assumed occupancy: 75% (identical in normal and turnaround years; an assumption for the model, not an observed figure)
- GOP margin: 40% (the lower end of the 40–60% industry guide for limited-service business hotels)
- Variable cost ratio on the lift: 20% (incremental variable cost against incremental revenue)
| Item | Normal year | Turnaround year | Difference |
|---|---|---|---|
| Room revenue | ¥306.1m | ¥325.7m | +¥19.6m |
| GOP | ¥122.4m | ¥138.1m | +¥15.7m |
| Change in GOP | — | +12.8% | — |
| Annualised contribution to the four-year average | — | +¥3.9m | +3.2% |
■ Sensitivity analysis
| Case | Lift | Days | Turnaround-year GOP uplift | Change in GOP | Annualised over four years |
|---|---|---|---|---|---|
| Base case | +¥2,859 | 61 days | +¥15.7m | +12.8% | +¥3.9m |
| Lift +30% | +¥3,717 | 61 days | +¥20.4m | +16.7% | +¥5.1m |
| Lift -30% | +¥2,001 | 61 days | +¥11.0m | +9.0% | +¥2.7m |
| Duration halved | +¥2,859 | 31 days | +¥8.0m | +6.5% | +¥2.0m |
| Both conservative | +¥2,001 | 31 days | +¥5.6m | +4.6% | +¥1.4m |
■ Two-way sensitivity (lift x duration)
| Lift \ Days | 21 days | 31 days | 45 days | 61 days | 76 days |
|---|---|---|---|---|---|
| ¥1,500 | +2.3% | +3.4% | +5.0% | +6.7% | +8.4% |
| ¥2,000 | +3.1% | +4.6% | +6.6% | +9.0% | +11.2% |
| ¥2,859 (observed) | +4.4% | +6.5% | +9.5% | +12.8% | +16.0% |
| ¥3,500 | +5.4% | +8.0% | +11.6% | +15.7% | +19.6% |
| ¥4,000 | +6.2% | +9.1% | +13.2% | +17.9% | +22.4% |
Restating the same figures from a development perspective makes the position clear. At 150 rooms, 25 sqm per room and a guestroom-area ratio of 62% (all our own assumptions), gross floor area is roughly 6,048 sqm (about 1,830 tsubo). Applying a guide construction cost of ¥2.2m per tsubo for this hotel type — between the 2025 all-structure average of ¥1.952m and the ¥2.405m for steel-frame construction in MLIT’s Building Construction Starts Statistics, a mid-tier level — gives roughly ¥4.03bn. Assuming a 2028 opening and 24 months of construction, and factoring in inflation during the build (2026 +5.3%, 2027 +5.0% — our own assumptions rather than sourced fixed values, set in light of the upward trend in the construction cost deflator), the figure is about ¥4.45bn. The annualised +¥3.9m from a turnaround year is just 0.09% of that investment. Turnaround demand on its own will never justify a new development.
What does matter is the revenue design of existing stock. If you know in advance that demand will spike for two months once every four years, you can build a staged pricing plan for that window and prepare products aimed at multi-night stays, extracting additional GOP from the same asset. The reversal to -10.0% in Yokkaichi in April 2026 suggests the peak sits in the first half of the work window and that there is headroom left in selling inventory in the second half. Turnaround schedules are disclosed in each operator’s business plans, so unlike event-driven demand they can be read years ahead. That predictability is precisely what separates repeat demand from one-off demand.
Listed REITs have already invested in these industrial trade areas. Invincible Investment Corporation holds HOTEL MYSTAYS Soga (Chiba City, Chiba; 112 rooms; acquired August 2023 for ¥2,039m), ART HOTEL Oita (Oita City, Oita; 228 rooms; acquired July 2024 for ¥5,484m) and HOTEL MYSTAYS Oita (145 rooms; acquired February 2018 for ¥1,604m). Ichigo Hotel REIT Investment Corporation holds THE ONE FIVE GARDEN Kurashiki (Kurashiki, Okayama; 107 rooms; acquired August 2018 for ¥1,725m). Hoshino Resorts REIT Investment Corporation acquired Comfort Inn Kurashiki Mizushima (97 rooms) and Comfort Inn Chiba Hamano R16 (93 rooms) in May 2014, making it an early investor in lodging demand from industrial trade areas.
| Property | REIT | Rooms | Occupancy | ADR | RevPAR |
|---|---|---|---|---|---|
| HOTEL MYSTAYS Soga | Invincible Investment Corporation | 112 | 90.9% | ¥7,941 | ¥7,220 |
| ART HOTEL Oita | Invincible Investment Corporation | 228 | 84.0% | ¥7,114 | ¥5,976 |
| HOTEL MYSTAYS Oita | Invincible Investment Corporation | 145 | 82.4% | ¥6,913 | ¥5,696 |
Looking at acquisition price per room, Comfort Inn Kurashiki Mizushima was ¥7.5m per room (2014), HOTEL MYSTAYS Oita ¥11.1m (2018), HOTEL MYSTAYS Soga ¥18.2m (2023) and ART HOTEL Oita ¥24.1m (2024) — the more recent the acquisition, the higher the unit price. Business hotels in industrial trade areas have been revalued to roughly three times the acquisition unit price over a decade. Set against the new-build cost modelled above (¥4.45bn for 150 rooms, or ¥29.7m per room), acquiring existing properties still sits in a rational range relative to building new.
Risk factors — consolidation at Mizushima gives the repeat demand an end date
| Factor | Detail | Impact |
|---|---|---|
| Restructuring of production | Asahi Kasei, Mitsui Chemicals and Mitsubishi Chemical have signed a basic agreement to consolidate western Japan’s ethylene production into the Osaka area by around fiscal 2030. The plants in the Mizushima district are scheduled to cease operations, giving turnaround demand at Mizushima an end date. | High |
| Lengthening of the turnaround cycle | Under the certification system of the High Pressure Gas Safety Act, “super certified” facilities may run continuously for up to eight years, as may facilities holding the new A certification. The longer the cycle, the larger each individual burst of demand but the less frequently it occurs. | Medium |
| Feedstock procurement environment | In 2026 the effective closure of the Strait of Hormuz constrained naphtha procurement and delayed restarts. The work schedules themselves do not move, but uncertainty remains in operating plans either side of them. | Medium |
| Concentration of lodging capacity | Oita is thin at 364 rooms within 5km, making it easy to lose business in a year when demand arrives. Conversely, in a trade area with a large population of properties such as Kurashiki, the lift is diluted and barely registers in rates. | Medium |
| Supply response | Building-application-basis plans across the four prefectures amount to only 5 projects and 2,164 rooms in Chiba and 2 projects and 490 rooms in Okayama, with none currently in Mie or Oita. Supply pressure is limited for now, though further applications may yet be filed. | Low |
Conclusion — demand you can foresee can be captured through pricing design
The concentration of turnarounds in 2026 is confirmed numerically in the JPCA’s monthly memos: four crackers in March and April, against zero in the same months a year earlier. That demand showed through in room rates at Yokkaichi, which has a business-hotel cluster right by the complex (+45.9% year on year in March 2026), and at Oita, where only 364 rooms sit within 5km (+21.4% in January). Ichihara produced only a small peak at the start of the year, and Kurashiki was undetectable, mixed in with leisure demand.
Unlike one-off construction demand, repeat demand tells you when the next one is coming. That is precisely why capturing it through the pricing and product design of existing stock is more rational than building to meet it. In the model, a 150-room hotel sees turnaround-year GOP rise 12.8% (¥122.4m → ¥138.1m), with an annualised contribution to the four-year average of +¥3.9m. The contribution relative to the cost of an acquisition is small, but as an operational improvement on an existing asset it is meaningful.
At the same time, at locations such as Mizushima where production consolidation is targeted for around fiscal 2030, the repeat demand itself has an end date. If you are going to invest on the premise of cyclicality, you also need to count how many cycles are left.
Frequently asked questions
A. Under the certified operator system of the High Pressure Gas Safety Act, a certified plant may operate continuously for four years or such other period as approved by the minister, and facilities holding “super certification” may set their own interval of up to eight years. In practice a cycle of two to four years is common, and Crasus Chemical (Oita) states on its own website that “in 2026 we plan to carry out the major scheduled maintenance of our ethylene cracker, which takes place once every four years.”
A. According to the Japan Petrochemical Industry Association’s performance overview memos, the number of naphtha crackers under turnaround was 1 in January 2026, 2 in February, 4 in March, 4 in April, 2 in May, 3 in June and 2 in July. In the same months a year earlier, January through April were all zero. Ethylene output fell to 272,600 tonnes in March (-38.8% year on year), though the association notes that the decline reflects not only turnarounds but also utilisation-rate variation caused by difficulty sourcing naphtha feedstock.
A. In March 2026, when Tosoh’s Yokkaichi Complex ran its turnaround, estimated settled ADR in Yokkaichi was up 45.9% year on year (¥6,800 → ¥9,900, N=26 properties). Narrowing to a compset of the 19 properties within 10km of the complex with 30 or more rooms, the median was still up 37.2% (¥7,676 → ¥10,535). April reversed to -10.0%, however, so the lift tends to sit in the first half of the work window.
A. Oita. Within 5km of the centre point of the Oita complex there are only 9 properties and 364 rooms, and even within 10km the figure is 46 properties and 1,636 rooms. Against Yokkaichi’s 50 properties and 3,023 rooms within 5km, that is an 8.3x difference in room count. The main hotel cluster in front of Oita Station sits 13–15km from the complex.
A. In our model, a 150-room limited-service hotel sees a turnaround-year GOP uplift of ¥15.7m, with an annualised contribution to the four-year average of ¥3.9m. Setting the new-build cost for the same scale at roughly ¥4.45bn (after factoring in inflation during construction), the contribution amounts to just 0.09% of the investment. Building a development case on turnaround demand alone is difficult; capturing it through the pricing and product design of existing stock is the more realistic route.
Related reading
- Chitose & Tomakomai Worker Lodging — 7 New Hotels, 738 Rooms in 2026
- Fukushima Hamadori: 4,434 Rooms, Three-Layer Demand, Thin Center
- TSMC Fab 2 & Kumamoto’s Chip Corridor: Kikuyo–Koshi–Ozu ADR 2024–2026
- Hotel Supply Pressure Ranking 2026-2027: Ozu Kumamoto Tops at 30.8%
- Mie August Booking Curves: Business Hotels Swing 25.5pt, Ryokan 9.7pt
References and sources
■ Data sources
The lodging data in this article is based on estimated settled ADR (municipal medians and property-level figures), the lodging property master (location coordinates, room counts, opening years) and new-opening data (OTA-listing-confirmed basis), all collected and aggregated by MetroEngines Research & Consulting. Year-on-year ADR comparisons are restricted to months on a consistent actuals basis (through July 2026); estimates for future months based on currently listed rates are excluded from year-on-year comparison. Property counts are Yokkaichi N=25–26, Ichihara N=21–22, Kurashiki N=42–43 and Oita N=42–44. Compsets are limited to properties within a 10km radius of each complex centre point with 30 or more rooms (Yokkaichi N=19, Oita N=9, Ichihara N=24, Mizushima N=32). Turnaround plant counts and ethylene output come from the Japan Petrochemical Industry Association’s “Performance Overview (Memo)”, monthly editions; land prices and zoning from the MLIT Real Estate Information Library; building plans and construction starts from MLIT’s Building Construction Dynamics Statistics Survey and Building Construction Starts Statistics (e-Stat); and REIT property occupancy, ADR and RevPAR from the property-level monthly operating results disclosed by each REIT (July 2026).
■ Modelling assumptions
The GOP model is a single-property model holding 150 rooms, 75% occupancy, a 40% GOP margin and a 20% variable cost ratio on incremental revenue fixed. The normal-year ADR of ¥7,455 is the average of the 12 monthly medians for 2025 in the Yokkaichi 10km compset (N=18–19); the lift of +¥2,859 is the difference between the compset medians for March 2026 and March 2025 (¥10,535 − ¥7,676); and the 61-day duration is set at roughly two months, the typical turnaround work window. The 75% occupancy is not an observed figure but an assumption held identical in turnaround and normal years so that only the rate movement is isolated. In the new-build cost model, the 25 sqm per room, 62% guestroom-area ratio, ¥2.2m per tsubo construction cost and inflation rates during construction (2026 +5.3%, 2027 +5.0%) are all our own assumptions rather than sourced fixed values.
■ Limitations and caveats
Estimated settled ADR is an estimate produced by applying segment-specific adjustment coefficients to each property’s lowest published OTA plan rate, and differs from actual transacted rates and accounting figures (cross-checked against property-level disclosures by listed hotel REITs, the median error is approximately 7%). Municipal aggregates also include leisure and other business demand, so ADR movements cannot all be attributed to turnarounds. The 2026 output decline also reflects difficulty sourcing naphtha following the effective closure of the Strait of Hormuz, so the size of the drop in ethylene output cannot be read as the scale of turnaround activity. Room stock is limited to the properties we capture, and properties for which no OTA listing can be confirmed are not included. Building-application-basis plans may increase as further applications are filed and are therefore a lower bound as at this point. The GOP model is a simplified one; an actual investment decision requires a detailed feasibility study.
■ Market data
- MetroEngines Research & Consulting — estimated settled ADR (municipal medians and property-level), lodging property master (location coordinates, room counts, opening years), new-opening data (OTA-listing-confirmed basis)
■ Industry statistics and primary sources
- Japan Petrochemical Industry Association, “Performance Overview (Memo)”, monthly editions (turnaround plant counts, ethylene output, effective utilisation estimates)
- Japan Petrochemical Industry Association, “Production of Major Petrochemical Products”
- Crasus Chemical Corporation, “Contributing to a sustainable society as a next-generation petrochemical company” (statement on the 2026 major scheduled maintenance)
- Tosoh Corporation, “Yokkaichi Complex”
- Mitsui Chemicals, “Asahi Kasei, Mitsui Chemicals and Mitsubishi Chemical sign basic agreement on promoting the greening of the western Japan ethylene production structure” (27 January 2026)
- Asahi Kasei, “Basic agreement on promoting the greening of the western Japan ethylene production structure” (27 January 2026)
- Raiznext Corporation, “Maintenance business” (network of more than 4,000 partner companies nationwide)
- City of Yokkaichi, “Report of the Yokkaichi Complex Advancement Study Group” (March 2019) (discussion of scheduled maintenance issues)
- What is the “certification system” under the High Pressure Gas Safety Act? (overview of continuous-operation periods and open-inspection cycles)
■ Government statistics and public data
- MLIT Real Estate Information Library — Published Land Prices (2026), city planning decisions (zoning districts)
- MLIT, “Building Construction Starts Statistics” (e-Stat table ID: 0003114490, use category “52 lodging industry”)
- MLIT, “Building Construction Dynamics Statistics Survey” (building plan data for lodging facilities)
- METI Industrial Structure Council, High Pressure Gas Subcommittee (the new certification system under the High Pressure Gas Safety Act)
■ REIT and investment benchmarks