

In the pro forma for a newly opening hotel, two of the most assumption-driven line items are how deeply to discount ADR in the first year of operation, and when the rate returns to a normal level. Convention widely applies a flat 10-20% discount for year one and assumes stabilization within two to three years, yet almost no published work tests those numbers against observed data. This article tracks 182 hotels with 50 or more rooms that opened in Japan during 2024-2025, normalizes their monthly estimated transacted ADR against the market level for the same prefecture and same property type over the 24 months following opening, and measures both the size of the opening discount and the number of months to recovery.
Most previously published work on new openings has focused on the volume of supply — the number of hotels opening in 2026, polarization by property size, supply contraction driven by construction costs. On the pricing side, our earlier analysis benchmarked the 2025 opening cohort against the area standard from the month of opening and found that new hotels land roughly 10% above the area standard from their very first month, as covered in New Hotel ADR Ramp-Up: 91 Japan Openings Split Into 4 Pricing Types. This article replaces that benchmark: instead of the market, the reference point becomes the property’s own price one year later. The sample widens to 182 hotels opened in 2024-2025 tracked over 24 months, and the measurement target becomes the opening discount and the months to recovery themselves. Supply volume is treated as background and confined to a single section.
Metric Definitions Used in This Article
- ADR (Average Daily Rate): An estimated transacted rate (tax-exclusive equivalent), calculated by applying a property-type correction factor to the lowest advertised plan level each property publishes on OTAs and similar channels (double occupancy, per-room rate, tax-inclusive). Cross-checked against property-level actuals disclosed by listed hotel REITs, the median error is approximately 7%. These are estimates and differ from each property’s actual transacted rates and accounting figures. Area-level ADR is the median across the properties covered (the level of a typical property in that area).
- Market-relative index: A property’s estimated transacted ADR in a given month divided by the median estimated transacted ADR for the same prefecture and same property type. Used to strip out seasonality and market-wide rate inflation.
- Stabilized period: Months 12-17 after opening. The median market-relative index over that window is treated as the property’s steady-state level, and every ratio thereafter is expressed relative to that level set at 1.00.
- Months to recovery: The first month, from the month after opening onward, in which the three-month moving average of the market-relative index reaches at least 98% of the steady-state level.
- Data source: MetroEngines Research & Consulting
Note: The occupancy rates used in the scenario calculations later in this article (60% / 80%) are external figures conventionally applied as opening ramp-up assumptions in DCF-based real estate appraisal practice. They are not our estimated occupancy rates.
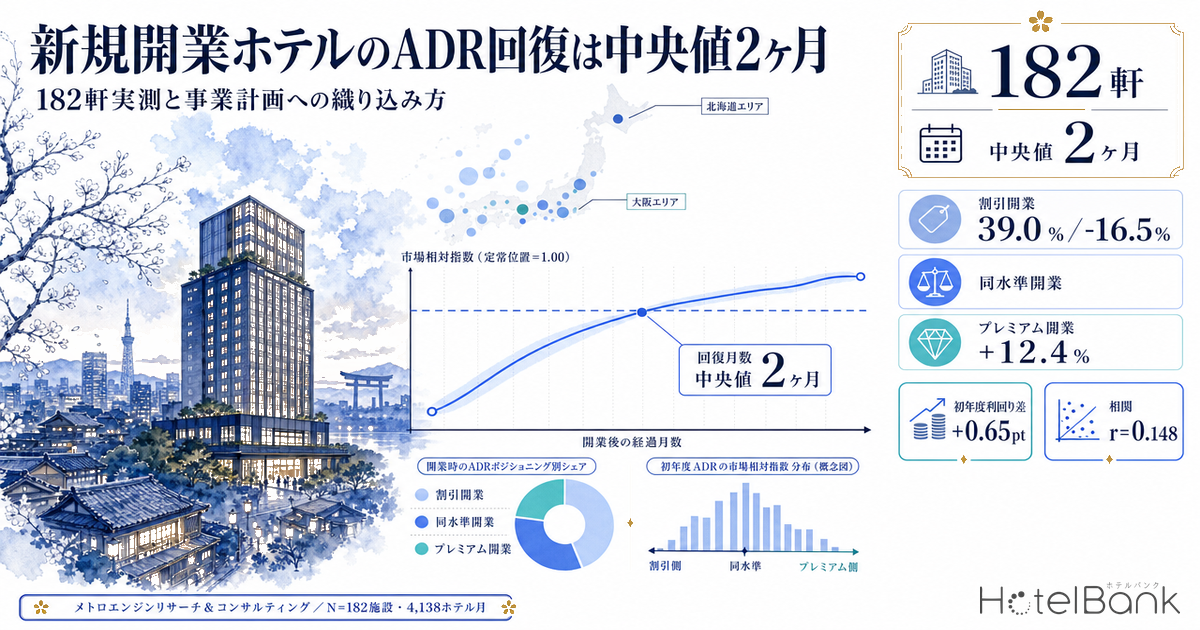
- — At the median, no first-year discount is observed. Across 182 hotels, months 1-3 after opening sit at +0.6% versus the steady-state level, and the first-year average is +1.1%.
- — Median time to recovery is 2 months. 48% reach steady state in the first month after opening, while the third quartile is 7 months and 9% have still not reached it after 12 months.
- — The distribution is bimodal. 39.0% open at -16.5% and take a median of 8 months to recover; 33.5% open at +12.4% and decline to steady state over months 12-13.
- — The only variable that mattered is the price position the property is aiming for. Among hotels targeting twice the market median, 49% opened at a discount; among those targeting 0.84x, only 27% did. Property type, room count and metro versus regional location explain nothing.
- — First-year yield moves 0.65pt on the ADR assumption and 1.35pt on a +/-10pt swing in occupancy. The assumption should be set on two axes — a ramp curve and occupancy sensitivity — not a single discount rate.
Supply volume as background — 1,739 openings averaging 24 rooms in 2025, of which 374 with 50+ rooms are the practical universe
Supply volume has been covered in earlier articles, so it is addressed here only insofar as it defines the sample. Within the scope tracked by MetroEngines Research & Consulting, 1,739 properties were observed opening in 2025 (based on confirmed OTA listings), averaging 24 rooms. The breakdown is 745 vacation rentals, 265 business hotels, 122 guesthouses, 113 cottages, 99 resort hotels, 98 hostels and 59 ryokan, among others — on a count basis, small-scale, dispersed inventory makes up the large majority. For 2026, 1,284 properties averaging 27 rooms have been observed so far.
What actually enters a business plan or an investment decision, however, is the subset above a certain scale. Restricting to 50 rooms or more leaves 166 hotels in 2024 and 208 in 2025, for a combined 374 — barely more than 20% of the count-based universe. This article takes those 374 as its starting point. Note that opening counts are based on confirmed OTA listings; because listings appear several months before opening, recent months and years will continue to rise as further listings appear. The 1,284 figure for 2026 is likewise not final.
Study design — normalized to the market level, with the opening month excluded
Simply asking whether ADR is low immediately after opening mixes in seasonality and market-wide rate inflation. A July opening and a February opening have entirely different absolute levels in their first month, and the 2024 cohort simply rides the market’s rise through 2025. We therefore converted each property’s monthly estimated transacted ADR into a market-relative index by dividing it by the median estimated transacted ADR for the same prefecture and same property type. An index of 1.20 means that in that month the property sat 20% above a typical property of the same type in that market.
Next, we defined each property’s median index over months 12-17 after opening as its steady-state level, and normalized the entire series to it. The comparison is therefore neither the market nor the competitive set but the property’s own profile one year later — a design intended to isolate the opening effect alone.
One methodological point deserves emphasis. The month of opening itself was excluded from the analysis. In the opening month, the median number of days on which a price was observed is 18, well short of the 30-31 days of a normal month. Including that partial month produces an opening-month index of 0.928 (-7.2%), but restricting to properties with 25 or more observation days brings it to 0.998 — the gap essentially disappears. In other words, the “steep opening-month discount” is an artifact of the observation window, not a real phenomenon. From here on, the month after opening is treated as month 1, and only months with 25 or more observation days are used.
182 hotels satisfy these conditions and have a determined steady-state level (138 business hotels, 27 city hotels, 16 resort hotels and 1 ryokan; 126 opened in 2024 and 56 in 2025), giving 4,138 observed hotel-months.
At the median, no “first-year discount” is observed
To lead with the conclusion: across 182 hotels, the median market-relative index for months 1-3 after opening is 1.006 (+0.6%) versus the steady-state level — there is no meaningful discount. The first-year average (months 1-11) is 1.011, again effectively identical to the steady-state level. Median time to recovery is 2 months, and 48% of properties are already at their steady-state level in the first month after opening.
Broken out by month, the index is 0.964 in month 1, 0.997 in month 2 and 1.020 in month 3: there is a slight dip in the month after opening, but it resolves by month 2. (Taking each property’s own median across months 1-3 gives the 1.006 cited above.)
In yen terms, the median estimated transacted ADR for months 1-3 across the 138 business hotels is approximately ¥8,100, against roughly ¥8,300 that the same property would have commanded at its steady-state level in the same month and same market — a gap of about ¥200, or -2.5%. That is an order of magnitude away from the conventional “-15% in year one” assumption.
The interquartile range shows that behind this flat median, individual properties vary widely. For months 1-3 after opening, the first quartile is 0.885 and the third quartile 1.096; the bottom decile is 0.768 and the top decile 1.188. This is a market in which the average property does not discount, but any individual property can move +/-20%. What matters for a business plan is not the median but which side of that distribution the property lands on.
The distribution is the real story — 39% open at -16.5%, 33% at +12%
Classifying properties whose months 1-3 index is below 0.95 of steady state as “discount openings,” those above 1.05 as “premium openings,” and the rest as “at-par openings,” the 182 hotels split as follows.
| Opening price type | Properties | Share | Month 1 | Month 6 | Month 12 | Median months to recovery |
|---|---|---|---|---|---|---|
| Discount opening (below 0.95) | 71 | 39.0% | 0.835 | 0.929 | 0.997 | 8 months |
| At-par opening (0.95-1.05) | 50 | 27.5% | 0.981 | 1.002 | 1.015 | 1 month |
| Premium opening (above 1.05) | 61 | 33.5% | 1.124 | 1.122 | 1.014 | 0 months |
The discount-opening group (71 hotels) starts month 1 at 0.835 of steady state — that is, -16.5% — and recovers gradually over the following ten months. Months to recovery run 5 at the first quartile, 8 at the median and 12 at the third quartile; for this group alone, the conventional assumption of discounting in year one is broadly reasonable. In yen terms, the median estimated transacted ADR for months 1-3 is about ¥8,700 against roughly ¥10,600 at the steady-state equivalent — a gap of about ¥1,900 per room.
The premium-opening group (61 hotels) moves in the opposite direction. It launches at +12.4% in month 1, holds around +10% through month 7, and then declines toward steady state over months 12-13. The price premium from novelty and buzz immediately after opening is real, but it is the kind of premium that disappears within a year. In a business plan, the elevated ADR seen just after opening must not be extrapolated into year two and beyond.
That these three groups are not merely an artifact of measurement noise can be confirmed from the shape of their convergence. During the stabilized period (months 12-24), month-to-month variation in the market-relative index has a median of 7.3%, so a single month’s observation is far from quiet. But if the split were pure noise, the groups would revert to the mean the following month and the difference would vanish. In practice the discount group recovers monotonically over ten months, and the premium group holds +10% for seven months before decaying. That persistence cannot be explained by monthly dispersion. The group assignment itself, moreover, is based on the median of months 1-3 rather than any single month.
Distribution of months to recovery — half within 2 months, 9% still short after a year
The distribution of months to recovery (the first month in which the three-month moving average reaches 98% of steady state) is strongly right-skewed: 1 month at the first quartile, 2 at the median, 7 at the third quartile, 12 at the ninth decile, with a mean of 4.2 months. Cumulatively, 48% reach steady state by month 1, 63% by month 3, 74% by month 6 and 91% by month 12.
Translated into a business plan, using the single figure of 4.2 months is not appropriate. It is closer to reality to carry the bimodal shape straight into the scenarios: half the properties sell at the steady-state rate immediately, one in four takes seven months or more, and one in ten takes a year.
What determines the discount side — not local supply volume, but the price position being targeted
Can we predict which properties fall on the discount side? Conventional cuts such as property type, room count and metro versus regional location produced almost no difference.
| Segment | Properties | Months 1-3 (vs steady state) | Median months to recovery |
|---|---|---|---|
| Business hotels | 138 | 0.990 | 2 months |
| City hotels | 27 | 1.021 | 1 month |
| Resort hotels | 16 | 1.065 | 2 months |
| 50-99 rooms | 58 | 1.008 | 2 months |
| 100-199 rooms | 71 | 1.006 | 2 months |
| 200+ rooms | 53 | 0.996 | 1 month |
| Three major metro areas and suburbs | 84 | 1.009 | 1 month |
| Other areas | 98 | 1.000 | 2 months |
Only one variable clearly mattered: where in the market’s price band the property ultimately lands. Splitting the 182 hotels into terciles by their steady-state market-relative index (the multiple of the market median at which they sell during the stabilized period) gives the following.
| Steady-state price position | Properties | vs market median | Months 1-3 | Share opening at a discount | Median months to recovery |
|---|---|---|---|---|---|
| Bottom third (priced below the market) | 60 | 0.84x | 1.032 | 27% | 2 months |
| Middle third | 61 | 1.13x | 1.006 | 41% | 1 month |
| Top third (priced above the market) | 61 | 2.02x | 0.955 | 49% | 3 months |
Properties aiming to sell at twice the market median post a month-1 index of 0.910, roughly 9% below steady state; nearly half are classified as discount openings, and they take a median of three months to reach steady state. Conversely, properties targeting the more accessible 0.84x position are already selling at close to their steady-state rate from month 1 (0.982). The higher the position a property reaches for, the longer the run-up needed before the reputation and track record that justify that position accumulate — a result consistent with practitioner intuition. Setting the ADR ramp assumption in a business plan as a function of how far above the market the property is aiming, rather than of property type or room count, improves accuracy.
One result ran counter to intuition. The volume of new supply nearby explains almost nothing about a new property’s own opening price. Correlating supply intensity by prefecture — new rooms added in 2024-2025 divided by existing rooms — against that prefecture’s median months 1-3 index gives r=0.148 (n=18 prefectures), essentially no relationship. The distribution of that same “share of existing stock” measure taken down to the municipal level is set out in Hotel Supply Pressure Ranking 2026-2027.
Osaka, with the highest supply intensity at 13.7%, shows the strongest launch of all at 1.097 for months 1-3. Hokkaido follows with a supply intensity of 8.0% and an index of 1.139. Conversely Aichi, restrained at 4.3% supply intensity, is the weakest at 0.879. The reading is that pricing latitude at opening is set not by the absolute volume of new supply but by the growth in demand absorbing that supply. In development decisions, the premise that “this area is in an opening boom, so year one has to be sold cheap” is not supported by the last two years of observed data.
What about the demand side, then? We re-measured the “growth in demand absorbing supply” referenced above using the same series as this analysis. For each of the 18 prefectures, we compared the 12-month average of the prefecture’s median estimated transacted ADR for 2024 against the same figure for 2025, and used that growth rate as a proxy for how far the market was able to push rates through (the demand side’s absorption capacity), testing it against the months 1-3 index.
| Market price growth (2024 to 2025) | Prefectures | Median growth | Median months 1-3 | Properties covered |
|---|---|---|---|---|
| Top third (strongest growth) | 6 | +8.3% | 1.014 | 79 |
| Middle third | 6 | +3.3% | 1.008 | 31 |
| Bottom third (weakest growth) | 6 | -3.2% | 0.990 | 28 |
The direction matches the hypothesis: prefectures where market prices grew show higher opening positions. But the effect is weak. The correlation between growth and the opening index is r=0.251 (n=18 prefectures) — higher than the r=0.148 for supply intensity, yet still close to no relationship. Across terciles the medians run 1.014 at the top versus 0.990 at the bottom, a difference of only 2.4 points. The correlation between supply intensity and market price growth is itself r=0.320, meaning the obvious fact that stronger-demand prefectures also receive more supply is all that thinly links the two. Read faithfully to the data, prefecture-level macro supply and demand — on both the supply and demand sides — explains almost nothing about an individual property’s opening price. There is little room to deduce a business plan’s ADR ramp assumption from area-level supply and demand; the property’s own target price position, discussed in the preceding section, is decisively more powerful. Note also that each prefecture covers only 4 to 26 properties, so prefecture-level values are volatile.
| Hokkaido (n=11) | 1.139 |
| Nagasaki (n=4) | 1.112 |
| Osaka (n=26) | 1.097 |
| Tokyo (n=22) | 1.006 |
| Kanagawa (n=8) | 0.925 |
| Aichi (n=5) | 0.879 |
Building it into the business plan — the ADR assumption alone moves first-year yield by 0.65pt
What happens when the observed values are reflected in a business plan? Assume a 150-room business hotel with a stabilized estimated transacted ADR of ¥8,300 (the steady-state equivalent level for the 138 business hotels in this analysis), occupancy of 60% in the first year of operation and 80% at stabilization — the conventional opening ramp-up assumptions in DCF-based real estate appraisal practice — and a GOP margin of 45% (the lower end of the 40-60% guideline range for limited-service hotels). Construction cost is taken as ¥2.405 million per tsubo for steel-frame construction in 2025, based on MLIT’s Statistical Survey on Building Construction Starts, and at 28 sqm of gross floor area per room (1,271 tsubo) gives approximately ¥3.06 billion (excluding land). How the rise in that per-tsubo cost itself distorts future supply plans is covered in detail in Construction +41% & Labor Crunch Erase Japan’s 2027-2029 Hotel Supply.
| First-year ADR assumption | First-year ADR | First-year room revenue | First-year GOP | First-year yield on construction cost | Difference vs Case A |
|---|---|---|---|---|---|
| A. Conventional (flat -15% in year one) | ¥7,100 | ¥231.8m | ¥104.3m | 3.41% | — |
| B. Observed median case (+1.1%)Median case | ¥8,400 | ¥275.7m | ¥124.0m | 4.06% | +0.65pt |
| C. Observed discount-opening case (-7.3%) | ¥7,700 | ¥252.9m | ¥113.8m | 3.72% | +0.31pt |
| (Reference) Stabilized | ¥8,300 | ¥363.5m | ¥163.6m | 5.35% | — |
Case B’s +1.1% is the median of first-year (months 1-11) averages across the 182 hotels; Case C’s -7.3% is the first-year average for the 71 discount-opening hotels. Between conventional Case A and median Case B, first-year room revenue differs by ¥43.9m and GOP by ¥19.8m, translating into a 0.65-point gap in first-year yield on construction cost. For the same property and the same occupancy assumption, the ADR ramp assumption alone moves the result that far.
More important as a sensitivity is the spread between the discount-opening and premium-opening groups. Their first-year averages are 0.928 versus 1.090; that 17.5% difference equates to ¥44.2m in first-year room revenue and 0.65 points of first-year yield. This spread is the single largest risk factor in the opening year, and a single discount rate as in Case A cannot express it. In practice, the closest fit to what this analysis observes is to apply Case B or Case C according to the target position relative to the market median, and to treat the upside (premium opening) as temporary — assuming a return to steady state within 12 months.
Two-axis sensitivity: ADR assumption x occupancy — the wider swing is on occupancy
All three cases above fix first-year occupancy at 60%. In practice that 60% is itself only an assumption, so the ADR assumption and occupancy need to be flexed together on two axes. The other conditions (150 rooms, GOP margin 45%, construction cost approx. ¥3.06bn) are the same as in the table above.
| First-year ADR | First-year occupancy | ||||
|---|---|---|---|---|---|
| 50% | 55% | 60% | 65% | 70% | |
| ¥6,400 (bottom decile equivalent, 0.768) | 2.58% | 2.83% | 3.09% | 3.35% | 3.61% |
| ¥7,100 (Case A, conventional -15%) | 2.86% | 3.14% | 3.43% | 3.72% | 4.00% |
| ¥7,700 (Case C, discount opening -7.3%) | 3.10% | 3.41% | 3.72% | 4.03% | 4.34% |
| ¥8,400 (Case B, observed median +1.1%) | 3.38% | 3.72% | 4.06% | 4.40% | 4.73% |
| ¥9,000 (premium opening +9.0%) | 3.62% | 3.99% | 4.35% | 4.71% | 5.07% |
There are two things to read here. First, the range of first-year yield driven by the ADR assumption (¥7,100 to ¥9,000) is 0.92 points at 60% occupancy. Second, holding ADR constant, moving occupancy from 50% to 70% shifts the yield by 1.35 points (3.38% to 4.73% in Case B at ¥8,400). In other words, however precisely the ADR ramp assumption is set, opening-year earnings swing more with how occupancy ramps than with the difference between ADR assumptions. The finding this article presents on the ADR side — that the discount is smaller and shorter than expected — does not displace the uncertainty on the occupancy side.
It should also be kept in mind that this analysis measures the price term only. The ramp-up of occupancy after opening cannot be tracked for the 2024-2025 opening cohort, because our estimated occupancy data only accumulates from 2026 onward. The DCF convention of 60% in year one rising to 80% by year three is left in place, and it remains likely that most of the earnings risk in the opening year sits on the occupancy side. The implication of this article is that the discount on the ADR side is smaller and shorter than expected — not that the opening year can be viewed optimistically.
Summary
Four points emerge from the observed data on 182 hotels with 50 or more rooms opened in 2024-2025, covering 4,138 hotel-months.
| Question | What the data shows |
|---|---|
| Size of the first-year discount | At the median, months 1-3 after opening run +0.6% versus steady state and the first-year average is +1.1%. No market-wide “flat first-year discount” is observed. |
| Months to recovery | Median of 2 months, with 48% reaching steady state in the month after opening. But the third quartile is 7 months and 9% have not reached it after 12 months. |
| Bimodality of the distribution | 39.0% open at -16.5% and recover in a median 8 months; 33.5% open at +12.4% and decline to steady state over months 12-13. The opening premium disappears within a year. |
| Predictive variables | Property type, room count and metro versus regional location explain nothing. Among properties targeting twice the market median at steady state, 49% open at a discount, against 27% for those targeting 0.84x. Prefecture-level macro supply and demand has weak explanatory power: the correlation with new supply intensity is r=0.148 and with market price growth r=0.251. |
Writing “-15% in year one, stabilizing within three years” into the ADR ramp line of a business plan is, against the observed data, either too conservative or simply beside the point. It is excessively harsh for the median property, and it misjudges the months required for recovery at properties aiming well above the market. What belongs there is not a single discount rate but a monthly ramp curve keyed to the target position relative to the market median. The tercile ramps in this analysis (bottom third 0.982 in month 1, middle third 0.971, top third 0.910 rising to steady state over six months) can serve as a starting point.
⚠ A note on the use of estimates: ADR in this article is an estimated transacted rate derived by applying a property-type correction to the lowest advertised plan level each property publishes on OTAs and similar channels; cross-checked against property-level disclosures by listed hotel REITs, the median error is approximately 7%. It differs from any individual property’s actual transacted rates and accounting figures. This analysis is also limited to the 2024-2025 opening cohort, for which data within 24 months of opening is finalized, and uses only finalized monthly data (a historical basis). There is no guarantee that hotels opening in future will repeat the same pattern.
Related Reading
- 582 Hotels Opening 2026: 30-Room Luxury vs 200+ Scale Polarization
- Construction +41% & Labor Crunch Erase Japan’s 2027-2029 Hotel Supply
- Six Luxury Hotels Opening in Japan in 2026: Investor Market Impact Analysis
- New Hotel ADR Ramp-Up: 91 Japan Openings Split Into 4 Pricing Types
- Hotel Supply Pressure Ranking 2026-2027: Ozu Kumamoto Tops at 30.8%
- Hotels at Year 10: The Renovation Gap Is +13.6% Below 100 Rooms
- Tokyo 23 Wards Supply Pressure 2026: Arakawa 16.0%, Minato Just 4.5%
References and Sources
■ Data sources
Monthly estimated transacted ADR series for the 182 hotels (4,138 hotel-months) whose steady-state level over months 12-17 after opening could be determined, drawn from the 374 hotels with 50 or more rooms that opened in 2024-2025 (166 in 2024, 208 in 2025). The market benchmark is the median estimated transacted ADR for the same prefecture and same property type (139 series). Counts of new openings and room supply are based on confirmed OTA listings. Construction cost per tsubo is from MLIT’s Statistical Survey on Building Construction Starts. Aggregation by MetroEngines Research & Consulting.
■ Calculation assumptions
The market-relative index is normalized with each property’s median index over months 12-17 after opening set to 1.00, excluding the opening month and any month with fewer than 25 days of observed prices. Months to recovery is the first month in which the three-month moving average reaches 98% of the steady-state level. The business plan calculation assumes 150 rooms, 28 sqm of gross floor area per room (1,271 tsubo total), construction cost of ¥2.405 million per tsubo for approximately ¥3.06 billion (excluding land), a GOP margin of 45%, and occupancy of 60% in the first year rising to 80% at stabilization — external assumptions conventionally applied as opening ramp-up in DCF-based real estate appraisal practice. First-year yield is calculated as first-year GOP divided by construction cost. The occupancy figures are not our estimated occupancy rates.
■ Limitations
ADR is an estimated transacted rate derived by applying a property-type correction to the lowest advertised plan level each property publishes on OTAs and similar channels; cross-checked against property-level disclosures by listed hotel REITs, the median error is approximately 7%. It differs from any individual property’s actual transacted rates and accounting figures. This analysis measures the price term only; the ramp-up of occupancy after opening cannot be tracked for the 2024-2025 opening cohort because our estimated occupancy data only accumulates from 2026 onward. Prefecture-level correlations rest on a small sample of 18 prefectures with 4 to 26 properties each, so prefecture-level values are volatile. All correlations are descriptive associations and do not demonstrate causation. There is no guarantee that hotels opening in future will repeat the same pattern.
■ Market data
- MetroEngines Research & Consulting — monthly estimated transacted ADR series (182 properties with 50+ rooms opened 2024-2025, 4,138 hotel-months), median ADR by prefecture and property type, aggregation of new openings and room supply (based on confirmed OTA listings)
■ Government statistics and public data
- MLIT, Statistical Survey on Building Construction Starts (construction cost per tsubo, by structure)
- Japan Tourism Agency, Overnight Travel Statistics Survey
- Japan National Tourism Organization (JNTO), Statistics on Foreign Visitors to Japan
■ Industry and practitioner benchmarks
- Separating hotel business value from real estate value: the GOP method with worked examples (opening ramp-up assumption in DCF: 60% in year one rising to 80% by year three)
- Invincible Investment Corporation, hotel portfolio (actual GOP margins for operated hotels)
- Relo Hotel Solutions, “What is hotel OCC (occupancy rate)?” (GOP margin and occupancy guidelines by property type)
- archi-book, “Construction cost per tsubo, 2025 edition”