

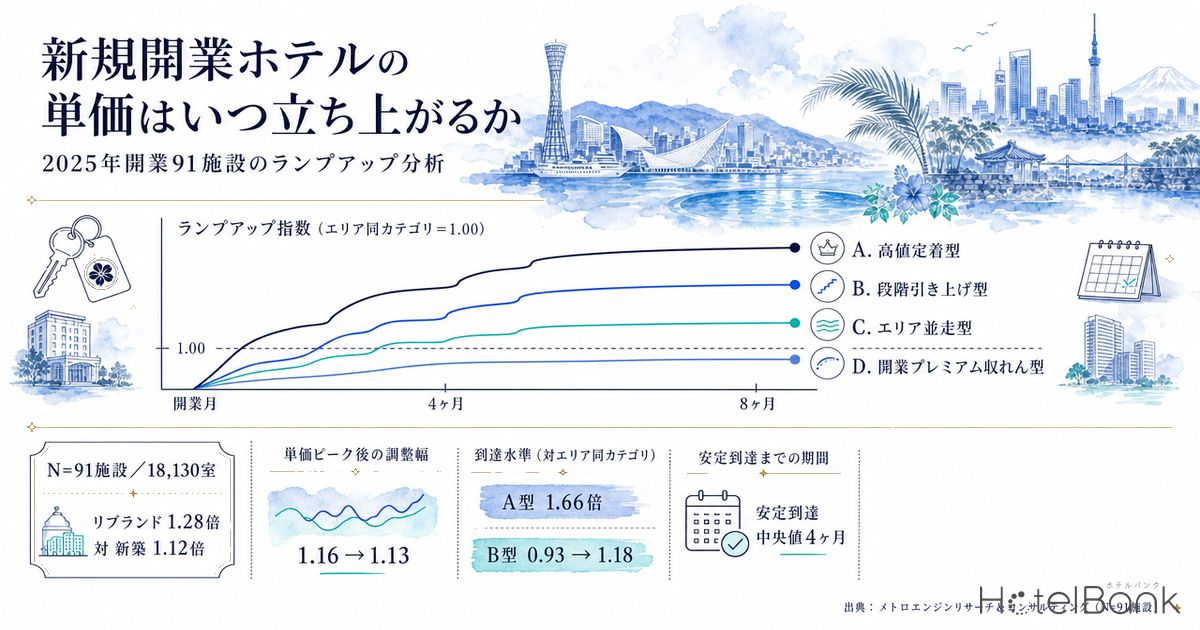
When a new hotel opens, when does its room rate reach its “true” level? Some properties push assertive pricing from the very first month; others raise rates step by step over several months. This difference in how rates ramp up shapes both the pre-opening budget and the revenue design of the first operating year. This article covers 136 hotels with 100 or more rooms that opened in Japan in 2025. We aligned their monthly estimated settled ADR on a relative timeline anchored to the opening month, normalized it as a ratio to the area benchmark for the same prefecture and same category — a “ramp-up index” — and sorted the resulting trajectories into four distinct types.
Metric Definitions Used in This Article
- ADR (average daily rate): An estimated settled rate (tax-exclusive equivalent) calculated by applying category-specific adjustment coefficients to the lowest published plan level each property lists on OTAs and similar channels (double occupancy, per-room rate, tax-inclusive). Against property-level actuals disclosed by listed hotel REITs, the median error is 7.5% across 184 property-months of Invincible Investment Corporation (April–May 2026), and 6.0% when limited to business and city hotels. These are estimates and differ from each property’s actual transacted rates and accounting figures. Area-level ADR is the median across the properties in scope (the level of a typical property in that area).
- Ramp-up index: A property’s estimated settled ADR for a given month divided by the median area estimated settled ADR for the same prefecture and same category. A value of 1.00 equals the level of a standard property in that area. To strip out seasonality, ramp-up is compared using this ratio rather than absolute amounts.
- Relative month: Months elapsed with the opening month counted as month 0. Month 1 = the month after opening.
- LT (lead time): Days remaining until the check-in date. LT0 = same day.
- Published price: The average of all plans listed on OTAs and similar channels (double occupancy, per room, tax-inclusive). This is a separate metric from estimated settled ADR, and the two are explicitly distinguished throughout this article.
- Data source: MetroEngines Research
- — Across 91 properties the median runs 1.16x in the opening month and 1.13x at month 8 — the notion that hotels open cheap and raise rates over time does not hold at the market-wide level. The typical property lands from month one at a little over 10% above the area benchmark.
- — Ramp-up splits into four types — 14 properties hold a premium (steady at 1.66x), 19 step rates up (0.93x to 1.18x), 31 track the area (flat at 1.03x), and 27 converge from an opening premium (1.47x to 1.21x).
- — The median time to settle into a steady price range is 4 months from opening — dividing an annual average ADR into 12 equal monthly budget slices tends to diverge sharply from reality over this window.
- — At least 20% of “2025 openings” are rebrands or conversions — the 18 properties in question (19.8%) open at 1.28x from day one, clearly ahead of the 1.12x for new-build and other projects.
- — Entry level and headroom trade off against each other — Type B entered at 0.93x and reached 1.18x within eight months, while Type A entered at 1.66x and stayed flat. Which type to pursue is a pre-opening decision.
136 Properties and 25,416 Rooms Opened in 2025 With 100+ Rooms
On a major-OTA listing basis tracked by MetroEngines Research, 136 hotels with 100 or more rooms — 25,416 rooms in total — were confirmed to have opened (that is, begun being listed) in 2025. By category, business hotels dominate at 96 properties, followed by 18 city hotels, 8 resort hotels and 6 deluxe hotels. It should be stated up front that this is not a complete census: the tally is limited to properties whose OTA listings could be confirmed.
Of those, 91 properties totaling 18,130 rooms were analyzed — the set for which estimated settled ADR could be obtained continuously from the opening month through month 8 and matched against the area benchmark for the same prefecture and category. The median room count is 182, and the composition is 69 business hotels, 16 city hotels, 5 resort hotels and 1 ryokan.
Start with the overall picture. The median ramp-up index across the 91 properties moves from 1.16 in the opening month to 1.13 at month 8 — essentially flat. In other words, the intuitive image of opening cheap and climbing over time does not describe the market-wide median. The standard new hotel already prices a little over 10% above a typical area property in its first month, and holds that position eight months later.
The interquartile range, however, is extremely wide: 0.88–1.46 in the opening month and still 0.95–1.49 at month 8. The median stays put only because properties raising rates and properties cutting them offset one another. The real shape of ramp-up only emerges once you break this distribution open.
Ramp-Up Splits Into Four Distinct Types
To do that, we defined an “uplift ratio” as the average index for months 6–8 (the stable level) divided by the average index for the opening month through month 1 (the entry level), and sorted the 91 properties into four types. The thresholds: an uplift ratio of 1.15 or above is the step-up type; 0.88 or below is the opening-premium convergence type; among the remainder, an entry level of 1.25 or above is the sustained-premium type, and the rest are the area-tracking type.
| Type | Properties | Entry level (months 0–1) |
Stable level (months 6–8) |
Median room count |
Main category composition |
|---|---|---|---|---|---|
| A. Sustained premium | 14 | 1.66 | 1.64 | 172 rooms | Business 11 / City 2 / Resort 1 |
| B. Step-up | 19 | 0.93 | 1.18 | 200 rooms | Business 13 / City 3 / Resort 2 / Ryokan 1 |
| C. Area-tracking | 31 | 1.03 | 1.03 | 168 rooms | Business 25 / City 4 / Resort 2 |
| D. Opening-premium convergence | 27 | 1.47 | 1.21 | 194 rooms | Business 20 / City 7 |
A. Sustained premium (14 properties) prices at 1.66x the area benchmark from the opening month and holds essentially the same position at 1.64x eight months later. This group is dominated by properties occupying the upper floors of prime station-front mixed-use developments, and by properties introducing a brand tier that did not previously exist in the local market. These are cases where brand, location and product together secure a clear price position from the outset. JW Marriott Hotel Tokyo (JWマリオット・ホテル東京) (200 rooms, opened October 2025) sits at the top of this type, holding a consistently wide margin over the Tokyo city hotel benchmark since opening.
B. Step-up (19 properties) starts at 0.93x the area benchmark in months 0–1 and reaches 1.18x by months 6–8. On a trajectory rebased to 100 at the opening month, month 8 lands at 131.5 — an uplift of a little over 30%. The median room count of 200 is the largest of the four types, suggesting that larger properties are more likely to prioritize securing occupancy first and pivot to rate once occupancy is established. Notably, 13 of the 19 are business hotels, concentrating this pattern in large room-count, accommodation-led properties.
C. Area-tracking (31 properties) is the most populous of the four types. With an entry level of 1.03 and a stable level of 1.03, these properties land essentially level with a standard area property from the start and simply stay there. Many are nationally rolled-out, accommodation-led brands that can apply pricing logic already established at existing properties directly to a new one, which effectively removes the need for a ramp-up period at all. This is where the advantage of a chain with mature brand standardization shows up in the numbers.
D. Opening-premium convergence (27 properties) enters high at 1.47x the area benchmark immediately after opening and settles at 1.21x by month 8. The important point is that even after converging, these properties remain 20% above the area benchmark. The pattern reads as a design that weights the mix toward higher price tiers via opening-commemoration plans and advance sales, then shifts to a normal operating range. It converts the depth of immediate post-opening demand into rate before easing down to a point that balances rate against occupancy — an approach midway between Type A and Type C.
The Median Time for Prices to Settle Is 4 Months
For each property we defined the “stabilization month” as the first month in which the index enters a band of ±15% around the months 6–8 average and never leaves it again. Aggregated across the 91 properties, the median is month 4 after opening. Sixteen properties are already within the stable band in the opening month, while 13 still have not settled after eight months.
By type, the step-up (B) and area-tracking (C) types have a median of 4 months, opening-premium convergence (D) 5 months, and sustained premium (A) 6 months. Type A is slowest to stabilize because the higher a property’s rate level, the larger its day-to-day and day-of-week swings, so variance survives even after monthly smoothing. This is better read as the price elasticity characteristic of the high-rate tier than as an unstable level.
The practical implication is clear. When building a monthly budget for the first operating year, assume rates will not be steady for at least the first four months after opening. Dividing an annual average ADR into 12 equal monthly slices tends to diverge sharply from what actually happens over this window.
20% of “New Openings” Are Rebrands or Conversions
Any discussion of ramp-up has to confront what these opening projects actually consist of. Among the 91 properties analyzed, 18 (19.8%) carried over their existing OTA listing ID while changing name and brand — that is, price data exists for them from at least two months before the stated opening month. All of these are rebrands or conversions of existing buildings.
Because this method cannot detect projects that were re-registered under a brand-new listing ID, the figure of 18 properties is a lower bound on the rebrand share. Indeed, Royal Pines Hotel Chiba (ロイヤルパインズホテル千葉) (208 rooms, January 15, 2025) is a rebrand of the former Mitsui Garden Hotel Chiba, and Hotel Enoe Toyama (ホテルエノエ富山) (227 rooms, August 29, 2025) is likewise a rebrand opening of an existing hotel; both were registered under new IDs and so fall outside the 18. In reality, at least 20% — and effectively more — of what gets counted as a “2025 opening” is the regeneration of existing stock.
The two trajectories differ clearly. The confirmed-rebrand group starts at 1.28x the area benchmark in the opening month and still holds 1.19x at month 8. The new-build group, by contrast, runs flat throughout — 1.12x in the opening month and 1.13x at month 8. Rebrand projects, which inherit existing occupancy track record, review assets and corporate contracts, hold a structural advantage in taking a high price position from day one. Converting an existing property to a new brand can lift its price band in less time and with less capital than a new build — a structure driven by the same inherited intangibles described here.
How a Rebrand Feeds Through to Rate — the Kobe Marriott Case
The clearest time-series view of a price position shifting through a rebrand is Kobe Marriott Hotel (神戸マリオットホテル) (186 rooms). It opened on December 1, 2025 as the first rebrand under the partnership between Hotel Management International and Marriott International, following a full renovation of the former Hotel Crown Palais Kobe. Room inventory was reconfigured from 229 to 186, and an executive lounge exclusive to club-floor guests was added on the 17th floor. The location — directly connected to JR Kobe Station, on the Kobe Port waterfront — is unchanged.
Looking at estimated settled ADR, the pre-rebrand months of September–November 2025 sat in a range of ¥10,100–¥14,700. In the rebrand month of December 2025 it jumped to ¥21,200, then eased to ¥18,900 in January 2026 and ¥16,900 in February, before stepping back up to ¥17,800 in March, ¥18,100 in April and ¥19,000 in May. Against a pre-rebrand three-month average of roughly ¥12,700, the post-rebrand January–March 2026 average of roughly ¥17,900 represents a level shift of about 1.41x.
What to note here is the two-stage movement: the rate jumps a step, loosens once, and then builds again. The level captured on opening buzz does not simply stick. Instead, an ability-based level is rebuilt over months three to six as reviews accumulate and OTA ranking exposure firms up. In Kobe Marriott Hotel’s case, it was still holding the ¥17,500 range as of June 2026 — well above its pre-rebrand level.
One more example, this time with less time since opening: The Gate Hotel Sapporo by HULIC (ザ・ゲートホテル札幌 by HULIC) (172 rooms). It opened on December 20, 2025 in the upper floors of a mixed-use complex in front of Sapporo Station, the brand’s first entry into Hokkaido and its seventh property in Japan. Estimated settled ADR has swung widely: ¥30,100 in the opening month, ¥21,200 in January 2026, ¥41,100 in February, ¥28,500 in March, ¥17,700 in April, ¥26,000 in May and ¥26,100 in June. Hokkaido city hotels as a whole showed substantial seasonal variation over the same period, so this swing reads as peak-and-trough differences being passed through to rate. It is consistent with the earlier finding that monthly rates at properties barely six months past opening have yet to settle into a steady range.
How Rate Increases and Inventory Depletion Fit Together
At step-up (Type B) properties, how does inventory get absorbed while rates are being raised? Here we take two properties whose OTA-published allocation is large enough to track remaining rooms on a room-count basis.
THE NEST Naha (THE NEST那覇) (366 rooms), developed by Mitsubishi Estate, Fujita and others, opened on July 15, 2025 as the first property under Nest Hotel Japan’s top-tier brand “THE NEST.” It features a heated infinity pool on the top floor, and roughly half its rooms are quad-occupancy types. On the ramp-up index it records an entry level of 1.50 and an uplift of 1.16x by month 8.
For check-ins on Saturday, June 20, 2026, remaining rooms ran 297 at LT90, 250 at LT60, 172 at LT30, 118 at LT14, 80 at LT7 and 57 at LT3, depleting smoothly across the entire lead-time span and reaching zero remaining rooms at LT1. The maximum allocation published to OTAs during the observation window equals 81.7% of total rooms, a level that captures most of the property’s overall inventory behavior.
Hotel Enoe Toyama (ホテルエノエ富山) (227 rooms) traces a similar shape. For check-ins on Saturday, July 11, 2026, remaining rooms ran 173 at LT90, 168 at LT60, 140 at LT30, 106 at LT14, 58 at LT7, 25 at LT3 and 2 at LT1. Published allocation equals 76.7% of total rooms. Depletion accelerates from LT30 onward, with roughly 80% of inventory moving in the final month — a picture in which the depth of last-minute demand underpins the headroom to raise rates.
What both properties share is that they sell through in stages while keeping inventory available across the full lead-time span. Release inventory too early and you forfeit the chance to lift rates close in; hold back too hard and you expose yourself to discounting pressure near arrival. Behind the step-up type’s ability to add a little over 30% to rate within eight months is exactly this control of inventory allocation. Post-opening rate growth is not achieved by pricing decisions alone — it is designed jointly with how inventory is released.
Essential-Tier Entrants Are Also Staking Out Price Positions
The 2025 opening cohort also includes Japanese market entries by essential-tier (accommodation-led, lifestyle-format) foreign brands. Caption by Hyatt Kabutocho Tokyo (キャプション by Hyatt 兜町 東京) (195 rooms) opened on October 7, 2025, bringing Hyatt Japan’s domestically operated portfolio to 9 brands, 22 hotels and 5,066 rooms. Caption by Hyatt belongs to the group’s essential portfolio, and this is its second property in Japan after Namba Osaka, which opened in June 2024.
The property is still early in its life, so the window over which we can observe monthly estimated settled ADR stably remains limited. Recently it recorded ¥40,800 in June 2026 and ¥39,500 in July (estimated from listing levels as of the survey date) — clearly in the upper range for the Tokyo business hotel tier. A design that stakes out a price position close to the full-service tier while operating as an accommodation-led product suggests a ramp-up closer to Type A, sustained premium. Hyatt Japan has announced 10 further hotel openings including Hyatt Centric Sapporo (216 rooms, scheduled to open in 2026), putting the brand portfolio in a phase of deepening scale. The price position of that brand in the Hokkaido market is covered in Hyatt Centric Sapporo Opens: Foreign Brands Reshape Hokkaido ADR.
How to Set the ADR Assumption in a Pre-Opening Budget
From the analysis so far, three implications translate directly into opening-plan practice.
First, set first-year ADR as a ratio to the area rather than as an absolute area amount. The median across the 91 properties is 1.16x in the opening month and 1.13x at month 8: landing a little over 10% above a standard area property is the normal outcome for a new hotel with 100+ rooms. A realistic approach is to take 1.1–1.2x the area median estimated settled ADR as the central initial scenario, 1.4x or higher where brand, location and product advantages are clear, and around 1.0x for an accommodation-led property following an existing chain standard. Because seasonality is absorbed by the area-side index, the same ratio can be carried through when building the monthly budget.
Second, entry level and headroom trade off against each other. Type B, which entered at 0.93x, reached 1.18x within eight months, whereas Type A’s uplift ratio from 1.66x was flat and Type D converged from 1.47x to 1.21x. Enter high and the headroom is small; enter low and there is more room to build. Neither is inherently superior — the difference is one of design philosophy, whether to prioritize ramping occupancy or rate. What matters is deciding which type you are pursuing before opening and building the budget to match. On a median basis, all four types land above the area benchmark at month 8 (1.03x to 1.64x), so all four are financially rational.
| Scenario | Opening month level |
Month 8 level |
Representative design / matching type |
|---|---|---|---|
| Optimistic (upper quartile) | 1.46 | 1.49 | Clear brand, location and product advantage. Centered on A. Sustained premium (14 properties, 1.66x to 1.64x) |
| Median (mid case) | 1.16 | 1.13 | Lands a little over 10% above the area benchmark. Close to C. Area-tracking and D. Opening-premium convergence |
| Pessimistic (lower quartile) | 0.88 | 0.95 | Accommodation-led properties following an existing chain standard, or trade areas with high competitive density |
| Entry level \ Uplift ratio | 0.85 converging |
1.00 flat |
1.15 gradual |
1.30 stepped |
|---|---|---|---|---|
| 0.90 | 0.77 | 0.90 | 1.03 | 1.17 Type B |
| 1.00 | 0.85 | 1.00 Type C | 1.15 | 1.30 |
| 1.15 | 0.98 | 1.15 | 1.32 | 1.49 |
| 1.30 | 1.10 | 1.30 | 1.49 | 1.69 |
| 1.50 | 1.27 Type D | 1.50 Type A | 1.72 | 1.95 |
Third, the channels that push rates up during the ramp-up period are OTA exposure and review accumulation. As seen in the Kobe Marriott Hotel case, the pattern of a rate jumping immediately after a rebrand and then building again over months three to six corresponds to review volume accumulating and OTA display ranking stabilizing. Immediately after opening, listing rank is unstable, and situations arise where price is the only lever available to secure exposure. Put the other way: build in a design that accumulates ratings from the advance-booking period before opening, and you shorten the time to rate stabilization by that much. That step-up properties reach the stable band at a median of 4 months reads as this launch design working.
In addition, the fact that rebrand and conversion projects stand at a high 1.28x from day one points to the investment appeal of regenerating existing stock. Within the scope of this analysis, the price impact of inheriting intangibles — occupancy track record, review assets, corporate contracts — amounts to roughly 14% versus new-build projects (1.28x against 1.12x). In a phase where construction costs are rising and the hurdle for making a new build viable is climbing, this gap can become a factor that decides development calls, and the breakeven between renovation investment and new construction deserves case-by-case examination.
Conclusion
Tracking the ramp-up index on a relative monthly timeline anchored to the opening month, across 91 of the 136 properties with 100+ rooms that opened in 2025, shows that the standard new hotel prices at 1.16x the area benchmark in its first month and still holds 1.13x eight months later. As a market-wide median, rates do not grow much after opening.
Inside that median, however, four clearly distinct designs coexist: sustained premium (14 properties, steady at 1.66x), step-up (19 properties, 0.93x to 1.18x), area-tracking (31 properties, flat at 1.03x) and opening-premium convergence (27 properties, 1.47x to 1.21x). We also confirmed a tendency for large business hotels in the 200-room class to cluster in the step-up type, and for upper floors of mixed-use developments and first-entry brand projects to cluster in the sustained-premium type.
The median time for prices to settle into a steady range is 4 months from opening. A monthly budget that builds in this window, plus an allocation design that keeps inventory available across the full lead-time span, is what determines first-year revenue. And at least 20% of “new openings” are rebrands or conversions — a group that clearly takes a higher price position from day one. Whether reading supply data or building a business plan, it is well worth keeping this distinction in view.
⚠ Note on ADR for future dates: Estimated settled ADR shown in this article for July 2026 and later is an estimate based on selling prices published on OTAs and similar channels as of the survey date, and will change as the check-in date approaches. Figures for past months are estimates based on confirmed listing records. In addition, new-opening data is on an OTA-listing-confirmed basis, and because listings appear several months before opening, property counts for the most recent months onward may increase as further listings are reflected.
Further Reading
- May-Aug 2026 Supply Shock: 25 Hotels, 5,091 Rooms Across Japan
- 582 Hotels Opening 2026: 30-Room Luxury vs 200+ Scale Polarization
- Construction +41% & Labor Crunch Erase Japan’s 2027-2029 Hotel Supply
- Hyatt Centric Sapporo Opens: Foreign Brands Reshape Hokkaido ADR
- All Market Trends articles
- All Supply Pipeline articles
- All Area & Property Analysis articles
References and Sources
■ Data sources
The population consists of 136 hotels with 100 or more rooms (25,416 rooms) confirmed to have opened (begun being listed) in 2025 on a major-OTA listing basis. The analysis set is the 91 properties (18,130 rooms) for which monthly estimated settled ADR could be obtained continuously from the opening month through month 8 and matched against the area benchmark for the same prefecture and category. The area benchmark is the median estimated settled ADR for each prefecture and each category.
■ Calculation assumptions
The ramp-up index is defined as “a property’s estimated settled ADR for the month divided by the median area estimated settled ADR for the same prefecture and same category,” and comparisons use this ratio rather than absolute amounts in order to strip out seasonality. For type classification, the uplift ratio is the average for months 6–8 (stable level) divided by the average for the opening month through month 1 (entry level); 1.15 or above is the step-up type, 0.88 or below is the opening-premium convergence type, among the remainder an entry level of 1.25 or above is the sustained-premium type, and the rest are the area-tracking type. The stabilization month is defined as the first month in which the index enters a band of ±15% around the months 6–8 average and never leaves it again. Tables 2 and 3 are calculations reconstructed from the observed values presented in the article (quartiles and type-level medians) and are not actual results for individual properties.
■ Limitations and caveats
(1) This is not a complete census; the tally is limited to properties whose OTA listings could be confirmed. (2) ADR is an estimate produced by applying category-specific adjustments to published selling prices, and differs from each property’s actual transacted rates and accounting figures (median error of 7.5% against listed REIT disclosures). (3) Rebrand identification relies on continuity of the listing ID, so projects re-registered under a new listing ID cannot be detected; 18 properties and 19.8% are lower bounds. (4) The conditions of 100+ rooms and eight consecutive months of observation exclude small properties and properties that have only just opened from the population. (5) Remaining-room trends are on an OTA-published-allocation basis and do not match a property’s total inventory (the published-allocation ratio is stated alongside each figure in the article).
■ Market data
- MetroEngines Research — monthly estimated settled ADR (N=91 properties, opening month through month 8), area-level estimated settled ADR, remaining-room trend data
- MetroEngines Research & Consulting (OTA-listing-confirmed basis, N=136 properties, 25,416 rooms) — list of hotels opened in 2025
■ Primary sources on properties and openings
- Hotel Management International Co., Ltd., “Kobe’s first Marriott-brand hotel is born: ‘Kobe Marriott Hotel’ to open Monday, December 1, 2025” (in Japanese)
- Hulic Hotel Management Co., Ltd., “‘The Gate Hotel Sapporo by HULIC’ to open on Saturday, December 20, 2025” (in Japanese)
- Mitsubishi Estate Co., Ltd., “‘THE NEST Naha’ opens July 15” (July 14, 2025, in Japanese)
- Hospitality Operations Co., Ltd., “Second property under the new brand, ‘Hotel Enoe Toyama,’ rebrand opening on Friday, August 29, 2025” (in Japanese)
- Solare Hotels and Resorts Co., Ltd., “Reservations open for ‘Royal Pines Hotel Chiba,’ scheduled to open January 15, 2025” (in Japanese)
- Hyatt Japan Co., Ltd., “Press materials, April 2026”