

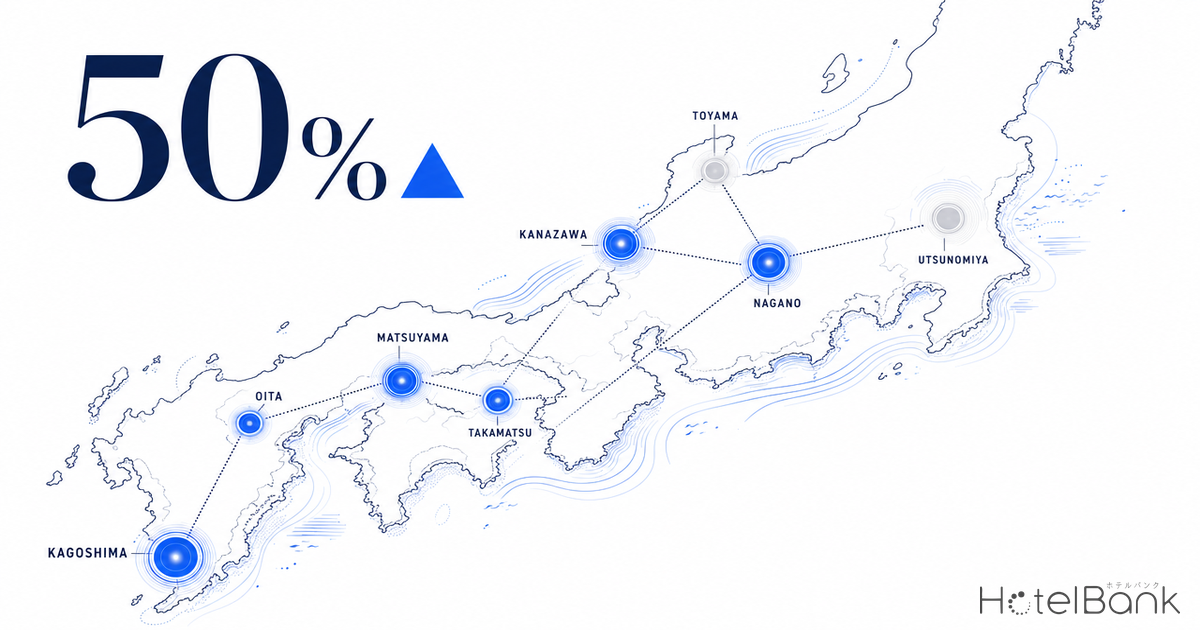
Operating a hotel — or considering acquiring one — in a regional core city inevitably raises one question first: How much additional room supply can this city absorb? This report maps supply absorption capacity across eight regional core cities not yet examined as standalone themes (Kanazawa, Matsuyama, Takamatsu, Toyama, Kagoshima, Utsunomiya, Oita, Nagano), overlaying two indicators: the “Golden Week (GW) 2026 sellout observation rate” as a proxy for demand strength, and “2026 new hotel openings” as a proxy for supply pressure. All sellout judgments are made on a room basis (using remaining inventory count), and we use data from check-in dates that have already occurred.
Metric Definitions Used in This Article
- ADR (Average Daily Rate): The average of published prices on OTAs and similar channels. This differs from actual transaction prices (cross-checked against REIT disclosures, published-price ADRs run on average 25–30% higher than transaction ADRs, because unsold higher-priced plans remain visible and pull the published average upward). Rate is per room per night for double occupancy (tax included), averaged across all plans (from room-only to meal-inclusive).
- Sellout Observation (room basis): The number of days on which an individual hotel’s OTA remaining inventory reached zero. Judged only on room count, not on plan-count ratios.
- LT (Lead Time): Days remaining until check-in. LT0 = same day. Early sellout LT = the lead time at which remaining inventory first reached zero (larger value = earlier sellout).
- OCC (Occupancy Rate, estimated): The ratio of sold rooms to total room stock within an area (estimated from OTA-visible inventory).
- Data Sources: MetroEngines Research & Consulting; Ministry of Land, Infrastructure, Transport and Tourism (MLIT) “Building Construction Statistics Survey”; and others.
- — All 8 target cities show GW2026 sellout rates within an “absorption-capacity-present” range. The top cities are Toyama and Utsunomiya at 50.0%; the lowest is Nagano at 18.4%.
- — Crossing demand × supply produces 3 archetypes: Growth type (Matsuyama, Utsunomiya = strong demand × supply growth), Stock-thick type (Toyama, Kanazawa, Kagoshima, Oita = strong demand × flat supply), Improvement-room type (Takamatsu, Nagano).
- — New-supply ratio for 2026 is highest in Utsunomiya +10.5% and Matsuyama +9.3%; the other 6 cities are essentially flat. Construction costs are up +41% per tsubo (2022→2024), structurally suppressing new supply.
- — Representative properties reach zero rooms at LT33–35 — inventory is consumed more than a month before check-in. Room to expand revenue by minimizing early-booking discounts and pricing progressively.
- — GW average ADRs range from ¥29,600 to ¥56,100. ADR and sellout rate are not proportional (Kanazawa has the highest ADR ¥56,100 yet a sellout rate of 34.8%).
Conclusion — All 8 Cities Fall Within “Absorption Capacity Present,” but the Ranking Differs
The conclusion first. Measured by GW2026 sellout observation rate (the share of properties — among those with OTA-visible inventory equal to or greater than 30% of total rooms — that recorded at least one day of sellout), all 8 cities are demonstrably solid on the demand side. Highest: Toyama and Utsunomiya at 50.0%. Followed by Matsuyama at 40.0%, Kagoshima at 37.7%, and Kanazawa at 34.8%. A sellout observation rate above 30% generally indicates a “phase in which peak demand pushes past existing inventory = significant supply absorption capacity.” Takamatsu (28.0%) and Nagano (18.4%) sit mid-pack with headroom.
Turning to 2026 new openings within the same 8 cities: within core-city administrative boundaries, Matsuyama sees 696 rooms open, Utsunomiya 559 rooms, Takamatsu 199 rooms, Kagoshima 151 rooms — meaningful supply pipelines — while Kanazawa, Toyama, Oita, and Nagano are essentially flat. Overlaying demand strength (sellout rate) with supply growth reveals: Matsuyama and Utsunomiya are “cities where new supply rides on strong demand — large absorption capacity”, while Toyama, Kanazawa, Kagoshima, and Oita are “cities with strong demand but essentially flat supply — thick revenue opportunity in existing stock”.
Source: MetroEngines Research & Consulting (GW2026 sellout observation, N shown in table below) / OTA listing-confirmed data based on MLIT “Building Construction Statistics Survey”
The Certainty of Demand — Measuring GW2026 Sellout on a Room Basis
ADR alone tells only half the demand story. High prices matter only if rooms sell; conversely, if solid prices sell out consistently, demand is thick. We therefore aggregate — on a room basis — how many existing hotels in each city hit zero remaining inventory for GW2026 (check-in Monday, May 4, 2026), a confirmed peak day. Because the check-in has already occurred, the sellout signal is a settled ground truth — a key strength of retrospective analysis.
The analysis is restricted to properties whose OTA-visible inventory represents at least 30% of total rooms. Properties with extremely limited OTA exposure cannot be meaningfully described as “sold out,” so this filter reduces per-city denominators (40–130 properties) to a high-confidence 20–66 properties. In the table below, Toyama shows 7 of 14 analysis-target properties observed selling out on at least one day; Utsunomiya shows 16 of 32.
| Core City | Sellout Rate | Sellout / Analyzed | GW Avg ADR | vs Weekday | Absorption Capacity |
|---|---|---|---|---|---|
| Toyama (富山市) | 50.0% | 7 / 14 | ¥44,100 | +71% | Large |
| Utsunomiya (宇都宮市) | 50.0% | 16 / 32 | ¥30,600 | +75% | Large |
| Matsuyama (松山市) | 40.0% | 12 / 30 | ¥48,300 | +65% | Large |
| Kagoshima (鹿児島市) | 37.7% | 20 / 53 | ¥32,500 | +61% | Large |
| Kanazawa (金沢市) | 34.8% | 23 / 66 | ¥56,100 | +139% | Large |
| Oita (大分市) | 30.0% | 6 / 20 | ¥29,600 | +80% | Large |
| Takamatsu (高松市) | 28.0% | 14 / 50 | ¥46,400 | +65% | Mid |
| Nagano (長野市) | 18.4% | 7 / 38 | ¥33,400 | +55% | Mid |
Note: Sellout observation rate = share of properties (whose OTA-visible inventory ≥ 30% of total rooms) observed selling out (room basis) for at least one day for GW2026 (May 4 check-in). GW average ADR is May 4, 2026; the “vs Weekday” column compares to Wednesday, June 10, 2026.
Source: MetroEngines Research & Consulting
Notably, ADR level and sellout rate are not necessarily proportional. Kanazawa’s GW average ADR of ¥56,100 is the highest of the 8 cities — an aggressive +139% premium over weekday levels — yet its sellout rate of 34.8% sits at the lower end of the top group. This is not weak demand; rather, it reflects a market with a thick demand layer that can absorb aggressive rate hikes on a shinkansen-connected tourist city while still selling out over 30% of properties. It is a market consciously balancing rate and occupancy. Utsunomiya, in contrast, holds ADR to a solid ¥30,600 while achieving 50.0% sellout — evidence that a “price disciplined, fill reliably” playbook has spread market-wide, leaving substantial revenue upside if combined with progressive pricing.
The Path to Sellout — Reading Booking Behavior from Early Sellout LT
Beyond the sellout “rate,” the lead time at which sellout is reached also speaks to the quality of a market’s demand. We examine the booking trajectory (remaining-inventory curve by LT) of the representative earliest-sellout property in two cities for GW2026. Both properties have OTA-visible inventory covering more than half of total rooms — high-confidence sellout signals.
The representative property in Kanazawa (a ryokan-format, 64 rooms, sufficient OTA-visible inventory) showed 20 of 64 rooms remaining at LT55, dropped below double digits from around LT44, and reached zero remaining rooms at LT35 (35 days before check-in, roughly late March), with the sellout state observed across 28 cumulative days thereafter. The representative property in Matsuyama (city hotel, 88 rooms) similarly reached zero rooms at LT33, with 30 cumulative days of sellout observed. Neither pattern reflects “last-minute demand filling the room;” both reflect a demand structure in which inventory is consumed steadily from more than a month out — a market where fixing rates late and raising them progressively can function.
Source: MetroEngines Research & Consulting
This “sellout-by-LT30s” pattern has strong implications for revenue management. If inventory thins more than a month ahead of check-in, there is time to shift remaining inventory toward higher price bands. In markets where booking power is already proven, the opportunity to expand revenue lies in minimizing early-booking discounts and layering progressive pricing tied to the scarcity of remaining rooms.
Supply Dynamics — Where 2026 Openings Land
Having confirmed demand, we now overlay supply. Based on OTA-listing-confirmed data captured by MetroEngines Research, 2026 new openings within the administrative boundaries of the 8 core cities (excluding vacation rentals, cottages, and similar categories) are: Matsuyama 7 properties/696 rooms, Utsunomiya 6 properties/559 rooms, Takamatsu 2 properties/199 rooms, and Kagoshima 1 property/151 rooms. Kanazawa, Toyama, Oita, and Nagano see essentially no hotel-format new supply. The chart below shows the 2026 new-supply ratio against each city’s existing total room count (based on properties MetroEngines Research can confirm as operating).
Source: MetroEngines Research & Consulting (OTA-listing-confirmed) / MLIT “Building Construction Statistics Survey”
The highest new-supply ratio is Utsunomiya at +10.5% of existing stock, followed by Matsuyama at +9.3%. Both cities also carry sellout rates of 40–50% — demand thickness leads the supply. Where supply lands on strong demand, the market has room to absorb the new inventory. Furthermore, amid ongoing construction-cost inflation (see next section), new development at this pace tends to self-limit — an added upside for existing properties, which are less exposed to excessive competitive escalation.
Meanwhile, Kanazawa, Toyama, Oita, and Nagano see essentially flat hotel-format supply for 2026. Sellout observations of 30–50% (Nagano at 18.4%) confirm demand, yet supply does not expand — so the revenue opportunity in existing stock is relatively thick. Toyama in particular combines a 50.0% sellout rate with near-zero new supply, positioning existing properties to capture demand.
Note: New-opening data is on an OTA-listing-confirmed basis; because listings typically appear several months ahead of opening, months later in 2026 may see property and room counts increase in subsequent listings. The supply ratios in this report reflect observations at the time of analysis.
Absorption Capacity Map — Reading the 8 Cities Through Demand × Supply
Overlaying demand (sellout rate) with supply (new openings as % of existing stock) onto a map reveals the investment and operating geography of regional core cities. In the map below, circle size represents existing total room count and color intensity represents sellout rate.
Source: MetroEngines Research & Consulting
The map organizes into three broad archetypes. First, the Matsuyama/Utsunomiya type (strong demand × supply growth): 40–50% sellout rates carry +9–10% new supply against existing stock. A market in expansion, with absorption capacity for both new development and existing operations — the growth type. Second, the Toyama/Kanazawa/Kagoshima/Oita type (strong demand × flat supply): demand is confirmed but supply does not grow, so the runway for occupancy and rate expansion in existing properties is thick. Third, the Takamatsu/Nagano type (mid demand): sellout rates of 18–28% leave headroom for demand creation via seasonality/event linkages and pricing optimization. Takamatsu, in particular, is aligned with the Setouchi development momentum — that investment structure is analyzed further in Setouchi Area Investment Analysis Anchored on the Takamatsu × Naoshima Mandarin Oriental Development.
Growth Type (Strong Demand × Supply Growth)
Matsuyama, Utsunomiya
Sellout rate 40–50%, +9–10% new supply vs existing stock. Market in expansion, with absorption capacity for both new development and existing operations.
Stock-Thick Type (Strong Demand × Flat Supply)
Toyama, Kanazawa, Kagoshima, Oita
Sellout rate 30–50% with supply essentially flat. Thick runway for occupancy and rate expansion in existing properties.
Improvement-Room Type (Mid Demand)
Takamatsu, Nagano
Sellout rate 18–28%. Room for upside through demand creation and pricing optimization.
Investment & Development Context — What Absorption Capacity Means Under Construction-Cost Inflation
Construction-cost dynamics cannot be avoided when considering new development or acquisition in regional core cities. According to MLIT’s “Building Construction Statistics,” 2024 average hotel construction cost across all structures ran approximately ¥1,950,000 per tsubo — up +41% from roughly ¥1,380,000 in 2022 over two years. Factoring in inflation over the construction period, projects opening in 2026–2028 face an additional roughly +5%/year (Turner & Townsend estimate base). This construction-cost trajectory structurally suppresses the pace of new supply.
Overlaying our absorption-capacity map onto this backdrop sharpens the investment thesis. In markets where demand is strong (sellout rate above 30%) and new supply is not expanding — Toyama, Kanazawa, Kagoshima, Oita — construction-cost inflation acts as a barrier to new entrants, so the relative advantage shifts toward acquiring existing stock and improving revenue via operations. In Matsuyama and Utsunomiya, where supply is following demand expansion, new development can pencil, but feasibility must conservatively price in construction costs.
For revenue-generation benchmarking, we reference operating results disclosed by listed REITs. GOP margin (gross operating profit as % of revenue) is generally observed at 35–40% for stabilized portfolios. For opening-year properties, a conservative 30% is prudent, and viability for limited-service formats in regional core cities is then tested against ADR band. The 8 cities in this report show GW average ADRs of ¥29,600–¥56,100 and weekday ADRs of ¥16,000–¥29,000. This price resilience reflects that regional-core lodging demand is supported by a mix of business travel, tourism, and events.
| Assumed ADR | GOP 30% (Bear) | GOP 35% (Base) | GOP 40% (Bull) |
|---|---|---|---|
| ¥18,000 (weekday floor) | ¥5,400 | ¥6,300 | ¥7,200 |
| ¥24,000 | ¥7,200 | ¥8,400 | ¥9,600 |
| ¥30,000 (Utsunomiya GW ADR) | ¥9,000 | ¥10,500 | ¥12,000 |
| ¥44,000 (Toyama GW ADR) | ¥13,200 | ¥15,400 | ¥17,600 |
| ¥56,000 (Kanazawa GW ADR) | ¥16,800 | ¥19,600 | ¥22,400 |
Note: Simple GOP-per-room-night estimate computed as ADR × GOP rate. GOP-rate scenarios reflect industry ranges cited in the text (stabilized: 35–40% / opening year: ~30%) mapped to bear, base, and bull cases. Excludes fixed costs, cost of capital, and seasonality; actual viability depends on occupancy, period-average ADR, and operating-cost structure.
Scope of this analysis: Sellout observation rates and ADRs are estimates using properties MetroEngines Research can confirm as operating as the denominator. New-opening data is on an OTA-listing-confirmed basis; subsequent listing additions may increase counts. The viability estimates are simple; actual investment decisions require a detailed feasibility study. This is a retrospective analysis of a confirmed peak day (GW2026) and does not guarantee future demand.
Summary
Reading the 8 regional core cities through “GW2026 sellout rate (demand) × 2026 new openings (supply)” reveals markets with supply absorption capacity — but with clearly differentiated characters. Matsuyama and Utsunomiya represent a growth type where supply rides demand expansion; Toyama, Kanazawa, Kagoshima, and Oita represent a stock-thick type with strong demand and flat supply; Takamatsu and Nagano represent an improvement-room type with mid demand. Under an environment where construction-cost inflation suppresses new supply, the relative advantage of acquiring and improving existing stock in demand-confirmed core cities is rising — and this report provides a quantitative starting map. Room-basis sellout judgments on confirmed peak days ground each city’s demand certainty on solid footing.
Related Reading
- Setouchi Area Investment Analysis Anchored on the Takamatsu × Naoshima Mandarin Oriental Development
- Structural Analysis of Regional-Bank-Led Small-Scale Serial Development & Renovation Funds — Funding Supply vs Large REIT Acquisitions
References & Sources
■ Data Sources
MetroEngines Research & Consulting OTA published-price and remaining-inventory data (room-basis sellout observation, GW2026 = May 4, 2026 check-in); OTA-listing-confirmed 2026 new-opening data; MLIT “Building Construction Statistics Survey (Building Starts).” Targets: 8 regional core cities (Kanazawa, Matsuyama, Takamatsu, Toyama, Kagoshima, Utsunomiya, Oita, Nagano).
■ Estimation Basis
Sellout observation rate = share of properties whose OTA-visible inventory ≥ 30% of total rooms (denominator per city: 20–66 properties), observed reaching zero remaining rooms on at least one day. ADR = published price for double occupancy, all-plan average (runs on average +25–30% higher than transaction ADR). New-supply ratio = 2026 new-opening room count relative to each city’s existing total room count (based on operating-confirmed properties). GOP margins reference listed REIT disclosures (stabilized: 35–40% / opening year: ~30%).
■ Limitations & Caveats
This is a retrospective analysis of a confirmed GW2026 peak day and does not guarantee future demand. Sellout observation rates and ADRs are estimates using operating-confirmed properties as denominator; new-opening data on an OTA-listing-confirmed basis may see additions in future listings. Viability estimates are simple; actual investment decisions require detailed feasibility studies.
■ Market Data
- MetroEngines Research & Consulting — OTA published-price data, room-basis sellout observation (GW2026 / May 4 check-in), estimated occupancy, OTA-listing-confirmed new-opening data
■ Government Statistics & Public Data
- MLIT “Building Construction Statistics Survey (Building Starts)”
- Japan Tourism Agency “Overnight Travel Statistics Survey”
■ Industry & Profitability References
- Monthly operating disclosures from listed hotel REITs (industry-level references for GOP margins and occupancy)
- Turner & Townsend construction-cost inflation forecasts (referenced for construction-period inflation)