

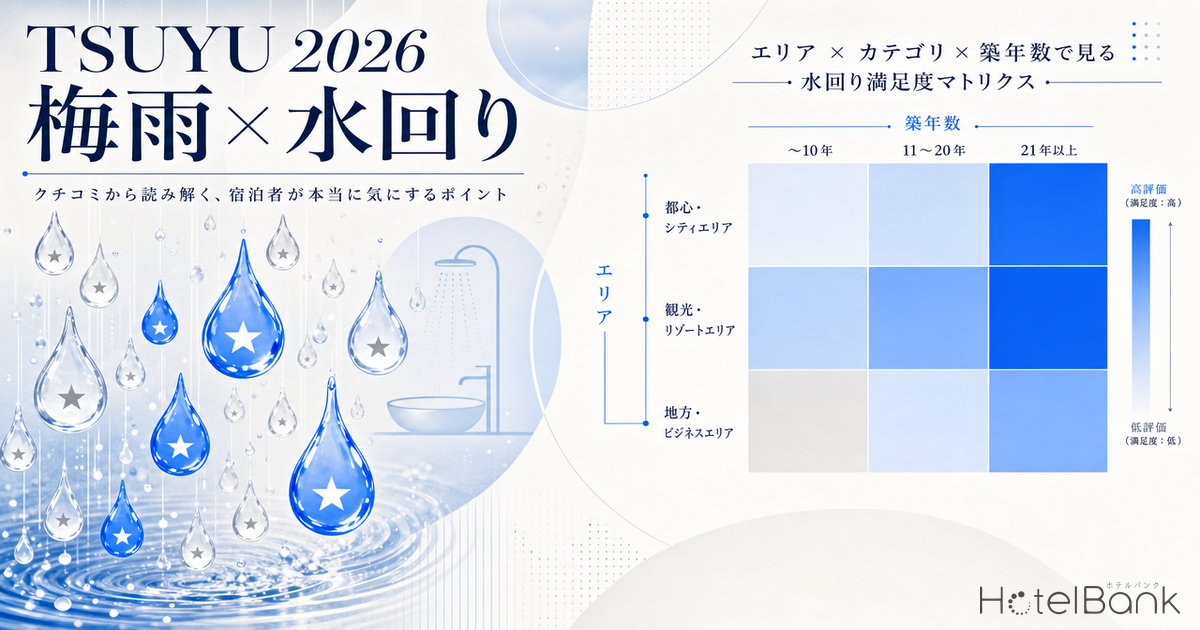
With the rainy season approaching, hotel bathroom areas (bath, washbasin, toilet) have become one of the most critical facility categories influencing guest satisfaction. According to LIXIL’s lodging facility survey, bathroom-area complaints rank among the top reasons guests cite for “rooms they would not stay at again,” and recognition is growing among hotel operators that this is a priority management issue.
In this article, the HotelBank Editorial Team analyzes N=25,247 bathroom-related guest reviews compiled across 6 areas x 4 categories from 2015 to 2018, quantifying review-score gaps by area, category, and building age. We also compare review-score changes before and after renovations to provide a renovation-ROI-based priority ranking.
Metric Definitions Used in This Article
- Bathroom-related reviews: Guest reviews published on OTA sites that contain one or more of 25 bathroom-related keywords (e.g., “bath,” “bathroom,” “toilet,” “washbasin,” “shower,” “drain,” “mold,” “humidity”). N=25,247 covers reviews posted between 2015 and 2018 across 6 areas (Tokyo, Osaka, Kyoto, Fukuoka, Hokkaido, Okinawa) x 4 categories (Business, City, Resort, Ryokan). Keyword-based body-text analysis has not yet been fully applied to reviews posted after 2019, so this analysis should be considered a reference for structural trends rather than the latest absolute values.
- Average bathroom score: The average of overall ratings (5-point scale) given to reviews containing bathroom-related keywords.
- Dissatisfaction rate: The percentage of bathroom-related reviews classified as “negative” by sentiment analysis.
- Building age: Calculated as of May 2026 based on construction-year data. For rebranded or succeeded properties, the original construction year is used, which may differ from the interior-renovation age.
- Data source: Compiled by HotelBank Editorial Team based on MetroEngines Research
Summary: Three Facts Revealed by Bathroom Reviews
Three key findings emerge from this analysis. First, among the 24 cells in the 6-area x 4-category matrix, the lowest average bathroom score was at “Osaka business hotels” (3.627 / 17.2% dissatisfaction rate), while the highest was at “Tokyo ryokan” (4.088 / 12.6% dissatisfaction rate). Second, there is a strong correlation between building age and bathroom score, with a 0.41-point gap between properties less than 10 years old (4.121) and those over 30 years old (3.712). Third, reviews within one year after a renovation show a +0.122-point improvement compared to pre-renovation, with the dissatisfaction rate also dropping from 13.1% to 12.2%.
Lowest bathroom score
3.627
Osaka business hotels (N=3,266)
Gap: under 10 yrs vs over 30 yrs
-0.41 pt
4.121 -> 3.712 (age deterioration)
Score gain within 1 yr post-reno
+0.12 pt
3.887 -> 4.009 (dissatisfaction -0.9pt)
Area x Category: Bathroom Satisfaction Matrix
The 6-area x 4-category cross-tabulation reveals clear structural differences in bathroom scores. The city hotel group remains stable at around 4.0, while business hotels range widely from 3.6 to 4.0, with Osaka business hotels (3.627) standing 0.18 to 0.39 points below business hotels in the other five areas. This appears to reflect Osaka’s concentration of aging business hotels and the structural challenge faced by lower-priced properties built during the inbound boom, whose bathroom fixtures are now experiencing age-related deterioration.
Source: Compiled by HotelBank Editorial Team based on MetroEngines Research (N=25,247 reviews, 24 cells)
Kyoto ryokan (4.024) maintain the second-highest level after Tokyo ryokan (4.088). Many Kyoto ryokan feature large communal baths and private-reserved baths, and their investment in bathroom facilities is presumed to be relatively higher than ryokan in other areas. Meanwhile, Hokkaido ryokan (3.880) and Okinawa ryokan (3.817) rank lower within the same category, suggesting that the major-renovation cycle has likely stretched longer for ryokan in regional resort locations.
| Area | Business | City | Resort | Ryokan |
|---|---|---|---|---|
| Tokyo | 3.844 | 4.050 | 3.954* | 4.088 |
| Osaka | 3.627 | 3.999 | 4.030* | 3.952 |
| Kyoto | 4.021 | 4.025 | 3.527* | 4.024 |
| Fukuoka | 3.811 | 3.996 | 4.089* | 3.886 |
| Hokkaido | 3.913 | 3.991 | 3.891 | 3.880 |
| Okinawa | 3.994 | 4.111 | 3.990 | 3.817 |
* indicates reference value (N<50). Source: Compiled by HotelBank Editorial Team based on MetroEngines Research
Building-Age Correlation: What Happens at the 10, 20, and 30-Year Milestones
The age-based distribution of bathroom scores traces a clear step-shaped deterioration curve. Properties under 10 years old (N=2,908 reviews, 362 facilities) post an average score of 4.121 and a dissatisfaction rate of 10.1%, while properties over 30 years old (N=9,219 reviews, 1,045 facilities) decline to an average score of 3.712 and a dissatisfaction rate of 16.5%. Scores drop by 0.10 to 0.18 points per decade of age, with the decline accelerating noticeably once a property passes 20 years.
Source: Compiled by HotelBank Editorial Team based on MetroEngines Research (N=25,247 reviews)
The 20-year mark is often cited in the industry as a benchmark for hotel-bathroom renovation, and these data quantitatively support that view. LIXIL’s commentary similarly notes that “review is necessary once a property exceeds 10 years,” lending support to a two-stage approach: preventive renovation in the 10-to-20-year band and full-scale renovation after 20 years.
Area x Building Age: A 6 x 4 Deterioration Map
Breaking down age effects by area surfaces regional differences in deterioration speed. In Kyoto, properties under 10 years old post the highest bathroom score among the 6 areas (4.301, N=428), and even properties over 30 years old maintain 3.831. In Osaka, by contrast, scores fall by 0.53 points from properties under 10 years (4.074) to those over 30 years (3.540), highlighting a pronounced structural disadvantage in the aged stock.
Source: Compiled by HotelBank Editorial Team based on MetroEngines Research (N=24,376 reviews, facilities with known age only)
Tokyo, Fukuoka, and Okinawa show a pattern of sharp score decline after 20 years; Kyoto and Hokkaido fall into a “gradual deterioration” type, holding a certain level even in older age bands; and Osaka exhibits a structurally low “overall deterioration” type across all age bands. When considering renovation priorities, recognizing which deterioration pattern your property’s area-x-age position falls into provides a starting point for evaluating competitive positioning.
Monthly Seasonality: Is the Rainy Season Really the “Danger Month”?
Looking at the monthly distribution of bathroom-related reviews, summer (July to October) dissatisfaction rates are clearly higher than the year-round average. August’s dissatisfaction rate of 15.7% is the highest of any month, while September (13.8%) and October (14.4%) also remain elevated. The June dissatisfaction rate during the rainy season is 12.3%, roughly on par with the year-round average (around 13.0%), but what deserves attention is the cumulative effect from June onward. For an adjacent perspective on how hotels lift satisfaction during the rainy season through indoor-facility investment, see our Rainy June Hotels: 48-Property Review Ranking by Indoor-Facility Strength, which is a useful complement to bathroom renovation as a parallel measure. Because deterioration caused by humidity and mold surfaces with a lag of several weeks to several months, the reality is captured more accurately by “dissatisfaction surfaces from June through July-September” than by “problems occur during the rainy season.”
Source: Compiled by HotelBank Editorial Team based on MetroEngines Research (2015-2018 aggregate, N=94,149 reviews)
Given this lag, the implication is that rainy-season measures are more effective when “preventive maintenance is completed in April-May before the rainy season starts” than when “addressed after the rainy season begins.” Indeed, April’s review count (30,818) reaches 3 to 5 times that of other months, which may reflect the inflow of reviews from facilities that conducted large-scale inspections and partial renovations during spring.
Renovation Impact: Is the Within-1-Year Score Improvement Real?
Comparing bathroom review scores before and after renovation, reviews within one year after the work (N=976, 123 facilities) average 4.009 with a 12.2% dissatisfaction rate. By contrast, reviews from the one year immediately preceding renovation (N=550, 81 facilities) average 3.887 with a 13.1% dissatisfaction rate. This is a +0.122-point score improvement and a -0.9-point reduction in the dissatisfaction rate.
Source: Compiled by HotelBank Editorial Team based on MetroEngines Research (pre-reno N=550, post-reno N=976)
While +0.122 points is not large in absolute terms, in the context of the distribution of average review scores in the hotel industry, it represents a meaningful improvement. A move from 3.85 to 3.97 on overall score, for example, often shifts a property from “average” to the “top 20%” in OTA search rankings and recommendation algorithms. The -0.9-point reduction in the dissatisfaction rate further translates into roughly a 7% reduction in the absolute number of negative reviews, helping prevent missed booking opportunities.
Bathroom Renovation Priority Matrix
Integrating the above analysis, the bathroom-renovation priorities by area and category are summarized in the matrix below. Priority is determined by weighing three factors: the current score level, the potential upside from renovation, and the market size of the target segment.
| Area | Category | Current Score | Priority | Recommended Approach |
|---|---|---|---|---|
| Osaka | Business hotel | 3.627 | Top | Full bath-unit replacement, full drainage-system inspection |
| Fukuoka | Business hotel | 3.811 | High | Concentrated bathroom-area renovation, mold and odor treatment |
| Okinawa | Ryokan | 3.817 | High | High-humidity-grade waterproofing and anti-mold work |
| Tokyo | Business hotel | 3.844 | Medium | Phased partial renovation starting from properties over 20 years old |
| Hokkaido | Ryokan | 3.880 | Medium | Strengthened anti-mold treatment for large baths and onsen facilities |
| Kyoto | Ryokan | 4.024 | Maintain | Routine maintenance at the preventive-maintenance level |
| Tokyo | Ryokan | 4.088 | Maintain | Fixture refresh to sustain the current level |
Source: Compiled by HotelBank Editorial Team based on MetroEngines Research
Recommended Response by Building Age
The recommended response levels by building age can be organized into three stages. Stage 1 (under 10 years, average score 4.121) is the “preventive-maintenance phase.” Catastrophic deterioration has not yet surfaced, but annual inspection of consumable parts such as sealants, packings, and drain traps, combined with full-room anti-mold measures before the rainy season, can sustain the current score. Investment scale is roughly tens of thousands of yen to ¥100,000 per room.
Stage 2 (10 to 20 years, average score 4.016) is the “partial-renovation phase.” Full replacement of the bath unit is unnecessary, but equipment updates for shower fixtures, washbasins, and toilets, combined with refreshing interior finishes (wall panels, flooring), can lift the score into the 4.1 range. This is also the age band where leveraging subsidies such as the Japan Tourism Agency’s “Lodging Facility Sustainability Enhancement Support Program” becomes a realistic option. Investment scale is roughly ¥500,000 to ¥1.5 million per room.
Stage 3 (over 20 years, average score 3.78) is the “full renovation phase.” In many cases, large-scale work including full unit-bath replacement and piping-system updates is needed. For ROI, combining renovation with a rebranding strategy supported by ADR uplift is effective. Relo Hotel Solutions notes that bathroom-inclusive major renovations at the 20-to-30-year mark can “transform spaces dramatically into bright and clean environments.” Investment scale typically falls between ¥2 million and ¥4 million per room.
Quick-Win Actions Ahead of the Rainy Season
Large-scale renovations require time and investment, but several short-term measures are immediately actionable ahead of the rainy season. First, leverage the low-occupancy April-May window to inspect all rooms using a checklist covering three items: sealant deterioration, drain clogging, and ventilation-fan capacity. According to Japan Deodorization & Antibacterial Prevention, the most common cause of sewer odor in hotel bathrooms is dirt buildup inside drain pipes, making professional drain-pipe cleaning a cost-effective preventive measure. Industry research has also documented the extent to which odor-related guest reviews influence booking decisions, and these findings can be applied alongside the insights in this article.
Second, providing in-room amenities such as desiccants, sanitizing sprays, and hair catchers physically mitigates guest discomfort. This is a service-side measure rather than a facility renovation, can be implemented the same day, and adds only a few hundred yen per room in costs. Third, strengthen review-monitoring operations, monitor bathroom-related reviews daily during the rainy season, and respond to negative ratings within 24 hours. As this data shows, bathroom dissatisfaction surfaces cumulatively from July through October, so early detection and response in June is what suppresses the autumn score decline.
Conclusion: Bathrooms Shift from “Cost Center” to “Revenue Opportunity”
In this article, we used 25,247 bathroom-related reviews to quantify the review-score gap on three axes: area, category, and building age. The 0.41-point gap between properties under 10 years and those over 30 years is more than simple wear and tear; it produces a distinct competitive advantage gap. The +0.122-point score improvement observed within one year of renovation indicates that bathroom renovation should be repositioned not as “aging response” but as “revenue-opportunity capture.”
The rainy season is the trigger point when bathroom dissatisfaction surfaces, but the design challenge is not the rainy season itself; it is the preventive maintenance in the three months around it and the suppression of the July-to-October score decline that emerges as a cumulative effect. By formulating a staged renovation plan tailored to your property’s position based on the area-x-category priority matrix, you can deliver a structural lift to review scores and build long-term competitive advantage.
Note on data scope: The keyword-based review-text analysis in this article centers on the cumulative dataset from 2015 to 2018, and full body-text tagging of reviews from 2019 onward is still in progress. The figures in this article should be regarded as reference values for capturing structural trends; the most recent scores may have shifted.
Related Reading
References and Sources
- MetroEngines Research – Guest review dataset (25,247 reviews, 6 areas x 4 categories, 2015-2018), sentiment-tagged data
- LIXIL Business Information “Time for a Review After 10 Years? A Guide to Hotel Bathroom Renovation”
- LIXIL “Hotel and Facility Lodging Status / Usage Needs Survey Report”
- Japan Deodorization & Antibacterial Prevention “Hotel Sewer Odor and Bathroom Drain-Pipe Buildup: Causes and Countermeasures”
- Mold Inspection “Hotel Mold Complaints Are Rising: The Reality of Invisible Sanitation Issues”
- Relo Hotel Solutions “Ryokan Renovation: Costs and Keys to Success”
- SNB Corporation “Low-Cost Hotel Renewal Through Partial Renovation”
- Mizumawari Reform Kan “2026 Renovation Subsidies: Targets, Amounts, and Differences from 2025”
- Japan Tourism Agency “Accommodation Travel Statistics Survey”