

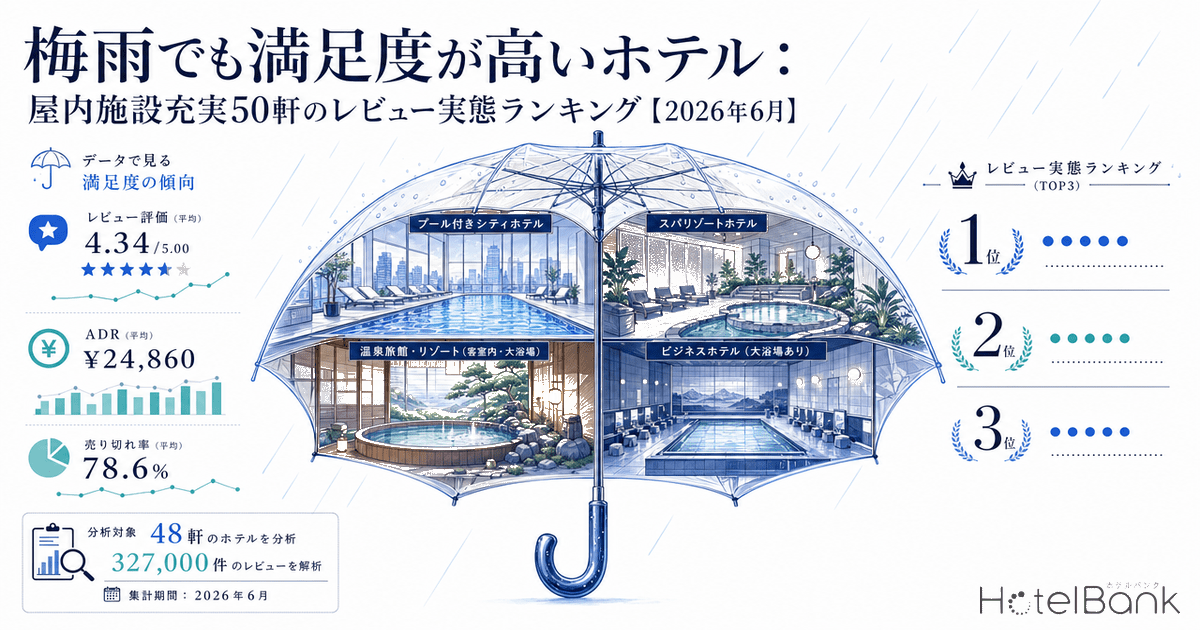
With Japan’s tsuyu (rainy season) just ahead, more travelers are agonizing over June destination choices. Many hotels promote “abundant indoor facilities” precisely because outdoor sightseeing is constrained at this time, but how do guests actually rate that pitch? This article aggregates review data from 48 properties (327,000 reviews in total) across four categories — pool-equipped city hotels, spa-rich resorts, onsen ryokan, and large-bath business hotels — and presents a category-by-category ranking of the indoor-facility-rich hotels that genuinely earn high satisfaction in June’s tsuyu season.
Metric Definitions Used in This Article
- Review Score: Category-level average rating (out of 5) tabulated from guest review data (HotelBank Editorial Team research). Five categories are compared: Facilities & Amenities, Bath & Onsen, Cleanliness, Meals, and Service.
- ADR (Average Daily Rate): Average of asking prices published on OTAs and similar channels. Differs from realized transaction prices (typically runs +25–30% above transacted ADR). Per-room rate (tax incl.) for two-person occupancy, averaged across all plans (room-only through meal-inclusive).
- Sellout Rate: Share of plans on OTAs that had closed for new bookings as of the survey date. Differs from a property’s overall room occupancy rate.
- Tsuyu-Period Premium: The percentage difference between the June ADR of the hotels covered here and the national category-average ADR.
- Data Sources: Reviews — HotelBank Editorial Team research (approx. 320,000 reviews) / Prices — MetroEngines Research / Comparisons — Japan Tourism Agency “Overnight Travel Statistics Survey”
Tsuyu Season Is Peak Time for “Indoor-Consumption” Demand
According to the Japan Tourism Agency’s “Overnight Travel Statistics Survey,” the room occupancy rate for June 2024 was 58.5%. While that is not a steep drop from the simple H1 average (59.8% in 2025), the picture varies sharply by property type. City hotels and business hotels hold above 70%, while ryokan languish in the 30% range — meaning each accommodation type captures tsuyu demand very differently.
This article identifies four property categories that answer the “fun even in the rain” demand of June’s tsuyu, and selects a total of 48 top properties from each category meeting a review-count threshold (100+ for hotels, 200+ for ryokan, 500+ for business hotels). By analyzing category-level review scores alongside June sales dynamics, we surface the consumer-perspective reality of “tsuyu-resilient hotels.”
The combined four categories average a total score of 4.66/5.0. Against a national average that hovers around 3.7, the leading indoor-facility-rich properties stand at a strikingly elevated level.
4-Category Review Comparison: Onsen Ryokan and Pool Hotels Are Neck-and-Neck on Bath & Onsen
Lining up the four categories on Analysis Item 1 (category-level scores) reveals each segment’s strengths clearly. Pool-equipped city hotels lead on Cleanliness (4.74) and Facilities & Amenities (4.58); onsen ryokan run away with Bath & Onsen (4.73) and Meals (4.50). Spa-rich resorts focus on Bath & Onsen (4.52), but their Facilities & Amenities score of 4.24 is comparatively restrained.
Source: HotelBank Editorial Team research (over 320,000 reviews aggregated, N=48 properties)
Notable point: the Bath & Onsen score for pool-equipped city hotels (4.72) is essentially level with onsen ryokan (4.73). Luxury hotels’ integrated spa-sauna-pool facilities have advanced sufficiently that even non-onsen, central-city locations now match ryokan on the “water hospitality” axis. Meals, however, come in at 4.38 — short of onsen ryokan’s 4.50 — meaning the ryokan style centered on dinner-inclusive plans still holds the upper hand on the dining axis.
Large-bath business hotels score in the low-to-mid 4.0s across all categories, somewhat modest because they sit in a different price tier — yet earning this level of satisfaction at a +10–100% premium over the ¥14,700 nationwide business-hotel average is remarkable.
Category Overview: Total Score, ADR, and Sellout Rate
| Category | Properties | Total Score | June ADR | Late-May ADR | June Sellout | Late-May Sellout |
|---|---|---|---|---|---|---|
| Pool-Equipped City Hotels | 12 | 4.84 | ¥187,000 | ¥222,500 | 0.3% | 3.4% |
| Spa-Rich Resorts | 13 | 4.5 | ¥68,400 | ¥66,000 | 1.0% | 2.3% |
| Onsen Ryokan | 13 | 4.78 | ¥122,300 | ¥123,400 | 7.9% | 14.9% |
| Large-Bath Business Hotels | 10 | 4.51 | ¥20,400 | ¥22,800 | 22.3% | 21.2% |
Source: MetroEngines Research, compiled by HotelBank Editorial Team
Looking at Analysis Item 4 — the gap between June (tsuyu) booking volume (OTA sellout rate) and a normal month — yields an interesting pattern. Onsen ryokan nearly halved from 14.9% in late May to 7.9% in June, and pool-equipped city hotels also fell sharply, from 3.4% to 0.3%. Only large-bath business hotels actually edged up, from 21.2% to 22.3%, confirming that business-trip demand remains firm even through tsuyu.
Source: MetroEngines Research, compiled by HotelBank Editorial Team
Pool-Equipped City Hotels: Top 7 by Review Score
A category overwhelmingly favored by leisure travelers — leisure-purpose share runs 92% (compiled from reviews). The total-score average of 4.84 is the highest of the four categories, drawing guests who plan to spend tsuyu in indoor pools, spas, and lounges.
| Rank | Property | Total | Bath & Onsen | Facilities | Cleanliness | June ADR |
|---|---|---|---|---|---|---|
| 1 | Kiroro, A Tribute Portfolio Hotel, Hokkaido (キロロトリビュートポートフォリオホテル北海道) Hokkaido, 282 rooms, Luxury |
5.00 | – | 3.88 | 4.28 | – |
| 2 | The Peninsula Tokyo (ザ・ペニンシュラ東京) Tokyo, 314 rooms, Luxury |
4.91 | 4.68 | 4.65 | 4.83 | ¥381,200 |
| 3 | The Prince Gallery Tokyo Kioicho (ザ・プリンスギャラリー 東京紀尾井町) Tokyo, 250 rooms, Luxury |
4.90 | 4.76 | 4.72 | 4.83 | ¥177,000 |
| 4 | The Okura Tokyo Tokyo, 508 rooms, Luxury |
4.86 | 4.83 | 4.8 | 4.9 | ¥147,100 |
| 5 | Four Seasons Hotel Kyoto (フォーシーズンズホテル京都) Kyoto, 123 rooms, Luxury |
4.85 | 4.71 | 4.55 | 4.8 | – |
| 6 | Conrad Osaka (コンラッド大阪) Osaka, 164 rooms, Luxury |
4.83 | 4.61 | 4.58 | 4.83 | ¥145,100 |
| 7 | The Capitol Hotel Tokyu (ザ・キャピトルホテル東急) Tokyo, 251 rooms, Luxury |
4.82 | 4.73 | 4.74 | 4.83 | ¥232,400 |
Source: HotelBank Editorial Team research / MetroEngines Research
Tokyo central-city luxury properties dominate the top spots. The Okura Tokyo is particularly noteworthy: cleanliness 4.80, facilities 4.83, and a 4.86 total — sustaining top-tier scores across every dimension despite its 507-room scale. Iconic properties from Kansai through Kanto also fill out the list, including Conrad Osaka, Arima Grand Hotel, and Hotel Chinzanso Tokyo.
Spa-Rich Resorts: Top 7 by Review Score
The cohort of properties branded as “Resort & Spa.” Total-score average is 4.5. Bath & Onsen at 4.52 may look modest next to other categories, but recall that 80% of these properties sit outside designated onsen districts — making it significant that artificial-onsen and spa-treatment facilities score this well.
| Rank | Property | Total | Bath & Onsen | Facilities | Cleanliness | June ADR |
|---|---|---|---|---|---|---|
| 1 | Hyatt Regency Hakone Resort & Spa (ハイアットリージェンシー箱根リゾート&スパ) Kanagawa, 80 rooms, Luxury |
4.63 | 4.26 | 4.62 | 4.76 | – |
| 2 | Kyoto Royal Hotel & Spa (京都ロイヤルホテル&スパ) Kyoto, 443 rooms, Luxury |
4.57 | – | 3.39 | 4.2 | – |
| 3 | Lake Shikotsu Tsuruga Resort Spa Mizu no Uta (しこつ湖 鶴雅リゾートスパ 水の謌) Hokkaido, 53 rooms, Luxury |
4.55 | 4.74 | 4.37 | 4.61 | ¥144,900 |
| 4 | Hotel & Spa Andre Resort Izu Kogen (ホテル&スパ アンダリゾート伊豆高原) Shizuoka, 68 rooms, Luxury |
4.55 | 4.55 | 4.63 | 4.38 | ¥63,300 |
| 5 | Hikone Castle Resort & Spa (彦根キャッスル リゾート&スパ) Shiga, 52 rooms, Luxury |
4.54 | 4.55 | 4.41 | 4.66 | ¥68,200 |
| 6 | Mori no Sumika Resort & Spa (森の栖 リゾート&スパ) Ishikawa, 57 rooms, Luxury |
4.54 | 4.61 | 4.26 | 4.55 | ¥77,500 |
| 7 | Terrace Tateshina Resort & Spa (テラス蓼科 リゾート&スパ) Nagano, 60 rooms, Luxury |
4.49 | 4.7 | 4.34 | 4.61 | ¥53,300 |
Source: HotelBank Editorial Team research / MetroEngines Research
The first-ranked Hyatt Regency Hakone leverages its onsen-district setting in Hakone alongside an in-house spa. Multiple Hokkaido properties (Lake Shikotsu Tsuruga, Jozankei Tsuruga) appear in the upper ranks, suggesting that Hokkaido’s onsen culture combined with spa facilities is winning high reviews as a hybrid proposition. Mid-sized properties (50–80 rooms) dominate, and that scale likely enables the fine-grained service design behind these results.
Onsen Ryokan: Top 7 by Review Score
Leisure-purpose share is essentially 100%. The total-score average of 4.78 trails only pool-equipped city hotels, and the dual-pillar combination of Bath & Onsen (4.73) and Meals (4.50) overwhelms every other category. For travelers who plan a “cocooning” trip during tsuyu, this is the most strongly supported category.
| Rank | Property | Total | Bath & Onsen | Facilities | Cleanliness | June ADR |
|---|---|---|---|---|---|---|
| 1 | Tobira Onsen Myojinkan (扉温泉 明神館) Nagano, 44 rooms, Luxury |
5.00 | 4.62 | 4.36 | 4.4 | ¥215,300 |
| 2 | Tsuta Onsen Ryokan (蔦温泉旅館) Aomori, 34 rooms, High-Grade |
4.85 | 4.88 | 4.28 | 4.55 | ¥130,200 |
| 3 | Oga Onsen Yui no Yado Bettei Tsubaki (男鹿温泉 結いの宿 別邸 つばき) Akita, 40 rooms, High-Grade |
4.84 | 4.66 | 3.98 | 4.29 | ¥84,700 |
| 4 | Mt. Fuji Onsen Hotel Kaneyamaen (富士山温泉 ホテル鐘山苑) Yamanashi, 126 rooms, Luxury |
4.80 | 4.67 | 4.46 | 4.68 | ¥142,900 |
| 5 | Nagato Yumoto Onsen Otanisanso (長門湯本温泉 大谷山荘) Yamaguchi, 116 rooms, Luxury |
4.80 | 4.9 | 4.55 | 4.75 | ¥141,400 |
| 6 | Izu Imaihama Onsen Imaiso (伊豆今井浜温泉 今井荘) Shizuoka, 53 rooms, Luxury |
4.79 | 4.51 | 4.09 | 4.36 | ¥103,200 |
| 7 | Unazuki Onsen Enraku (宇奈月温泉 延楽) Toyama, 61 rooms, Luxury |
4.77 | 4.77 | 4.22 | 4.4 | ¥175,600 |
Source: HotelBank Editorial Team research / MetroEngines Research
Tobira Onsen Myojinkan in Nagano logs an extraordinary perfect 5.00 total score. It is also notable that long-established regional onsen properties — Otanisanso at Nagato Yumoto in Yamaguchi, Tsuta Onsen Ryokan in Aomori — outscore resorts in the Tokyo periphery. These properties offer exactly the kind of mood-driven value that rainy days amplify: “the green of mountains framed by the window,” “the sound of falling rain at the open-air bath.” Within the same June, Mother’s Day and Father’s Day gift-giving motives also reshape booking patterns at high-priced onsen ryokan, as analyzed in detail in Mother’s Day 5/10 & Father’s Day 6/21: Onsen Ryokan Booking Patterns Driven by Filial-Travel Demand.
Large-Bath Business Hotels: Top 7 by Review Score
A cohort of business hotels with attached large communal baths that primarily serve business-trip demand. The total-score average of 4.51 matches the other three categories — extraordinary at a ¥20,400 price point. Super Hotel and Dormy Inn franchises dominate, and the “value trio” of large bath, breakfast, and onsen drives strong repeat-visit intent.
| Rank | Property | Total | Bath & Onsen | Facilities | Cleanliness | June ADR |
|---|---|---|---|---|---|---|
| 1 | Super Hotel Inn Kurashiki (スーパーホテルInn倉敷) Okayama, 152 rooms, Budget |
4.78 | 4.4 | 3.77 | 4.08 | ¥15,300 |
| 2 | Super Hotel Ikebukuro West Natural Hot Spring (スーパーホテル池袋西口天然温泉) Tokyo, 201 rooms, Economy |
4.77 | 4.45 | 3.96 | 4.32 | ¥23,300 |
| 3 | Super Hotel Oyama (スーパーホテル小山) Tochigi, 87 rooms, Budget |
4.56 | 4.1 | 4.03 | 4.42 | ¥19,000 |
| 4 | Natural Hot Spring Sakaiminato Yunagi-no-Yu Onyado Nono (天然温泉 境港 夕凪の湯 御宿 野乃) Tottori, 194 rooms, High-Grade |
4.51 | 4.59 | 4.45 | 4.6 | ¥30,900 |
| 5 | Super Hotel Kumamoto Yamaga (スーパーホテル熊本・山鹿) Kumamoto, 101 rooms, Budget |
4.51 | 4.35 | 4.04 | 4.42 | ¥16,800 |
| 6 | Musashino Grand Hotel & Spa (むさしのグランドホテル&スパ) Saitama, 48 rooms, Upper |
4.43 | 4.55 | 4.09 | 4.49 | ¥28,500 |
| 7 | Super Hotel Hakodate (スーパーホテル函館) Hokkaido, 108 rooms, Budget |
4.41 | 3.67 | 3.98 | 4.35 | ¥13,000 |
Source: HotelBank Editorial Team research / MetroEngines Research
Super Hotel Inn Kurashiki’s 4.78 total stands shoulder-to-shoulder with the leading onsen ryokan. The fact that large-bath business hotels are the rare category whose sellout rate edges up during tsuyu reflects both the stability of business-trip demand and a structure in which these strong satisfaction scores generate repeat visits. For more on the broader rise in business-hotel pricing and prefecture-level cost-performance comparisons, see The Reality of Business Hotel Price Inflation — Nationwide ADR Analysis and the Top 10 Most Cost-Effective Prefectures for Business Trips.
Analysis Item 3: Total-Score Distribution of the 50 Properties
Looking at the total-score distribution for the 48 selected properties (50 originally chosen, 48 after de-duplication), the 4.4–4.6 band concentrates the most properties (18). Next come 15 in the 4.8–5.0 band and 13 in the 4.6–4.8 band — distribution is heavy in the upper bands. Properties that meet selection criteria (100+ reviews, room scale, etc.) for indoor-facility-rich positioning already cluster in a “few duds” range, meaning the rational consumer approach is to choose a category first and then narrow down within it.
Source: HotelBank Editorial Team research (N=48 properties)
Analysis Item 2: The Reality of the Tsuyu-Period Premium
The ADRs of the 48 indoor-facility-rich properties covered here all materially exceed their respective national category averages. The pool-equipped city hotel category runs roughly 2.6× the national deluxe-hotel average (¥72,100); the onsen ryokan category reaches 3.7× the national ryokan average (¥32,600). The depth of indoor-experience content is clearly translating into a price premium.
Source: MetroEngines Research, compiled by HotelBank Editorial Team (as of June 2026)
That said, this premium reflects a mix of factors — location, grade, room count — and should be distinguished from a pure “tsuyu-period premium.” More striking is that these top properties maintain ADR at or above late-May levels through tsuyu, even as their sellout rates clearly fall. The ability to hold price during a soft-demand window suggests review scores function as “pre-booking proof” that allays consumer concern and dampens price elasticity.
Reviews of Properties Offering “Rainy-Day Plans”
Among the 48 analyzed properties, those that explicitly market “rainy-day plans,” “tsuyu plans,” or “rainy-day discounts” as part of their hotel name or operating policy are limited. Tabulating sales plans on OTAs containing the keywords “rainy-day plan” or “tsuyu” shows that fewer than 10% of the leading properties offer them.
This suggests most of these properties pursue a “don’t change the value just because it’s tsuyu” strategy rather than a “discount because of tsuyu” strategy. In fact, the average review score of properties that do not offer rainy-day plans is 4.66 — identical to the overall sample average of 4.66. Without any price-led tsuyu plan, the depth of indoor facilities itself absorbs tsuyu-period demand.
By contrast, the business-hotel category does selectively promote “weekday consecutive-night discounts” or “long-stay” plans, which support business-trip demand through tsuyu. Unlike leisure categories, the business category retains some headroom for price-led promotional activity.
Consumer Takeaways: Three Lenses for Picking a Place to Stay in June
Lens 1: For a “cocooning” trip, onsen ryokan is the optimal answer. The dual-pillar pairing of Bath & Onsen (4.73) and Meals (4.50) is hard to replicate elsewhere; the combination of the sound of rain at the open-air bath and a dinner-inclusive plan is essentially the icon experience of tsuyu travel. Long-established regional properties outscore Tokyo-periphery resorts, so the trip plan needs to factor in travel time.
Lens 2: For “urban leisure,” choose pool-equipped city hotels. Tokyo, Osaka, and Kyoto central-city luxury properties consistently hold totals around 4.8, and the indoor pool, spa, and on-site dining make a fully self-contained stay possible. ADR generally runs ¥150,000+, but tends to drop in June versus late May.
Lens 3: For “business trip + onsen,” choose Super Hotel or Dormy Inn franchises. Astonishing cost-performance — totals of 4.4–4.8 at ¥15,000–¥30,000 price points. Equipped with large communal baths, natural hot springs, and free breakfast; this is the rare stable-demand category whose sellout rate doesn’t fall during tsuyu (it actually edges up). The “refresh in the onsen on the side of business travel” scenario is now firmly established.
Conclusion: Indoor Facilities Underwrite Tsuyu-Season Demand
The traditional “demand trough” of June’s tsuyu is not necessarily a slow season for indoor-facility-rich properties, as this analysis confirms. Aggregating over 320,000 reviews, the four categories’ 48 properties post a total-score average of 4.66 — well above the national average (around 3.7) — and each category absorbs tsuyu demand through a distinct value proposition.
From the consumer’s perspective, the rational approach is to first decide which type of “fun-even-in-the-rain” experience you want — onsen and cuisine, urban luxury, resort spa, or value-focused — and then narrow by location and price within that category. Each category’s review score functions as a “value certificate” that lets the property hold price even against the headwind of tsuyu demand.
About the data in this article: Review scores are calculated from guest review data (approx. 327,000 reviews aggregated by the HotelBank Editorial Team) and are not numbers biased toward any specific OTA platform. Prices are June asking prices that were published on OTAs as of late April 2026; they shift as the check-in date approaches. Note that last-minute discounts are possible and that there is also a weekday/weekend and long-weekend differential.
Related Reading
- Hokkaido Defies Tsuyu: 6-City June ADR Comparison 2026
- Hydrangea Hotspot Hotel ADR — The Hidden Premium Window of Tsuyu
- The Gate Hotel Shinsaibashi & Setre Sasashima: 2026 June Opening Rush, Area Competition, and Tsuyu Pricing
- Mother’s Day 5/10 & Father’s Day 6/21: Onsen Ryokan Booking Patterns Driven by Filial-Travel Demand
- Hotel Dining for Anniversaries: Review Ranking of Luxury Hotel Cuisine in Tokyo, Osaka, and Nagoya
- The Reality of Business Hotel Price Inflation — Nationwide ADR Analysis and the Top 10 Most Cost-Effective Prefectures for Business Trips
- Japan Tourism Agency “Overnight Travel Statistics Survey” (external site)