

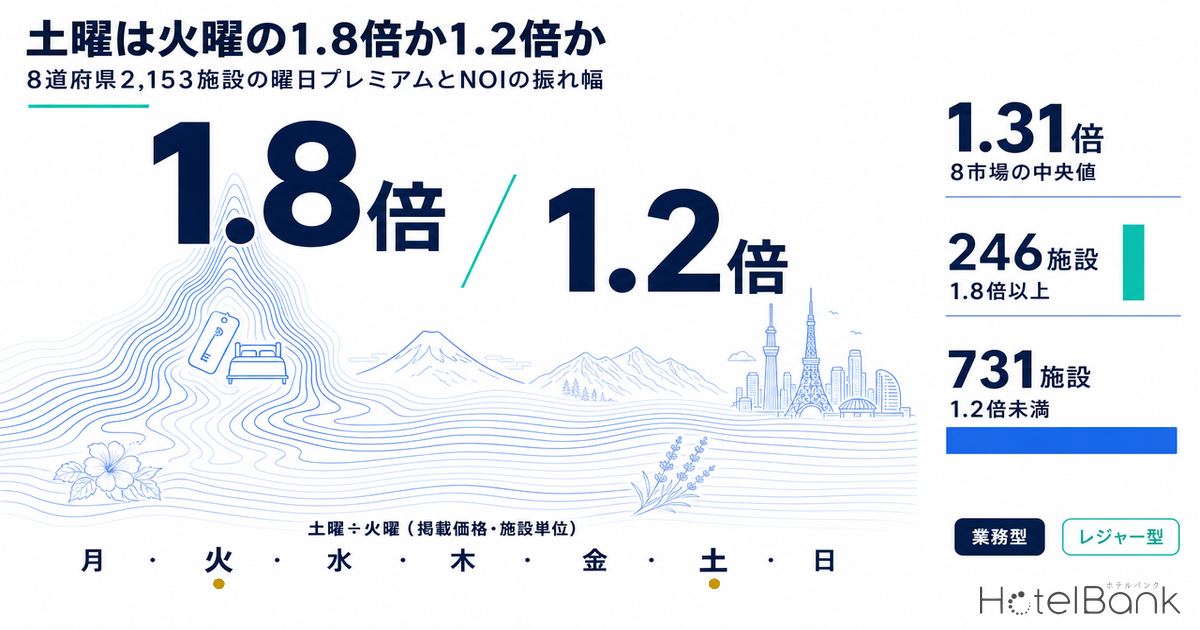
A hotel’s revenue takes its shape not only from which season it earns in, but also from which day of the week it earns on. Using MetroEngines Research data, we measured the ratio of Saturday to Tuesday listed prices (per property) for June–July 2026 across 2,153 hotels with 60 or more rooms in eight prefectures: Hokkaido, Tokyo, Osaka, Aichi, Fukuoka, Shizuoka, Nagano and Okinawa. Market medians range from 1.18x in Okinawa to 1.49x in Fukuoka. Within each market, however, hotels selling Saturdays at 1.8x or more sit alongside hotels at under 1.2x: across all eight markets, 246 properties were at 1.8x or above and 731 were below 1.2x. Using a 100-room model, this article estimates how far these differences in day-of-week premium move the composition of annual revenue, the weekday rate required, and the swing in NOI.
This article works on a different axis from our “Snow as Cost or Asset: Winter RevPAR 53% vs Winter ADR 2.66x”, which dealt with seasonal (monthly) variation. Here we look at variation by day within the week, aggregating daily listed prices property by property. Rather than a specific holiday period such as Silver Week 2026 or Obon 2026 inventory absorption across 36 regional cities, it examines the structure of ordinary weeks with holidays excluded. The operator’s view — each property’s headroom in pricing — is covered in our comparison of weekend premium distributions across four markets; this article translates that view into the language of acquisition prices, lending and development plans.
Key Takeaways
- The median Saturday ÷ Tuesday ratio (listed prices, per property) across 2,153 hotels in 8 prefectures is 1.31x. By market it ranges from 1.18x in Okinawa to 1.49x in Fukuoka, with the four business-oriented markets above the four leisure-oriented ones.
- The gap within markets is larger than the gap between them. In Fukuoka the bottom quartile is 1.13x and the top quartile 1.82x; in Hokkaido, 1.06x to 1.68x.
- Estimated occupancy differs by only about 4–10pt between Saturday and Tuesday, so most of the day-of-week premium comes from rate.
- Even in weekend-heavy markets, 64–68% of room revenue is earned on Sunday–Thursday nights (estimate).
- In a 100-room model at 80% year-round occupancy, a weekday rate increase of ¥500 (¥10.44 million a year) beats a Saturday increase of ¥2,000 (¥8.32 million a year). Room to lift weekday occupancy toward Saturday levels is largest in Shizuoka, Nagano and Osaka.
Metric Definitions Used in This Article
- Listed price: The selling price each property publishes on OTAs and similar channels — the per-room rate for two guests in one room (tax included), averaged across all plans listed that day. On sold-out days, the last listed price is used. All day-of-week analysis in this article (the Saturday ÷ Tuesday ratio and the day-of-week indices) is a relative comparison based on listed prices, not on transacted prices themselves.
- ADR (Average Daily Rate): An estimated transacted rate (tax-excluded equivalent), calculated by applying a category-specific adjustment factor to the lowest-plan rate each property publishes on OTAs (per room, two guests, tax included). Against property-level results disclosed by listed hotel REITs (91 properties, most recent three months), the median error is about 7%. It is an estimate and differs from each property’s actual transacted prices and accounting figures. Area-level ADR is the median of the properties covered (the level of a typical property in the area).
- OCC (Occupancy Rate): Rooms sold as a share of total rooms in the area (an estimate based on OTA sales inventory; consistency checks against REIT monthly disclosures confirm accuracy within roughly a few points). Because it is based on the absorption of inventory sold on OTAs, it differs from each property’s actual overall occupancy. In this article it is used only for prefecture-level aggregates.
- Saturday ÷ Tuesday ratio: For each property, the median listed price on Saturday check-in dates divided by the median on Tuesday check-in dates.
- Data source: MetroEngines Research
How We Measured — Divide per Property, Then Look at the Market Distribution
The population is every operating property we track with 60 or more rooms in the eight prefectures (2,733 properties in total). The aggregation period is the 56 days from June 1 to July 26, 2026, from which we excluded the nights of the three-day weekend including Marine Day (July 18–20), because on those nights prices are driven by the holiday rather than the day of the week. The remaining 53 days contain seven Saturdays and eight Tuesdays. Tokyo, Osaka, Aichi and Fukuoka are treated as business-oriented markets, and Hokkaido, Shizuoka, Nagano and Okinawa as leisure-oriented markets.
The calculation has three steps. First, for each property we take the median listed price on Saturday check-in dates and the median on Tuesday check-in dates. Next, we compute “Saturday ÷ Tuesday” at the property level; properties with fewer than five observations on either Saturday or Tuesday are excluded. Finally, we line up the property-level ratios for each market and report the median, the bottom quartile (p25) and the top quartile (p75). We use the property-level median rather than an average so that market values are not pulled by large properties or high-priced ones.
Method (for re-aggregation)
(1) Population: operating properties with 60+ rooms in the 8 prefectures (2,733 in total). (2) Price: each property’s daily listed price (two guests per room, tax included, average of all plans; last listed price on sold-out days). (3) Period: 53 days — June 1 to July 26, 2026, excluding July 18–20. (4) For each property, median Saturday price ÷ median Tuesday price (at least five observations each required). (5) For each market, the median, p25 and p75 of the property-level ratios. For reference, we also show the same calculation using lowest-plan prices, and “Saturday average ÷ Tuesday average” computed directly from all observation rows.
Table 1 shows the number of properties from population to aggregation sample, together with results under the three methods. Recalculating on a lowest-plan basis leaves the market order almost unchanged: Fukuoka, Tokyo and Osaka at the top; Okinawa, Nagano and Hokkaido at the bottom. In the simple ratio of observation-row averages, price movements at high-priced properties shift the average substantially, so Aichi (1.42x), Hokkaido (1.29x) and Nagano (1.26x) come out higher than their property-level medians, while Tokyo (1.33x) comes out lower. This article uses the property-level median as its main indicator.
| Market | Population | Price observed | Sample | Rooms | Median | p25 | p75 | Lowest-plan basis | Simple avg. of rows |
|---|---|---|---|---|---|---|---|---|---|
| Fukuoka | 254 | 212 | 211 | 36,409 | 1.49 | 1.13 | 1.82 | 1.57 | 1.53 |
| Tokyo | 787 | 612 | 604 | 117,590 | 1.43 | 1.23 | 1.65 | 1.55 | 1.33 |
| Osaka | 418 | 305 | 302 | 62,953 | 1.35 | 1.23 | 1.56 | 1.43 | 1.35 |
| Aichi | 259 | 205 | 203 | 34,658 | 1.31 | 1.11 | 1.61 | 1.30 | 1.42 |
| Shizuoka | 251 | 228 | 223 | 27,256 | 1.27 | 1.14 | 1.46 | 1.31 | 1.32 |
| Hokkaido | 391 | 323 | 318 | 54,690 | 1.22 | 1.06 | 1.68 | 1.25 | 1.29 |
| Nagano | 185 | 147 | 137 | 15,326 | 1.19 | 1.06 | 1.31 | 1.16 | 1.26 |
| Okinawa | 188 | 159 | 155 | 27,654 | 1.18 | 1.09 | 1.29 | 1.20 | 1.17 |
| 8 markets total | 2,733 | 2,191 | 2,153 | 376,536 | 1.31 | 1.14 | 1.58 | — | — |
Market Medians Run 1.18–1.49x, but the Big Gaps Are Within Markets
Figure 1 plots, for each market, the median property-level Saturday ÷ Tuesday ratio (dot) and the range from the bottom to the top quartile (bar). Market medians span just 0.31 points (1.18–1.49x). By contrast, the range within Fukuoka is 0.69 points (1.13–1.82x) and within Hokkaido 0.62 points (1.06–1.68x) — pricing approaches diverge widely inside the same market.
Hokkaido’s distribution in particular splits in two. Properties below 1.2x make up 48.7%, while 32.7% are at 1.5x or above. By property type, Hokkaido’s city hotels (N=55) have a median of 1.44x, business hotels (N=173) 1.28x, resort hotels (N=48) 1.13x and ryokan (N=35) 1.12x. Resorts and ryokan, whose rates rise from weekdays onward during the summer tourist season, sit in the same prefecture as urban hotels that concentrate rate on weekends. Using a single “Hokkaido day-of-week premium” in an acquisition review can easily misstate assumptions depending on which type the property is. That Hokkaido business hotels are thicker on Tuesday–Thursday than on weekends is also confirmed in our article on estimated day-of-week OCC by property type.
The map shows the location of the eight markets with each market’s median and sample size (circle size = number of sampled properties; shading = median).
Business Markets Lean Toward Saturday; Resorts and Ryokan Stay Nearly Flat Through the Week
Comparing like-for-like property types brings out the character of each market more clearly. Across all eight markets, medians by type were 1.36x for business hotels (N=1,452), 1.31x for city hotels (N=273), 1.18x for resort hotels (N=186) and 1.18x for ryokan (N=101). Looking at business hotels alone, the median is 1.43x in the four business-oriented markets (N=1,000) and 1.25x in the four leisure-oriented ones (N=452): even within the same type, the Saturday uplift differs with the local demand mix.
| Market | Business hotel | City hotel | Resort hotel | Ryokan | Tuesday listed price (property median) | Saturday listed price (property median) |
|---|---|---|---|---|---|---|
| Fukuoka | 1.50 (175) | 1.46 (23) | — | — | ¥14,951 | ¥24,253 |
| Tokyo | 1.47 (453) | 1.28 (72) | — | — | ¥17,969 | ¥26,392 |
| Osaka | 1.37 (209) | 1.33 (59) | — | — | ¥12,966 | ¥18,053 |
| Aichi | 1.32 (163) | 1.32 (22) | — | — | ¥12,364 | ¥17,352 |
| Shizuoka | 1.29 (133) | 1.25 (26) | 1.27 (31) | 1.25 (30) | ¥13,860 | ¥18,204 |
| Hokkaido | 1.28 (173) | 1.44 (55) | 1.13 (48) | 1.12 (35) | ¥22,134 | ¥32,324 |
| Nagano | 1.15 (74) | — | 1.27 (27) | 1.16 (24) | ¥16,954 | ¥22,498 |
| Okinawa | 1.22 (72) | — | 1.12 (71) | — | ¥23,199 | ¥29,169 |
The weekly shape also varies by market. Figure 2 shows day-of-week indices, with each property’s Tuesday median set to 1.00, as market medians. Fukuoka steps up from Friday (Friday 1.16, Saturday 1.49), and Tokyo also climbs toward the end of the week (Thursday 1.08, Friday 1.10, Saturday 1.43). Shizuoka is almost flat from Monday to Friday (0.99–1.02) with only Saturday rising to 1.27 — a “Saturday-only” profile. In Okinawa the weekend uplift is spread over Friday to Sunday (Friday 1.14, Saturday 1.18, Sunday 1.03). In some weeks Friday can even exceed Saturday — as in Chiba, where October 2 (Fri) came in above October 3 (Sat).
Saturday–Tuesday Occupancy Gap Is 4–10pt; Rate Drives the Premium
Is the Saturday uplift, then, matched by a difference in demand? From here we switch to prefecture-level estimated occupancy. Averaging estimated occupancy by day over the same period (excluding July 18–20), the Saturday–Tuesday gap is small in Tokyo (4.6pt), Okinawa (5.7pt), Fukuoka (4.7pt) and Aichi (4.0pt), and somewhat larger in Osaka (10.4pt), Shizuoka (9.8pt) and Nagano (8.2pt). Against a Saturday ÷ Tuesday rate ratio of 1.18–1.49x, the occupancy ratio is only 1.05–1.13x: most of the day-of-week premium comes from the rate side.
| Market | Tue est. OCC | Sat est. OCC | Sun–Thu avg. | Gap to Sat | Sat ÷ Tue (rate) | Properties / rooms |
|---|---|---|---|---|---|---|
| Osaka | 77.2% | 87.6% | 76.9% | 10.7pt | 1.35 | 414 / 59,634 |
| Shizuoka | 77.4% | 87.2% | 76.9% | 10.3pt | 1.27 | 701 / 29,935 |
| Nagano | 81.6% | 89.8% | 81.0% | 8.8pt | 1.19 | 502 / 18,485 |
| Hokkaido | 86.5% | 92.2% | 86.3% | 5.9pt | 1.22 | 665 / 52,729 |
| Aichi | 80.3% | 84.3% | 78.5% | 5.8pt | 1.31 | 328 / 33,925 |
| Fukuoka | 87.4% | 92.1% | 86.3% | 5.8pt | 1.49 | 381 / 28,992 |
| Tokyo | 90.0% | 94.6% | 89.6% | 4.9pt | 1.43 | 804 / 104,099 |
| Okinawa | 84.9% | 90.6% | 85.7% | 4.9pt | 1.18 | 710 / 35,632 |
Figure 3 is a positioning chart with the Saturday ÷ Tuesday rate ratio on the horizontal axis and the occupancy gap between Saturday and the Sunday–Thursday average on the vertical axis. Fukuoka and Tokyo sit at the lower right (high rate ratio, small occupancy gap): markets that add rate on Saturday while keeping weekday occupancy high. Shizuoka and Nagano sit at the upper left (modest rate ratio, large occupancy gap): demand bunches on Saturday, and weekday occupancy still has room to grow. Osaka is above the midpoint on both the rate ratio and the occupancy gap, a position where both levers tend to work.
Even in Weekend-Heavy Markets, Sunday–Thursday Earns Over 60% of Room Revenue
Multiplying the day-of-week rate index by estimated occupancy and applying the result to the day composition of a year (52 Saturday nights, 52 Friday nights, 261 Sunday–Thursday nights) gives an estimate of which days carry room revenue. Saturday nights account for between 16.6% (Okinawa) and 20.4% (Fukuoka) of annual room revenue; Friday and Saturday together account for 32.0%–35.8%. Put the other way, even in Fukuoka, where the day-of-week premium is largest, 64% of room revenue is earned on Sunday–Thursday nights.
To convert this into levels usable in investment planning, Table 4 applies the weekly shape above to each market’s estimated transacted ADR for June–July 2026 (tax-excluded equivalent; ADR as defined at the top) and backs out “Tuesday-equivalent” and “Saturday-equivalent” rates. Tokyo, for example, has an estimated transacted ADR of about ¥12,400, which implies a Tuesday-equivalent of about ¥11,500 and a Saturday-equivalent of about ¥16,400. Fukuoka, at an ADR of about ¥10,600, has a Tuesday-equivalent of about ¥9,700 and a Saturday-equivalent of about ¥14,400 — the widest gap between ADR and weekday rate among the eight markets. When a development plan sets its required ADR, it is this weekday rate level that applies to the 261 Sunday–Thursday nights.
| Market | Est. transacted ADR (Jun–Jul) | YoY | Tuesday-equivalent (est.) | Saturday-equivalent (est.) | Saturday revenue share | Fri+Sat revenue share |
|---|---|---|---|---|---|---|
| Tokyo | ¥12,394 | -4.4% | ¥11,476 | ¥16,422 | 19.7% | 34.4% |
| Okinawa | ¥12,548 | +10.9% | ¥11,852 | ¥14,033 | 16.6% | 32.4% |
| Shizuoka | ¥11,768 | -3.6% | ¥11,270 | ¥14,291 | 19.1% | 33.5% |
| Hokkaido | ¥11,245 | +0.8% | ¥10,714 | ¥13,028 | 17.4% | 32.0% |
| Fukuoka | ¥10,598 | +0.2% | ¥9,672 | ¥14,421 | 20.4% | 35.8% |
| Nagano | ¥10,510 | -1.6% | ¥10,153 | ¥12,112 | 17.8% | 32.3% |
| Osaka | ¥8,416 | -31.5% | ¥7,893 | ¥10,680 | 20.0% | 34.5% |
| Aichi | ¥8,024 | -2.5% | ¥7,659 | ¥10,057 | 18.9% | 33.4% |
1.2x vs 1.8x: The Weekday Rate Needed for the Same ADR Differs by About ¥1,000
Next, we assume three markets that differ only in the size of their day-of-week premium and back out the weekday rate needed to achieve the same annual ADR. Assumptions: 100 rooms; occupancy constant at 80% year-round on every day; annual ADR (at the level of estimated transacted ADR) of ¥12,000; Friday carries 20% of Saturday’s uplift (close to the eight-market median shape); Sunday–Thursday at a single rate. The Saturday ÷ Tuesday ratio takes three values: 1.2x (close to the Okinawa and Nagano medians), 1.5x (close to the Fukuoka median) and 1.8x (close to Fukuoka’s top quartile).
| Sat ÷ weekday ratio | Required weekday rate | Friday rate | Saturday rate | Sun–Thu revenue share | Fri+Sat revenue share | Saturday revenue share |
|---|---|---|---|---|---|---|
| 1.2x | ¥11,603 | ¥12,067 | ¥13,924 | 69.1% | 30.9% | 16.5% |
| 1.5x | ¥11,055 | ¥12,161 | ¥16,583 | 65.9% | 34.1% | 19.7% |
| 1.8x | ¥10,556 | ¥12,245 | ¥19,001 | 62.9% | 37.1% | 22.6% |
In the 1.8x market, a weekday rate of about ¥10,600 still reaches an annual ADR of ¥12,000, whereas the 1.2x market needs about ¥11,600 — a difference of about ¥1,000 (about 9%). When a development plan assumes “ADR in this area is ¥12,000,” the weekday pricing required in day-to-day operations depends on whether that ADR is propped up by high Saturday rates or earned evenly from weekdays. In acquisition due diligence, checking the day-of-week rate ratio in addition to monthly ADR makes the assumptions more concrete.
Weekday +¥500 or Saturday +¥2,000: Which Lever Works?
Using the same 100-room, 80% year-round occupancy model, we compare the increase in annual room revenue from moving rates (a simple calculation that ignores price elasticity of demand). Raising the weekday (261 Sunday–Thursday nights) rate by ¥500 yields ¥10.44 million a year; raising the Saturday (52 nights) rate by ¥2,000 yields ¥8.32 million a year — the weekday side wins. To match the weekday +¥500 gain through Saturday alone, the Saturday rate would need to rise by about ¥2,500.
In percentage terms, the implications diverge further. In the 1.2x market, a ¥2,000 Saturday increase raises the Saturday rate by 14.4% and lifts the Saturday ÷ weekday ratio to 1.37x — above the top quartile in Okinawa and Nagano (1.29–1.31x). In the 1.8x market, the same ¥2,000 is a 10.5% increase and takes the ratio to 1.99x. A weekday +¥500 is only a 4.3% increase in the 1.2x market and 4.7% in the 1.8x market. In either market, stacking small increases on the weekdays — which make up most nights of the year — makes it easier to grow revenue without drifting from the market norm.
Bigger than either rate lever is building weekday occupancy. In the same model, lifting Sunday–Thursday occupancy by 5pt adds ¥15.14 million a year in the 1.2x market and ¥13.78 million in the 1.8x market — more than both rate levers in each case. Markets that concentrate rate on weekends have lower weekday rate levels, so the value per point is somewhat smaller, but the scale of an effect that applies to 261 nights a year is unchanged.
NOI Swing — Weekday Rates, Not Saturday, Hold the Key
How do differences in the day-of-week premium affect NOI sensitivity? Table 6 estimates, for the three markets in Table 5, the change in room revenue, NOI and DSCR when the rate on Saturday, on Friday–Saturday, or on Sunday–Thursday moves by 10%. Assumptions: NOI is 32% of room revenue; rate changes flow straight through to revenue and NOI (costs unchanged); base DSCR is 1.40x. These are assumptions for the purpose of estimation, not actual results for any specific type or property.
| Days on which rate falls 10% | 1.2x market | 1.5x market | 1.8x market |
|---|---|---|---|
| Saturday only (52 nights) | Revenue -1.7% / NOI -5.2% / DSCR 1.33 | Revenue -2.0% / NOI -6.2% / DSCR 1.31 | Revenue -2.3% / NOI -7.0% / DSCR 1.30 |
| Friday–Saturday (104 nights) | Revenue -3.1% / NOI -9.6% / DSCR 1.26 | Revenue -3.4% / NOI -10.7% / DSCR 1.25 | Revenue -3.7% / NOI -11.6% / DSCR 1.24 |
| Sunday–Thursday (261 nights) | Revenue -6.9% / NOI -21.6% / DSCR 1.10 | Revenue -6.6% / NOI -20.6% / DSCR 1.11 | Revenue -6.3% / NOI -19.7% / DSCR 1.12 |
When Friday–Saturday rates move 10%, NOI changes by 9.6% in the 1.2x market and 11.6% in the 1.8x market — a gap of only 2 points. Weekend-heavy markets are indeed more sensitive to weekend price moves, but not by as much as one might expect. By contrast, a 10% move in Sunday–Thursday rates moves NOI by about 20% in every market, shifting DSCR from 1.40x to 1.10–1.12x. In other words, it is the weekday rate level, more than the Saturday uplift, that holds the key to NOI swing.
When regional banks and lenders build stress tests, running a “what if weekday rates fall” case alongside the usual “what if weekend rates fall” case lets them view sensitivity on the same yardstick for deals in any market. Conversely, measures that lift weekday rates and occupancy are the most powerful way to push up NOI and DSCR in every market. The procedure for backing out required rates from interest-rate levels is set out in our estimate of break-even ADR across eight major markets.
Capturing Weekday Demand Raises the Occupancy Ceiling
Finally, we return to each market’s actual weekly shape and put a value on weekday headroom. Table 7 estimates how much annual room revenue a 100-room hotel would add if Sunday–Thursday estimated occupancy rose by half its gap to Saturday, priced at the Tuesday-equivalent rates in Table 4. Shizuoka adds about ¥15.2 million, Nagano about ¥11.7 million and Osaka about ¥11.0 million: weekday headroom is large in the Saturday-heavy leisure markets and in Osaka. Tokyo, Fukuoka and Okinawa already have high weekday occupancy, so the weekday upside is relatively small at about ¥7.3–7.5 million.
| Market | Sun–Thu est. OCC | Sat est. OCC | Half the gap added to weekdays | Tuesday-equivalent rate | Annual revenue gain, 100 rooms (est.) |
|---|---|---|---|---|---|
| Shizuoka | 76.9% | 87.2% | +5.2pt | ¥11,270 | approx. ¥15.15M |
| Nagano | 81.0% | 89.8% | +4.4pt | ¥10,153 | approx. ¥11.69M |
| Osaka | 76.9% | 87.6% | +5.4pt | ¥7,893 | approx. ¥10.97M |
| Hokkaido | 86.3% | 92.2% | +3.0pt | ¥10,714 | approx. ¥8.26M |
| Okinawa | 85.7% | 90.6% | +2.4pt | ¥11,852 | approx. ¥7.53M |
| Tokyo | 89.6% | 94.6% | +2.5pt | ¥11,476 | approx. ¥7.38M |
| Fukuoka | 86.3% | 92.1% | +2.9pt | ¥9,672 | approx. ¥7.29M |
| Aichi | 78.5% | 84.3% | +2.9pt | ¥7,659 | approx. ¥5.84M |
How to build weekday occupancy depends on the character of the market. In leisure markets such as Shizuoka and Nagano, group and long-stay demand that is indifferent to the day of the week — corporate training, sports and cultural training camps, and multi-night plans including workations — can fill weekdays. In business markets such as Osaka and Aichi, Sunday-night pre-arrival stays and multi-night corporate contracts can lift Sundays and Mondays, which tend to be troughs. In Tokyo and Fukuoka, where weekday occupancy is already high, the headroom lies less in adding occupancy than in the level of the weekday rate itself.
For investors considering an acquisition or development, this difference also bears on how the business plan is written. The more a market concentrates rate on weekends, the more the occupancy ceiling is set by how much weekday demand can be captured — and that is where an operator’s capability tends to show. For asset managers, smoothing weekday occupancy can be framed as a revenue opportunity on a par with, or greater than, raising rates.
Frequently Asked Questions
Q. Are markets with a large day-of-week premium more attractive for investment?
A. In our estimates, the size of the premium changes the composition of annual revenue by only a few points, and the difference in NOI sensitivity to Friday–Saturday rate moves was about 2 points. The question is not which market is better, but whether the same ADR is earned on weekdays or weekends; understanding that and stating the weekday rate assumption explicitly makes a business plan more accurate.
Q. Can the listed-price ratio be applied directly to transacted ADR?
A. The day-of-week analysis here is a relative comparison of listed prices; it does not directly measure day-of-week differences in transacted rates. Tables 4 and 5 treat it as an estimate applying the listed-price weekly shape to the level of estimated transacted ADR. For individual deals, it is preferable to substitute the property’s actual operating data by day of week.
Q. How do things change if holidays and seasons are included?
A. This article looks at the structure of ordinary weeks, excluding the Marine Day three-day weekend. On holiday nights the calendar, not the day of the week, moves rates, so an annual plan needs to layer holiday uplifts and seasonal waves on top of the day-of-week composition shown here. For seasonal waves, see our article comparing winter and summer RevPAR.
Summary
Across 2,153 hotels in eight prefectures, the median Saturday ÷ Tuesday ratio is 1.31x, ranging from 1.18x to 1.49x by market; business markets lean rate toward Saturday, while resorts and ryokan stay close to flat through the week. Yet the differences within markets exceed those between them: 246 properties sell at 1.8x or more and 731 at under 1.2x. Day-of-week occupancy differences are around 4–10pt, so most of the premium is generated by rate.
Translated to the investment side, even in weekend-heavy markets more than 60% of room revenue is earned Sunday–Thursday, and it is the weekday rate level, more than the Saturday uplift, that holds the key to NOI swing. In the 100-room model, weekday +¥500 beats Saturday +¥2,000, and building weekday occupancy has an even larger effect. When structuring acquisition prices and DSCR, stating the day-of-week rate ratio and the weekday rate assumption explicitly, and building the capture of weekday demand into the business plan as an opportunity to raise the occupancy ceiling, leads to plans that fit the character of each market.
Related Articles
- Weekend Premium 2026: Tokyo Business 24% vs Hakone Ryokan 10%, N=659
- Snow as Cost or Asset: Winter RevPAR 53% vs Winter ADR 2.66x
- Hokkaido Business Hotels Aren’t Weekend-Led: Thu 95.4% Ties Sat 95.4%
- Obon 2026: Thin Room Stock Peaks Higher, Empties Faster – 36 Cities
- Kyoto Day-of-Week OCC: Thursday 90.4% Edges Friday, May–Jul 2026
- Kumamoto Day-of-Week Occupancy Inverts by Type: Thu 88.3% vs Sat 89.9%
- Policy Rate 1.00%: Break-Even ADR Across Japan’s 8 Hotel Markets
References and Sources
■ Data Sources
Day-of-week listed prices are the daily listed prices (two guests per room, tax included, average of all plans listed that day; last listed price on sold-out days) of operating properties we track with 60 or more rooms in eight prefectures — Hokkaido, Tokyo, Osaka, Aichi, Fukuoka, Shizuoka, Nagano and Okinawa (population of 2,733 properties). The period is 53 days: the 56 days from June 1 to July 26, 2026, excluding the nights of the Marine Day three-day weekend (July 18–20). The 2,153 properties with at least five observations each on Saturday and Tuesday form the sample. Estimated transacted ADR is the simple average of June and July 2026 monthly values in the same eight prefectures (tax-excluded equivalent, all property types, N=473–1,136 properties), with YoY compared against June–July 2025. Estimated occupancy is based on OTA sales inventory (all types and sizes, 328–804 properties). All data: MetroEngines Research.
■ Estimation Assumptions
The day-of-week premium is each property’s median listed price on Saturday check-in dates divided by its median on Tuesday check-in dates, summarized per market by the median, p25 and p75 of that ratio (property-level medians, not averages). The model estimates in Tables 5 and 6 and Figure 5 assume 100 rooms, 80% year-round occupancy (constant on all days), annual ADR of ¥12,000 (at the level of estimated transacted ADR), annual nights of 52 Saturdays / 52 Fridays / 261 Sunday–Thursday, and Friday carrying 20% of Saturday’s uplift. The sensitivity estimates assume NOI at 32% of room revenue, base DSCR of 1.40x, and rate changes fully reflected in NOI with costs constant. The Tuesday- and Saturday-equivalents in Table 4 are estimates applying the listed-price day-of-week index and estimated occupancy shape to the level of estimated transacted ADR.
■ Limitations
All day-of-week analysis in this article is a relative comparison based on listed prices and does not directly measure transacted rates by day. Estimated transacted ADR and estimated occupancy are both estimates and differ from each property’s actual transacted prices, accounting figures and overall occupancy. Because the population for the rate ratio (60+ rooms) and that for estimated occupancy (all types and sizes) do not match, revenue compositions and revenue gains obtained by combining them are estimates only. The model estimates do not account for price elasticity of demand, cost changes, public holidays, holiday periods or seasonal waves, and are not actual results for any specific type or property. The data cover 53 days in June–July 2026 and do not represent the year-round day-of-week structure. For decisions on individual deals, please substitute actual operating data by day of week.
■ Market Data
- MetroEngines Research — daily listed prices (8 prefectures, 60+ rooms, N=2,153 hotels, June 1 – July 26, 2026), estimated transacted ADR (June–July 2025 and June–July 2026), estimated occupancy (based on OTA sales inventory, June–July 2026)
■ Government Statistics and Public Data