

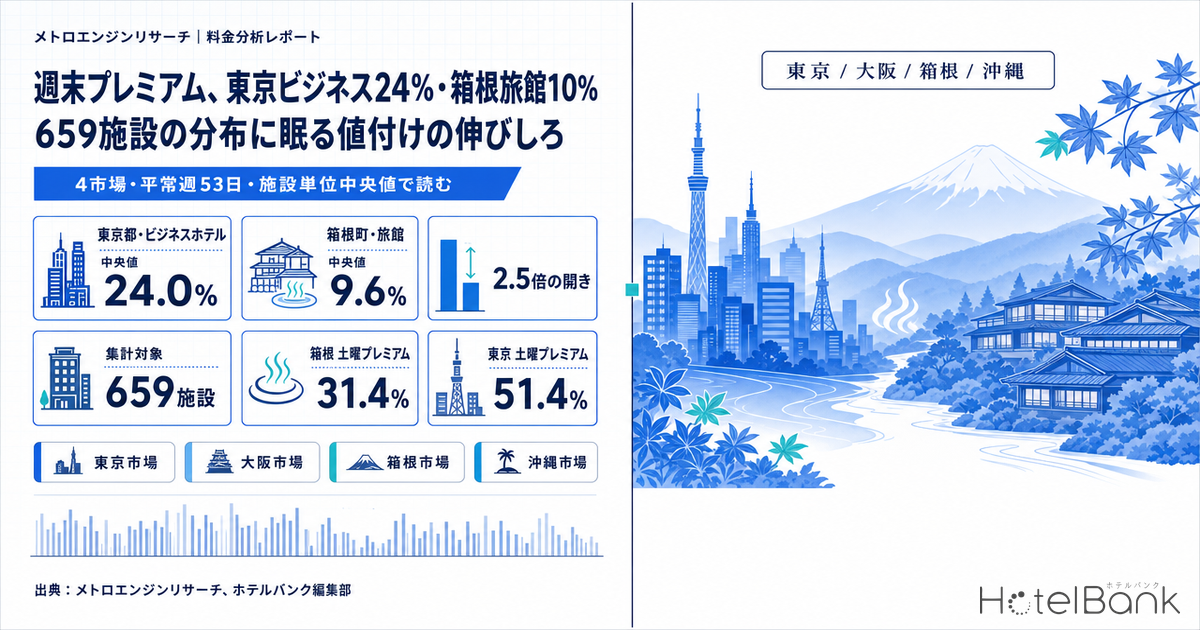
Room rates move with the day of the week. But how much a property moves them varies enormously from one hotel to the next, even within the same market. Using MetroEngines Research data, we calculated a property-level “weekend premium rate” for four markets: business hotels in Tokyo, city hotels in Osaka, ryokan in Hakone (Kanagawa), and resort hotels in Okinawa. The sample covers 659 properties that met the observation criteria. The median is 24.0% for Tokyo business hotels versus 9.6% for Hakone ryokan — a 2.5x spread — and within a single market the gap between the top and bottom quartiles is roughly threefold. That dispersion is itself a map of the pricing headroom still left on the table.
- — Across 659 properties in four markets, the median weekend premium rate is 24.0% for Tokyo business hotels versus 9.6% for Hakone ryokan — a 2.5x spread between markets.
- — Within a single market, the bottom and top quartiles differ by roughly threefold. In Tokyo, 41.1% of properties cluster in the 20–40% band while 14.5% remain in the 0–5% band — a twin-peaked distribution.
- — Kanagawa ryokan run estimated weekend occupancy 7.6pt above weekdays, yet add only 9.6% to the rate. The mismatch between the demand peak and the price peak is the single largest pocket of headroom.
- — The higher a property’s weekday base rate, the less it moves the weekend — a pattern consistent across all four markets. In Hakone, the low-premium group’s weekday rate is ¥46,500, 1.6x higher than the high-premium group.
- — Bringing under-median properties up to their market median would add ¥600–¥2,100 per room per weekend night, or ¥54,000–¥191,000 per room per year (an upper-bound illustration on a listed-price basis).
Metric Definitions Used in This Article
- Listed price: The price of the lowest-priced plan each property publishes on OTAs and other channels (the lead-in rate). Per-room rate at double occupancy, tax-included. Because this article deals with relative differences between days of the week, we use the lowest-plan level, which is less affected by changes in plan composition. It is not the settled rate itself.
- Weekend premium rate: For each property, the median listed price for Friday and Saturday check-in dates ÷ the median listed price for Sunday–Thursday check-in dates − 1.
- Saturday premium rate: The same formula, with the numerator restricted to Saturday check-in dates only.
- OCC (occupancy rate): The share of sold rooms against total rooms in the area (an estimate based on OTA sales inventory). In this article it is used only for prefecture-level macro aggregates; occupancy for individual properties is not calculated.
- Data source: MetroEngines Research
How we measured it — isolate ordinary weeks, then divide property by property
The aggregation window runs 61 days, from September 1 to October 31, 2026. From that we excluded September 19–23 (the five-day run spanning Respect for the Aged Day and the Autumn Equinox) and October 10–12 (the three-day Sports Day weekend), because in those stretches it is the holiday rather than the day of the week that lifts prices. That leaves 53 days of ordinary weeks.
For each property we then divide the median Friday–Saturday listed price by the median Sunday–Thursday listed price. We use the median rather than the mean so that a handful of outlier days does not drag the centre of the distribution. Properties with fewer than 20 observation days, or with thin observations on either the Friday–Saturday or the weekday side, were excluded.
| Market | Population | With price data | In scope | Weekday median | Fri–Sat median | Saturday median |
|---|---|---|---|---|---|---|
| Tokyo · business hotels | 525 | 444 | 441 | ¥13,700 | ¥18,100 | ¥22,700 |
| Osaka · city hotels | 70 | 55 | 55 | ¥10,400 | ¥12,700 | ¥17,100 |
| Hakone · ryokan | 70 | 57 | 57 | ¥37,700 | ¥41,800 | ¥54,200 |
| Okinawa · resort hotels | 126 | 106 | 106 | ¥18,300 | ¥20,400 | ¥21,800 |
Population is the count of properties MetroEngines Research identifies as currently operating. All prices are medians of the lowest-priced plan level, per room at double occupancy, tax-included. Total in scope: N=659 properties.
Source: MetroEngines Research; compiled by the HotelBank Editorial Team
Each market has its own shape — Tokyo is twin-peaked, Hakone and Okinawa cluster low
Plot the property-level weekend premium rate as a histogram and the outline of each market separates clearly.
The vertical axis is the share (%) of in-scope properties in each market. Tokyo business hotels N=441, Osaka city hotels N=55, Hakone ryokan N=57, Okinawa resort hotels N=106.
Source: MetroEngines Research; compiled by the HotelBank Editorial Team
Among Tokyo business hotels, 41.1% (181 properties) cluster in the 20–40% band, while 14.5% (64 properties) remain in the 0–5% band. The distribution has two peaks straddling the 24.0% median: within the same city and the same category, pricing practice is split in two.
Hakone ryokan, by contrast, place 49.2% (28 properties) in the 0–10% band, and Okinawa resort hotels put 48.1% (51 properties) in the same band. The more leisure-oriented the market, the more it leans toward small weekend uplifts. Osaka city hotels form a single peak centred on 15–20%, the tightest distribution of the four markets.
| Market | Bottom 25% | Median | Top 25% | Top 10% | Median Saturday premium | Properties under 2% |
|---|---|---|---|---|---|---|
| Tokyo · business hotels | 11.7% | 24.0% | 36.0% | 48.1% | 51.4% | 56 properties (12.7%) |
| Osaka · city hotels | 14.0% | 18.7% | 30.5% | 46.5% | 47.9% | 1 property (1.8%) |
| Hakone · ryokan | 4.8% | 9.6% | 17.1% | 49.2% | 31.4% | 12 properties (21.1%) |
| Okinawa · resort hotels | 4.7% | 10.0% | 16.6% | 22.7% | 13.8% | 19 properties (17.9%) |
“Properties under 2%” = properties whose weekend premium rate is below 2%, i.e. selling at an essentially flat rate that does not track the day of the week.
Source: MetroEngines Research; compiled by the HotelBank Editorial Team
What “the weekend” means differs by market — cities step up from Thursday, resorts spike on Saturday alone
Measuring the weekend premium with Friday and Saturday bundled together hides the difference in shape between markets. So we re-derived a day-of-week listed-price index, setting each property’s Sunday–Thursday median to 1.000.
Market medians after normalising each property’s Sunday–Thursday median to 1.000. 53 ordinary-week days, September–October 2026, N=659 properties.
Source: MetroEngines Research; compiled by the HotelBank Editorial Team
Tokyo business hotels climb in steps toward the back half of the week: Wednesday 1.046, Thursday 1.103, Friday 1.143, Saturday 1.515. Osaka city hotels take almost the same shape, with Friday at 1.103 and Saturday at 1.479. In urban markets where business and leisure demand overlap, pricing starts moving from Thursday. That Thursday-peak shape shows up on the occupancy side as well as in pricing.
Hakone ryokan, by contrast, run flat at 1.000–1.010 from Monday through Friday, with only Saturday jumping to 1.294. Okinawa resort hotels stay at 1.077 on Friday and 1.138 on Saturday. Ryokan and resorts concentrate everything on the night before a day off, so folding Friday into “the weekend” makes their uplift look smaller than it really is. Re-measured on the Saturday premium rate, Hakone ryokan come in at 31.4% and Tokyo business hotels at 51.4% — a far more faithful read on how these markets differ in character.
The demand gap and the pricing gap do not line up
Does this pricing shape actually match the shape of demand? From here we switch to prefecture-level macro aggregates and look at day-of-week occupancy for June and July 2026 — the most recent months with settled results (excluding the Marine Day long weekend).
OCC (occupancy rate) = the share of sold rooms against total rooms in the area (an estimate based on OTA sales inventory). Property counts: Tokyo business N=873, Osaka city N=91, Kanagawa ryokan N=249, Okinawa resort N=245 (maximum for each month).
Source: MetroEngines Research; compiled by the HotelBank Editorial Team
| Market | Weekday OCC | Fri–Sat OCC | Demand gap | Saturday − weekday | Median weekend premium |
|---|---|---|---|---|---|
| Tokyo · business hotels | 93.2% | 95.2% | +2.0pt | +2.9pt | 24.0% |
| Osaka · city hotels | 89.3% | 92.2% | +2.9pt | +3.9pt | 18.7% |
| Kanagawa · ryokan (whole prefecture, incl. Hakone) | 81.0% | 88.6% | +7.6pt | +10.5pt | 9.6% |
| Okinawa · resort hotels | 91.8% | 92.5% | +0.7pt | +0.7pt | 10.0% |
Occupancy is a prefecture-level estimate, aggregating daily averages by day of the week for June and July 2026 (excluding the July 18–20 long weekend). The median weekend premium is a property-level aggregate for September–October (Hakone ryokan at town level); note that the geographic scopes do not match.
Source: MetroEngines Research; compiled by the HotelBank Editorial Team
The largest day-of-week swing in demand belongs to Kanagawa ryokan: 81.0% on weekdays against 88.6% on Friday–Saturday, and +10.5pt over weekdays if you take Saturday alone. Yet their median property-level weekend premium is 9.6%, among the lowest of the four markets. The demand peak is large; the price peak is small. That asymmetry is the clearest single indication of the pricing upside still available in the Hakone ryokan market.
Okinawa resort hotels sit at the opposite end, with a demand gap of just +0.7pt — effectively none. Stays are longer and many itineraries start and end midweek, so demand is structurally insensitive to the day of the week. A weekend premium of 10.0% in this market reads as pricing that is faithful to the demand structure. In a market like Okinawa where demand does not move with the day of the week, running a flat rate is itself a rational strategy, and predictability becomes a strength in its own right.
Tokyo business hotels show a +2.0pt demand gap against a 24.0% premium. With occupancy already in the low-to-mid 90s and close to the ceiling, the remaining upside is in rate rather than volume — and this is a market that is in fact going after it on rate.
The higher the weekday base, the less the weekend moves
Next we split each market into two groups at the median weekend premium rate and compared their weekday base listed prices. All four markets pointed the same way: the group with the lower premium rate carries the higher weekday listed price.
| Market | Group | Properties | Median premium | Median weekday listed price | Median room count |
|---|---|---|---|---|---|
| Tokyo · business hotels | Below median | 220 | 11.7% | ¥15,800 | 144 rooms |
| At or above median | 221 | 35.9% | ¥13,300 | 141 rooms | |
| Osaka · city hotels | Below median | 27 | 14.0% | ¥11,600 | 217 rooms |
| At or above median | 28 | 30.2% | ¥9,800 | 260 rooms | |
| Hakone · ryokan | Below median | 28 | 4.8% | ¥46,500 | 23 rooms |
| At or above median | 29 | 16.6% | ¥28,600 | 25 rooms | |
| Okinawa · resort hotels | Below median | 53 | 4.8% | ¥18,500 | 121 rooms |
| At or above median | 53 | 16.6% | ¥17,700 | 85 rooms |
Source: MetroEngines Research; compiled by the HotelBank Editorial Team
The horizontal axis is the median weekday (Sun–Thu) listed price (log scale; double occupancy, tax-included); the vertical axis is the weekend premium rate. One dot = one property, N=655 properties (excluding the 4 properties below ¥4,000 on the horizontal axis).
Source: MetroEngines Research; compiled by the HotelBank Editorial Team
The widest gap is among Hakone ryokan: the below-median premium group sits at ¥46,500 even on weekdays, against ¥28,600 for the at-or-above-median group — a 1.6x difference. High-rate properties hold a high level from weekdays onward and can secure their annual rate without moving prices by day of the week. That is not a weakness; it is evidence that a product design capable of promising a consistent rate year-round is working. Where a property serves repeat guests or gift demand — segments for which price predictability is itself a reason to book — restraining rate movement is a defensible call.
That said, in markets where the demand peak clearly falls on Saturday, there is room to hold the weekday level and add the uplift on Saturday alone. In the scatter plot, the ¥30,000–¥60,000 weekday band contains both dots at 0–10% premium and dots above 30%. The fact that both approaches work at the same price point means there is a level at which the uplift can be added without losing demand.
The weekend premium grows as lead time shortens
One important caveat. The September–October window analysed here sits 25 to 85 days ahead of the survey date (early August 2026). Listed prices for future dates change as the check-in date approaches.
So we ran the same formula separately on October (lead time 55–85 days), on September (25–55 days), and on the closed-out results for June 1 to July 17, 2026.
The October and September figures are estimates based on listed prices as of early August 2026. The June–July figures are observations taken after selling closed. Property-level medians for each market.
Source: MetroEngines Research; compiled by the HotelBank Editorial Team
For Tokyo business hotels the premium is larger the closer the check-in date: 15.5% for October, 21.6% for September, and 24.4% on the June–July results. Hakone ryokan more than double, from 6.3% for October to 15.0% for September. The weekend premium is not fully formed when selling opens; it is built up once demand comes into view. The September–October distribution shown here is therefore close to a floor on the eventual level.
We also checked how far each property’s pricing stance persists. Matching the June–July results against the September–October premium rates property by property, the rank correlation is 0.54 in Tokyo, 0.49 in Okinawa, and 0.24 in both Osaka and Hakone. Of the properties below the median in June–July, 60–67% were still below the median in September–October. Pricing practice persists to a degree as part of a property’s operating style, but there is still room for positions to change from period to period.
Sizing the headroom — what does it come to per room per year?
For the group of properties whose weekend premium rate falls below the market median, we estimate the uplift that would result from raising weekend listed prices to the market median level. The formula is “median weekday listed price × (market median premium rate − that property’s premium rate)”, multiplied by the 104 Friday and Saturday nights in a year and then by that market’s estimated Friday–Saturday occupancy.
| Market | Properties in scope | Rooms in scope | Uplift per room per weekend night | Estimated Fri–Sat occupancy | Per room per year | Market total (reference) |
|---|---|---|---|---|---|---|
| Tokyo · business hotels | 220 properties | 36,709 rooms | ¥1,900 | 95.2% | ¥183,000 | approx. ¥9.3bn |
| Osaka · city hotels | 27 properties | 7,503 rooms | ¥600 | 92.2% | ¥54,000 | approx. ¥0.7bn |
| Hakone · ryokan | 28 properties | 1,096 rooms | ¥2,100 | 88.6% | ¥191,000 | approx. ¥0.3bn |
| Okinawa · resort hotels | 53 properties | 9,167 rooms | ¥900 | 92.5% | ¥86,000 | approx. ¥1.0bn |
“Uplift per room per weekend night” is the median for the in-scope property group. The market total is a theoretical figure weighted by each property’s room count, and an upper-bound illustration on a listed-price basis. Actual settled rates, demand elasticity and the composition of existing bookings are not taken into account.
Source: MetroEngines Research; compiled by the HotelBank Editorial Team
Per room per year, that comes to roughly ¥183,000 for Tokyo business hotels and roughly ¥191,000 for Hakone ryokan. Multiply by the median room count (144 rooms in Tokyo, 23 rooms in Hakone) and the theoretical figure per property is on the order of ¥26 million a year in Tokyo and ¥4.4 million in Hakone.
These are, of course, upper-bound illustrations of what would happen if listed prices were reshaped to the market median, and they do not translate directly into revenue. What matters is less the amount itself than the fact that the distance between “doing nothing on the weekend” and “raising rates the way the market typically does” can be measured as a concrete figure of ¥600–¥2,100 per room per night. Once that distance is known, a property can decide whether to go after it in light of its own product design and guest mix.
Converting the uplift into quantile steps and price bands — three cross-sections and a two-axis grid
The estimate above shows only one point: the case of raising rates to the market median. The same formula holds for any of the quantiles given in the article, so we extend it to three cross-sections at different target levels. None of these are forecasts; they are unit conversions that feed the quantiles and median weekday listed prices stated in this article back into the formula.
As above, the formula is uplift (per room, per weekend night) = median weekday listed price × (target premium rate − current premium rate), and the annual conversion is uplift × 104 Friday and Saturday nights × estimated Friday–Saturday occupancy. Estimated Friday–Saturday occupancy uses the values in the table above (Tokyo 95.2%, Osaka 92.2%, Kanagawa 88.6%, Okinawa 92.5%; all aggregated for June–July 2026).
| Market | Median weekday listed price | Cross-section A: bottom 25% → median | Cross-section B: median → top 25% | Cross-section C: median → top 10% |
|---|---|---|---|---|
| Tokyo · business hotels | ¥13,700 | +12.3pt ¥1,685 / ¥166,828 | +12.0pt ¥1,644 / ¥162,769 | +24.1pt ¥3,302 / ¥326,924 |
| Osaka · city hotels | ¥10,400 | +4.7pt ¥489 / ¥46,889 | +11.8pt ¥1,227 / ¥117,655 | +27.8pt ¥2,891 / ¥277,212 |
| Hakone · ryokan | ¥37,700 | +4.8pt ¥1,810 / ¥166,781 | +7.5pt ¥2,828 / ¥260,583 | +39.6pt ¥14,929 / ¥1,375,618 |
| Okinawa · resort hotels | ¥18,300 | +5.3pt ¥970 / ¥93,314 | +6.6pt ¥1,208 / ¥116,210 | +12.7pt ¥2,324 / ¥223,569 |
The quantiles, median weekday listed prices and estimated Friday–Saturday occupancy figures are all measured values given in the tables above. The 104 nights are the annual count of Fridays and Saturdays.
Source: MetroEngines Research; compiled by the HotelBank Editorial Team
Cross-section A is the case where bottom-quartile properties move into the middle of the market: ¥1,685 in Tokyo and ¥1,810 in Hakone. Cross-section C, the top-decile level, opens up to an extreme +39.6pt in Hakone — but that is an observed fact about a group of properties actually selling at that level in the market, not a recommended target.
Price band × uplift: a two-axis grid
To make it easier to locate your own property, the grid below lays out the uplift per room per weekend night across two axes: the weekday listed-price level and the size of the increase. The five levels on the vertical axis are the median weekday listed prices that appear in the tables above, and the +5 to +25pt range on the horizontal axis is kept inside the range of quantile gaps observed here (+4.7pt to +39.6pt). No extrapolation has been applied.
| Median weekday listed price \ increase | +5pt | +10pt | +15pt | +20pt | +25pt |
|---|---|---|---|---|---|
| ¥9,800 Osaka · upper group | ¥490 | ¥980 | ¥1,470 | ¥1,960 | ¥2,450 |
| ¥13,700 Tokyo · market median | ¥685 | ¥1,370 | ¥2,055 | ¥2,740 | ¥3,425 |
| ¥18,300 Okinawa · market median | ¥915 | ¥1,830 | ¥2,745 | ¥3,660 | ¥4,575 |
| ¥28,600 Hakone · upper group | ¥1,430 | ¥2,860 | ¥4,290 | ¥5,720 | ¥7,150 |
| ¥46,500 Hakone · lower group | ¥2,325 | ¥4,650 | ¥6,975 | ¥9,300 | ¥11,625 |
Each cell is the product of the median weekday listed price and the increase. To convert to an annual figure, multiply by 104 nights and your own property’s Friday–Saturday sales performance.
Source: MetroEngines Research; compiled by the HotelBank Editorial Team
The centre of the grid (weekday ¥18,300, +15pt) is ¥2,745. At the same +15pt, a property with a ¥9,800 weekday rate gets ¥1,470 while one at ¥46,500 gets ¥6,975 — a 4.7x difference. Put the other way round, a lower-rate property needs a larger increase to capture the same amount as a higher-rate one. Before “how many points to raise” comes “what is my weekday base”, because that is what determines the size of the uplift — which means the pattern common to all four markets, that properties with higher weekday bases move the weekend less, skews the distribution of headroom even further when measured in yen.
A practical checklist — four steps to measure your own weekend premium
| Step | What to do | What to look for |
|---|---|---|
| 1. Isolate ordinary weeks | Take the last three months of sales results and strip out long weekends, event dates and peak season, leaving only ordinary weeks | Measure with long weekends still mixed in and you cannot separate the day-of-week effect from the seasonal effect |
| 2. Build your own index | Set the Sunday–Thursday median to 1.000 and calculate an index for each of the seven days, Monday through Sunday | Friday near 1.00 means you are “Saturday-only”. Thursday and Friday at 1.05 or above means the “urban step-up” |
| 3. Line it up against the market median | Overlay your own index on the median for the same area and category (the tables in this article) | Any day sitting 10pt or more below the median is the first candidate to touch |
| 4. Test from Saturday, in stages | Rather than moving every day at once, move Saturday alone in 5% steps over several weeks and watch the response | Looking by lead time, dates where inventory sells down faster than the 45-days-out mark can carry a wider increase |
Step 2 matters in particular as the way to determine whether your property is an “urban step-up” or a “night-before-the-day-off” case. Where Friday tracks at essentially the same level as weekdays, as in the Hakone ryokan market, widening the Saturday increase fits the shape of demand better than adding an uplift on Friday. Conversely, in markets like Tokyo and Osaka where demand is already building from Thursday, it is worth checking whether Thursday and Friday have been left untouched.
⚠ A note on prices for future dates: The main analysis window in this article, September–October 2026, sits 25 to 85 days ahead of the survey date (early August 2026). Listed prices are the levels published on OTAs and other channels as of the survey date, and they move as the check-in date approaches. As shown above, weekend premium rates tend to widen as lead time shortens, so please read the distribution presented here as close to a floor on the eventual level.
Conclusion
Measured across 659 properties in four markets, the median weekend premium rate is 24.0% for Tokyo business hotels, 18.7% for Osaka city hotels, 10.0% for Okinawa resort hotels and 9.6% for Hakone ryokan. Beyond the 2.5x gap between markets, the bottom and top quartiles within a single market differ by roughly threefold.
Set against demand, Kanagawa ryokan run weekend occupancy 7.6pt above weekdays while adding only 9.6% to the rate. Okinawa, conversely, has a day-of-week demand swing of just +0.7pt, and flat-rate operation fits that structure. Pricing headroom lies not in “having a small premium” as such, but in the demand peak and the price peak being out of alignment.
And the pattern common to all four markets — that properties with higher weekday bases move the weekend less — is the flip side of a product design that offers price stability as a value in itself. A rate that is predictable year-round is a reason to be chosen. On top of that, moving closer to the market’s typical approach on Saturday alone already brings ¥600–¥2,100 per room per night into view. The place to start is building your own day-of-week index and laying it over the market median.
Related reading
References and sources
■ Data sources
Property-level listed prices are daily published prices collected by MetroEngines Research (lowest-priced plan level, per room at double occupancy, tax-included). Coverage is the 53 ordinary-week days within September 1 to October 31, 2026, plus June 1 to July 17, 2026 as post-close results. Estimated day-of-week occupancy uses daily aggregates at prefecture and category level (June–July 2026). Populations are based on the operating-property master: 525 business hotels in Tokyo, 70 city hotels in Osaka, 70 ryokan in Hakone (Kanagawa), and 126 resort hotels in Okinawa.
■ Estimation assumptions
The weekend premium rate is “median listed price for Friday and Saturday check-in dates ÷ median listed price for Sunday–Thursday check-in dates − 1”. Properties with fewer than 20 observation days, and properties with thin observations on either the Friday–Saturday or the weekday side, were excluded, leaving 659 properties in scope. Headroom is calculated as “median weekday listed price × (target premium rate − current premium rate)”, and the annual conversion multiplies by the 104 Friday and Saturday nights in a year and the estimated Friday–Saturday occupancy given in the tables above. The three-cross-section table and the two-axis grid are unit conversions that feed the quantiles and price levels stated in this article back into the same formula; they are not demand forecasts. Both axes of the grid are kept within the range of values observed here, and no extrapolation has been applied.
■ Limitations and caveats
Listed prices are not settled rates, and the headroom estimate is an upper-bound illustration on a listed-price basis. Demand elasticity, the composition of existing bookings, OTA commissions and channel-level sales results are not taken into account. The main analysis window of September–October 2026 sits 25 to 85 days ahead of the survey date (early August 2026), and because weekend premium rates tend to widen as lead time shortens, the distribution shown is close to a floor on the eventual level. Estimated day-of-week occupancy is at prefecture level while the weekend premium rate is at property level (town level for Hakone), so the geographic scopes do not match. Occupancy is an estimate based on OTA sales inventory and tends to read higher than actual occupancy, so it should be read as a relative comparison between markets rather than as an absolute level.
■ Market data
- MetroEngines Research — property-level daily listed prices (June 1 to July 17, 2026; September 1 to October 31, 2026; double occupancy, tax-included), prefecture-level daily estimated occupancy (May–July 2026), operating-property master
- MetroEngines Research — market populations based on the operating-property master (525 business hotels in Tokyo, 70 city hotels in Osaka, 126 resort hotels in Okinawa)
■ Government statistics
- Japan Tourism Agency, “Overnight Travel Statistics Survey” — room occupancy by facility type (2025 full-year confirmed figures: business hotels 75.3%)
- Japan Tourism Agency, “Overnight Travel Statistics Survey (May 2026 second preliminary report; June 2026 first preliminary report)”