

HotelBank has already published several pieces on hotel investment in the Chugoku region: one covering the four San’in cities (Tottori and Shimane), one comparing the three San’yo cities (Okayama, Kurashiki and Himeji), and one tracking the supply polarisation between Hatchobori and Hiroshima Station. Yamaguchi appeared in none of them. Until now, HotelBank had never run an investment piece with Yamaguchi Prefecture as its subject. This article fills that gap, as one installment in our prefecture-by-prefecture series. The tier structure on the neighbouring San’in side is covered in San’in 4-City Hotel Investment Map (Tottori and Shimane), and reading the two together brings the chain of price bands across the Chugoku region into view.
The conclusion first. Yamaguchi’s lodging market is polarised between business hotels at an estimated settled ADR of around ¥6,000 and hot-spring and island resorts above ¥10,000, and in between, the ¥8,000–12,000 upper-midscale band is all but empty, particularly along the Seto Inland Sea industrial belt. Yet demand is not weak. At holiday peaks, business hotels sell out their rooms more than a month ahead. The gap is not the result of thin demand but of the fact that no product has yet been supplied in that band — this article tests that hypothesis against the estimated settled ADR of 14 municipalities, the room-count distribution by price band, the pace at which remaining inventory is absorbed, and employment data around railway stations.
Metric Definitions Used in This Article
- ADR (average daily rate): the lowest publicly listed plan level on OTAs for each property (double occupancy, per room, tax-inclusive), adjusted by a property-type correction factor to produce an estimated settled rate (tax-exclusive equivalent). Cross-checked against property-level disclosures by listed hotel REITs (91 properties, trailing three months), the median error is about 7%. These are estimates and differ from each property’s actual transacted rates or accounting figures. Area-level ADR is the median of the covered properties (the level of a typical property in the area).
- Listed price: the average of all OTA plans (room-only through meal-inclusive), double occupancy, per room, tax-inclusive. Because its basis differs from the estimated settled ADR, this article always labels it explicitly as the listed price.
- OCC (occupancy): sold rooms as a share of total rooms in the area (an estimate based on OTA sales inventory). It reflects how far OTA-listed inventory has been absorbed and differs from a property’s actual occupancy.
- LT (lead time): days to check-in. LT0 = the day itself. Early sell-out LT = the lead time at which remaining rooms first reached zero (a higher value means an earlier sell-out). Sell-out days observed = the cumulative number of days on which zero remaining rooms were observed.
- Data source: MetroEngines Research & Consulting
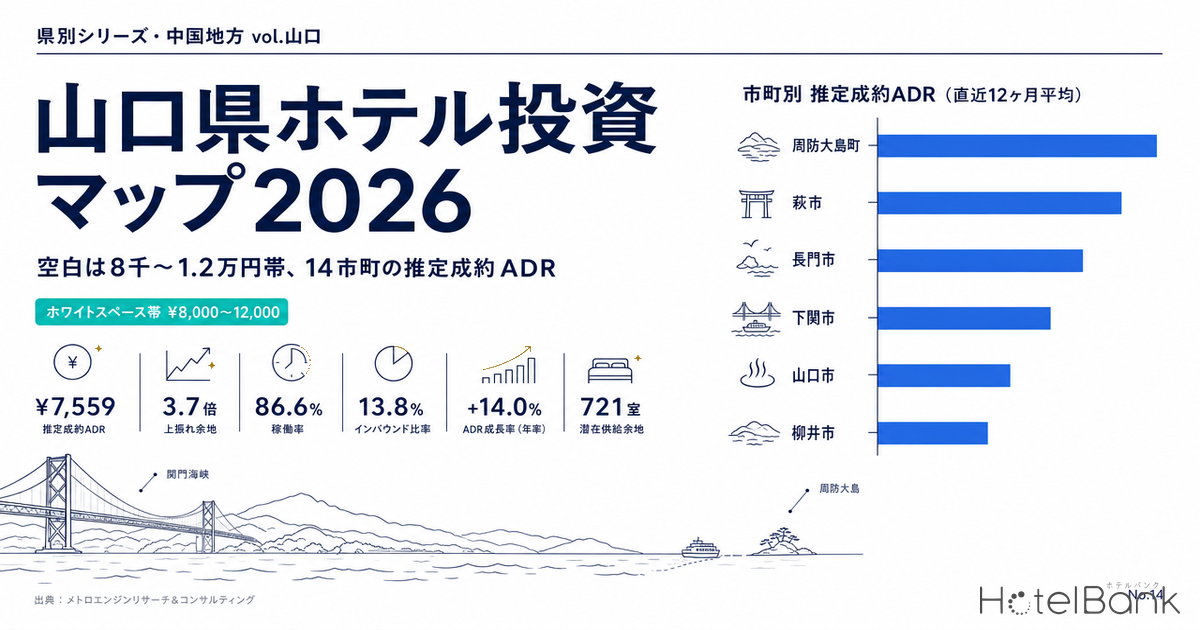
- — Yamaguchi’s prefecture-wide estimated settled ADR averaged ¥7,559 over the trailing 12 months (+2.0% YoY). That is the lowest of the five Chugoku prefectures, 1.4x below top-ranked Shimane (¥10,419).
- — The spread across municipalities is 3.7x (Suo-Oshima ¥19,124 ÷ Yanai ¥5,105). The top end is carried by sightseeing and hot-spring areas, the bottom by business demand along the Seto Inland Sea industrial belt.
- — The gap sits in the ¥8,000–12,000 band. Only 1,362 of the 9,845 business-hotel rooms (13.8%) fall in it — and just 448 rooms (7.7%) within the industrial belt.
- — Demand is not weak. Estimated OCC for business hotels is 86.6% (average for May–July 2026, N=85 properties), on par with the five Chugoku prefectures. Over Golden Week 2026, leading properties sold out at LT33–35.
- — A 100-room upper-midscale build (22 m², estimated settled ADR ¥10,000, 82% occupancy) returns a GOP yield of 6.3% after construction-period inflation, and holds 5.3% even under the most conservative assumptions.
Executive Summary — the tiers across 14 municipalities, and the band that opened between them
Prefecture-wide estimated settled ADR averaged about ¥7,600 over the trailing 12 months (August 2025 to July 2026), up 2.0% year on year. That is a modest level against the national average, but folded inside this single figure is a 3.7x tier structure. The top is held by sightseeing and hot-spring areas such as Suo-Oshima, Hagi and Nagato; the bottom by the industrial cities along the Seto Inland Sea. And between the two, in the ¥8,000–12,000 band, the prefecture has almost no room stock at all.
Estimated settled ADR across 14 municipalities — from ¥19,000 at the top to ¥5,100 at the bottom
Levelled to a 12-month average by municipality, the tiers separate cleanly into three layers. At the top is Suo-Oshima at about ¥19,100, driven by island-resort and whole-house rental inventory in the Seto Inland Sea; the small number of covered properties makes the figure volatile, but it is the only reading in the high ¥10,000s in the prefecture. The second layer sits around ¥10,000: Hagi (about ¥12,400), Nagato (about ¥10,700) and Shimonoseki (about ¥9,600). The third layer runs from Yamaguchi City (about ¥8,200) down through the roughly ¥6,000 band of the Seto Inland Sea industrial belt.
Source: MetroEngines Research & Consulting (estimated settled ADR, 14 municipalities, 12 confirmed months each, months with three or more covered properties)
| Municipality | Estimated settled ADR (trailing 12-month avg.) | Year-earlier 12-month avg. | YoY | Covered properties (max) | Months counted |
|---|---|---|---|---|---|
| Suo-Oshima | ¥19,124 | ¥17,888 | +6.9% | 4 | 12 |
| Hagi | ¥12,375 | ¥12,808 | -3.4% | 18 | 12 |
| Nagato | ¥10,720 | ¥10,676 | +0.4% | 25 | 12 |
| Shimonoseki | ¥9,622 | ¥8,439 | +14.0% | 41 | 12 |
| Yamaguchi City | ¥8,187 | ¥8,128 | +0.7% | 29 | 12 |
| Mine | ¥6,655 | ¥7,730 | -13.9% | 3 | 12 |
| Ube | ¥6,477 | ¥6,124 | +5.8% | 15 | 12 |
| Iwakuni | ¥6,084 | ¥5,725 | +6.3% | 17 | 12 |
| Kudamatsu | ¥6,038 | ¥6,031 | +0.1% | 6 | 12 |
| Shunan | ¥6,023 | ¥6,335 | -4.9% | 18 | 12 |
| Hikari | ¥5,937 | ¥5,985 | -0.8% | 4 | 12 |
| Hofu | ¥5,873 | ¥5,912 | -0.7% | 8 | 12 |
| Sanyo-Onoda | ¥5,863 | ¥6,254 | -6.3% | 6 | 12 |
| Yanai | ¥5,105 | ¥4,924 | +3.7% | 4 | 12 |
Source: MetroEngines Research & Consulting (N=14 municipalities, confirmed months only, months with three or more covered properties)
The year-on-year figure that stands out is Shimonoseki at +14.0%, growth without parallel in the prefecture. Beyond being a junction where the tourism draw of the Kanmon Strait coexists with business demand, its role as the gateway for the scheduled sea route to Busan, South Korea, appears to be lifting the price floor. Kampu Ferry has resumed the passenger service it suspended during the COVID-19 pandemic, and Shimonoseki Port functions as Yamaguchi’s largest international ferry port. Ube (+5.8%) and Iwakuni (+6.3%) are also growing within the industrial belt, while Shunan (-4.9%) and Sanyo-Onoda (-6.3%) are flat to slightly down year on year, with the roughly ¥6,000 level becoming entrenched. Broken down by property type, the year-on-year direction also splits between business and city hotels, which is worth noting (see Yamaguchi Settled ADR H1 2026: Business +3.4%, City Hotels −6.4% for detail).
Source: MetroEngines Research & Consulting (confirmed months only; 2024 covers August–December, 2026 covers January–July)
On a monthly view, Yamaguchi’s ADR shows little seasonality. Peaks fall in August and May (the holiday week) and troughs in June and December, but the amplitude stays broadly within -10% to +16% of the monthly average. In resort-dependent prefectures the peak months determine annual revenue; in Yamaguchi, business demand accounts for the majority of the room stock, producing a demand structure levelled across the year. From an investment standpoint, this means peak risk is small, but in exchange any lift in rate flows straight through to annual revenue.
| Prefecture | Estimated settled ADR (trailing 12-month avg.) | Year-earlier 12-month avg. | YoY | Estimated OCC (all property types) | Covered properties (ADR max / OCC avg.) |
|---|---|---|---|---|---|
| Shimane | ¥10,419 | ¥9,753 | +6.8% | 86.7% | 180 / 238 |
| Hiroshima | ¥8,655 | ¥8,168 | +6.0% | 87.3% | 305 / 377 |
| Tottori | ¥8,622 | ¥8,439 | +2.2% | 85.1% | 153 / 172 |
| Okayama | ¥8,319 | ¥8,195 | +1.5% | 86.1% | 196 / 242 |
| Yamaguchi | ¥7,559 | ¥7,409 | +2.0% | 85.8% | 199 / 204 |
Source: MetroEngines Research & Consulting (estimated settled ADR uses confirmed months only, with three or more covered properties per month; estimated OCC is an estimate based on OTA sales inventory)
Look beyond the prefecture and Yamaguchi’s position becomes sharper. Lining up the five Chugoku prefectures on the same basis, Yamaguchi’s estimated settled ADR of ¥7,559 is the lowest of the five — 1.4x below top-ranked Shimane (¥10,419) and about ¥1,100 below neighbouring Hiroshima (¥8,655). Yet estimated OCC is 85.8%, essentially level with Tottori at 85.1%, Okayama at 86.1% and Hiroshima at 87.3%. Inventory is being absorbed no differently from neighbouring prefectures, but the rate alone sits a notch lower — that is Yamaguchi’s structure. A price gap that occupancy cannot explain points not to weak demand but to the absence of product built to capture the band above.
The Yuda Onsen paradox — why Yamaguchi City, home to one of the prefecture’s largest hot-spring districts, stops at ¥8,200
Yamaguchi City has Yuda Onsen. It is one of the largest hot-spring districts in the prefecture, and in terms of ryokan concentration it stands comparison with Nagatoyumoto (Nagato) and Hagi. Even so, Yamaguchi City’s citywide estimated settled ADR is about ¥8,200, below Nagato (about ¥10,700) and Hagi (about ¥12,400).
The inversion resolves once the figures are broken out by property type. Taking ryokan alone, Yamaguchi City’s estimated settled ADR is about ¥15,400, above Nagato (about ¥12,100). As a hot-spring destination its rate is by no means low. What drags the citywide figure down is the depth of business hotels tied to the prefectural-capital function. Business hotels in Yamaguchi City run an estimated settled ADR of about ¥7,100, and because they account for the majority of properties and rooms, the city median is pulled toward the business band. A reading that divides the prefecture into four layers — Shimonoseki, Yuda Onsen, Iwakuni and Akiyoshidai/Nagatoyumoto — is set out in detail in Yamaguchi’s 4-Tier Hotel Market.
| City | Business hotels Estimated settled ADR | Ryokan Estimated settled ADR | Citywide Estimated settled ADR | Covered properties (business / ryokan, median) |
|---|---|---|---|---|
| Hagi | ¥8,280 | ¥19,271 | ¥12,375 | 5 / 11 |
| Nagato | ¥8,686 | ¥12,110 | ¥10,720 | 3 / 21 |
| Yamaguchi City | ¥7,067 | ¥15,399 | ¥8,187 | 16 / 11 |
| Shimonoseki | ¥7,005 | ¥14,541 | ¥9,622 | 16 / 16 |
| Iwakuni | ¥5,830 | ¥15,650 | ¥6,084 | 10 / 5 |
| Shunan | ¥5,483 | ¥23,657 | ¥6,023 | 15 / 3 |
| Ube | ¥6,064 | — | ¥6,477 | 12 / — |
| Hofu | ¥5,857 | — | ¥5,873 | 6 / — |
| Sanyo-Onoda | ¥6,001 | — | ¥5,863 | 4 / — |
| Kudamatsu | ¥5,718 | — | ¥6,038 | 4 / — |
| Yanai | ¥5,210 | — | ¥5,105 | 3 / — |
Source: MetroEngines Research & Consulting (confirmed 12-month average, August 2025 to July 2026, months with three or more covered properties; property types with fewer than six months of data are shown as “—”)
This table explains Yamaguchi’s price structure on a single page. Ryokan rates line up in the ¥10,000s, led by Hagi (about ¥19,300). Business hotels, apart from the ¥8,000s in Nagato and Hagi, cluster almost entirely in the ¥5,000–7,000 range across every city. No property type stands between them, in the ¥8,000–12,000 band. When a city with a hot-spring district also carries the prefectural-capital function, however high ryokan rates run, the city’s representative figure is pulled back toward the business band. Turned around, this also means Yamaguchi City has room to place a product that holds an asset like Yuda Onsen and sells a notch above the business band.
Source: MetroEngines Research & Consulting (confirmed 12-month average, August 2025 to July 2026)
The price-band white space — only 1,362 of 9,845 business-hotel rooms (13.8%) sit at ¥8,000–12,000
This is the heart of the article. Re-sorting by price band the 158 properties in the prefecture with 15 or more rooms and a confirmed estimated settled ADR (12,989 rooms in total) brings the shape of the distribution into view.
| Estimated settled ADR band | All types Properties | All types Rooms | Room share | Business hotels Properties | Business hotels Rooms | Business hotels Room share |
|---|---|---|---|---|---|---|
| Under ¥6,000 | 50 | 4,403 | 33.9% | 44 | 4,200 | 42.7% |
| ¥6,000–8,000 | 45 | 4,686 | 36.1% | 36 | 4,244 | 43.1% |
| ¥8,000–12,000 | 23 | 1,949 | 15.0% | 12 | 1,362 | 13.8% |
| ¥12,000–20,000 | 17 | 870 | 6.7% | 1 | 39 | 0.4% |
| ¥20,000 and above | 23 | 1,081 | 8.3% | 0 | 0 | 0.0% |
Source: MetroEngines Research & Consulting (N=158 properties, 12,989 rooms; of which 93 business hotels, 9,845 rooms. Limited to properties with 15 or more rooms and at least six confirmed months of data)
Source: MetroEngines Research & Consulting (N=158 properties, 12,989 rooms)
Across all property types, 9,089 rooms (70.0% room share) cluster below ¥8,000 and 1,951 rooms (15.0%) sit above ¥12,000. In between, the ¥8,000–12,000 band holds 1,949 rooms, or 15.0%. At first glance that does not look especially thin, but the band is made up almost entirely of mid-priced ryokan in Hagi and Nagato plus a handful of hotels in Shimonoseki and Yamaguchi City.
Narrow it to business hotels and the gap becomes far sharper. Of 9,845 business-hotel rooms, 1,362 (13.8%) fall in the ¥8,000–12,000 band, and only 39 rooms (0.4%) sit above ¥12,000. Yamaguchi’s business hotels are, in effect, operating within a single range below ¥8,000.
Restrict the view to the Seto Inland Sea industrial belt — the eight municipalities of Ube, Shunan, Iwakuni, Hofu, Sanyo-Onoda, Kudamatsu, Hikari and Yanai — and the structure becomes more extreme still. Of the belt’s 53 business-hotel properties and 5,811 rooms, the ¥8,000–12,000 band accounts for three properties and 448 rooms (7.7% on a room basis), and nothing at all sits above ¥12,000. The three properties holding that band ahead of the field are Green Rich Hotel Tokuyama Ekimae (Shunan, 117 rooms), AB Hotel Ube Shinkawa (Ube, 128 rooms) and Hotel Route-Inn Ube (Ube, 203 rooms), each with a track record of commanding relatively high rates within its area.
Source: MetroEngines Research & Consulting (N=158 properties, 15 or more rooms and at least six confirmed months) ■ blue frame = White Space 1 ■ navy frame = White Space 2
CrowdedOccupied territory
¥5,000–8,000 × 60–250 rooms
Most of the prefecture’s lodging stock (95 properties, 9,089 rooms across all types) is concentrated here. For a new entrant, differentiation tends to come down to cost structure.
WS①Upper-midscale in the industrial belt
¥8,000–12,000 × 90–140 rooms
Just 7.7% of business-hotel rooms (448) across the belt’s eight municipalities. Employment depth and holiday demand are both evident, yet no product has been placed in the band.
WS②Mid-scale lifestyle in hot-spring districts
¥12,000–20,000 × 40–90 rooms
Yuda, Nagatoyumoto and Hagi have a deep bench of existing ryokan, but non-ryokan formats at this scale (lodging-led, light food service) remain untouched.
The demand-side evidence — business-hotel estimated OCC of 86.6% (May–July 2026 average, N=85 properties), and holiday weeks that sell out a month ahead
A gap in a price band is not, on its own, a basis for an investment decision. It has to be separated into a gap because there is no demand and a gap because there is demand but no product. Two angles confirm the demand side here.
Source: MetroEngines Research & Consulting (Figure 6: N=204 properties, 12,612 rooms, three-month average May–July 2026 / Figure 7: N=3 properties, 32–48 observation points)
First, occupancy. On a three-month average for May–July 2026, Yamaguchi’s estimated OCC was 85.8% across all types (N=204 properties, 12,612 rooms), 86.6% for business hotels (N=85 properties, 9,346 rooms), 86.9% for city hotels (N=8 properties), 85.2% for ryokan (N=58 properties) and 75.3% for resorts (N=14 properties). The 86.6% for business hotels reads as a level with room for additional supply. As a rule of thumb, areas and property types with estimated OCC above 95% run chronically thin on spare inventory and can absorb substantial new supply, while anything below 80% warrants caution. Yamaguchi’s business hotels sit slightly above the midpoint of that range — in other words, in the zone where “current rates sell through comfortably, and there is room to introduce product at a higher rate”.
| # | Property | Location | Total rooms | Average Early sell-out LT | Days on which a sell-out was observed | Cumulative Sell-out days observed |
|---|---|---|---|---|---|---|
| 1 | Sun Hotel Kudamatsu | Kudamatsu | 104 rooms | LT35.0 | 5 of 5 days | 89 days |
| 2 | Hotel Route-Inn Yamaguchi Yuda Onsen | Yamaguchi City | 186 rooms | LT34.5 | 2 of 5 days | 63 days |
| 3 | Royal City Hotel | Ube | 79 rooms | LT34.5 | 4 of 5 days | 111 days |
| 4 | Comfort Hotel Shin-Yamaguchi | Yamaguchi City | 139 rooms | LT34.0 | 3 of 5 days | 62 days |
| 5 | Super Hotel Ube Kosan-dori | Ube | 108 rooms | LT34.0 | 3 of 5 days | 64 days |
| 6 | Toyoko Inn Iwakuni-eki Nishiguchi | Iwakuni | 240 rooms | LT34.0 | 3 of 5 days | 78 days |
| 7 | Toyoko Inn Tokuyama-eki Shinkansen-guchi | Shunan | 219 rooms | LT33.5 | 2 of 5 days | 66 days |
| 8 | Hotel Route-Inn Tokuyama Ekimae | Shunan | 188 rooms | LT33.5 | 2 of 5 days | 64 days |
| 9 | Hotel Route-Inn Ube | Ube | 203 rooms | LT33.3 | 3 of 5 days | 91 days |
| 10 | Hotel Amuse Shin-Yamaguchi | Yamaguchi City | 80 rooms | LT33.3 | 3 of 5 days | 80 days |
| 11 | Green Rich Hotel Iwakuni Ekimae | Iwakuni | 135 rooms | LT33.0 | 2 of 5 days | 32 days |
| 12 | Hotel Route-Inn Shunan – Tokuyama Higashi Inter – | Shunan | 250 rooms | LT33.0 | 3 of 5 days | 76 days |
Source: MetroEngines Research & Consulting (scope = business hotels in Yamaguchi Prefecture with check-in May 2–6, 2026. Of a population of 157 properties, 88 had observation data; the top 12 are drawn from the 62 properties whose OTA-released allocation was at least 30% of total rooms)
Second, the pace at which remaining inventory was absorbed on a confirmed peak date. Taking Golden Week 2026 (check-in May 2–6, dates that have already passed), we tracked the remaining-room trajectory of business hotels in the prefecture on a room basis. Leading properties reached an average LT of 33–35 — that is, zero remaining rooms more than a month before check-in. Sun Hotel Kudamatsu (Kudamatsu, 104 rooms) was observed sold out on all five dates, recording 89 cumulative sell-out days. Royal City Hotel (Ube, 79 rooms) recorded 111 cumulative days and Hotel Route-Inn Ube (Ube, 203 rooms) 91. Comfort Hotel Shin-Yamaguchi (Yamaguchi City, 139 rooms) still had 111 of 139 rooms remaining at LT53 for May 3 check-in, reached zero at LT34, and stayed sold out through to the day before.
One caveat: because these observations rest on data from March 10, 2026 onward, a May 3 check-in can only be traced back as far as LT54. The actual sell-out may have come earlier still. Even so, a figure of LT34 shows that inventory at around ¥6,000 ADR is exhausted more than a month in advance. Business hotels in the industrial belt are not selling because they are cheap; there is simply no slack in the absolute volume of inventory.
The same picture holds in the hot-spring segment. Among ryokan, three properties in Yamaguchi City (Yubel Hotel Matsumasa, 89 rooms; Oyado Onn Yuda Onsen, 115 rooms; Nishinomiyabi Tokiwa, 90 rooms) reached sell-out at an average LT of 26–29, each observed sold out on four of the dates. Yumoto Kanko Hotel Saikyo in Nagato (106 rooms) averaged LT28.3, and Hagi Honjin (Hagi, 91 rooms) was observed sold out on all five dates. Yuda Onsen, Nagatoyumoto and Hagi — the prefecture’s principal hot-spring districts — retain almost no spare inventory against holiday demand. (Of 261 covered properties, 62 had observation data; the 52 with an OTA-released allocation of at least 30% were counted.)
How to read this: Properties whose OTA-released allocation is under 30% of total rooms are excluded from the counts. Where the released allocation is small, the property may sell mainly through channels other than OTAs — direct booking on its own site, travel agents, corporate contracts — or may be practising inventory control by adding rooms in small increments, or may simply have a small contractual allocation; remaining OTA inventory alone cannot settle the supply-demand question in those cases. Note also that zero remaining rooms is an observation that the released allocation sold out; it does not mean the property as a whole was full.
The locational evidence — 1,978 establishments and 15,527 workers around Tokuyama Station, a 23.4% office share around Shimonoseki Station
Holiday demand alone cannot explain weekday occupancy in the upper-midscale band. For business hotels in the industrial belt, weekday business-travel demand is the revenue foundation, and its depth can be verified in employment data around the railway stations.
| Centroid (1 km radius) | Establishments | Workers | Office Workers | Office share |
|---|---|---|---|---|
| Tokuyama Station (Shunan) | 1,978 | 15,527 | 2,976 | 19.2% |
| Shimonoseki Station (Shimonoseki) | 1,445 | 15,275 | 3,570 | 23.4% |
| Shin-Yamaguchi Station (Yamaguchi City) | 1,276 | 13,516 | 2,029 | 15.0% |
| Iwakuni Station (Iwakuni) | 1,232 | 10,486 | 1,583 | 15.1% |
| Hofu Station (Hofu) | 1,202 | 10,072 | 1,126 | 11.2% |
| Yuda Onsen Station (Yamaguchi City) | 797 | 9,176 | 1,482 | 16.2% |
| Ube-Shinkawa Station (Ube) | 753 | 7,161 | 1,587 | 22.2% |
Source: compiled by MetroEngines Research & Consulting from the Ministry of Internal Affairs and Communications / Ministry of Economy, Trade and Industry “Economic Census for Business Activity (2021)”; boundaries from the Ministry of Internal Affairs and Communications “2020 Population Census, small-area statistics” (e-Stat Statistical GIS). N=7 locations, 1 km radius, coverage good in all cases.
Source: compiled by MetroEngines Research & Consulting from the Ministry of Internal Affairs and Communications / Ministry of Economy, Trade and Industry “Economic Census for Business Activity (2021)”
Within 1 km of Tokuyama Station (Shunan), 1,978 establishments and 15,527 workers are concentrated — the largest scale among the prefecture’s major stations. Shimonoseki Station is almost level on worker count (15,275) and leads on office share at 23.4%, followed by Ube-Shinkawa at 22.2% and Tokuyama at 19.2%. Shin-Yamaguchi (15.0%) and Iwakuni (15.1%) clear 10,000 workers but carry a relatively low office share, reflecting a broader employment structure that includes manufacturing and logistics. Hofu Station sits at 11.2%, with a strong station-front retail and manufacturing character.
What matters here is that Tokuyama, Shimonoseki and Ube-Shinkawa — station catchments with an office share of around 20% and 7,000 to 15,000 workers — are precisely the areas where the ¥8,000–12,000 band is empty. The depth of office employment sets a partial ceiling on lodging rates. Corporate travel allowances are unlikely to be pinned at the ¥6,000s, and for travellers from outside the prefecture or from the Tokyo area, ¥8,000–10,000 is a standard range. Because no product sits in that band, demand flows into the existing ¥6,000-level inventory, producing high occupancy not only over holiday weeks but on weekdays too — that is the reading that follows.
Source: MetroEngines Research & Consulting (N=107 properties with 40 or more rooms and a confirmed estimated settled ADR)
Plotted on a map, the geographic skew in pricing is plain. Everything above ¥10,000 (navy) clusters in the north of the prefecture and on its islands — Hagi, Nagato and Suo-Oshima — while the belt along the Seto Inland Sea (Ube through Sanyo-Onoda, Hofu, Shunan, Kudamatsu, Hikari and Iwakuni) is filled almost entirely with the colours below ¥8,000. Only Shimonoseki and Yamaguchi City stand on the boundary between those two worlds.
Land values also qualify the industrial belt as investable. According to the 2026 official land price survey (Yamaguchi Prefecture), the average rate of change across 304 sites in 17 municipalities was +0.8% for commercial land (a third consecutive year of increase) and +0.7% for residential land (a fifth consecutive year), with an average commercial price of ¥64,100/m² and residential at ¥36,000/m². Against the three major metropolitan areas or Hiroshima and Fukuoka, land acquisition costs are an order of magnitude lower, so construction accounts for a larger share of total investment. In other words, an investment decision in Yamaguchi turns almost entirely on the relationship between construction cost and room rate, not on a view of land values.
The supply pipeline — 721 rooms across six major projects in 2026, five of them in the industrial belt
The market has already begun to respond to this gap. Sorting new openings confirmed on OTA listings by year, six projects stand out as the principal supply arriving in Yamaguchi in 2026.
| Opening year | Property | Location | Rooms | Locational character |
|---|---|---|---|---|
| 2026 | Toyoko Inn Ube-Shinkawa-eki | Ube | 207 rooms | Industrial belt, station-front |
| 2026 | APA Hotel (Yamaguchi Iwakuni-Ekimae-Nishi) | Iwakuni | 150 rooms | Industrial belt, station-front / the brand’s first property in Iwakuni |
| 2026 | Epoca Base Ube | Ube | 132 rooms | Industrial belt |
| 2026 | Hotel LiVEMAX Tokuyama Ekimae | Shunan | 99 rooms | Industrial belt, station-front |
| 2026 | Shimonoseki Osakaya Hotel | Shimonoseki | 88 rooms | Kanmon junction |
| 2026 | HOTEL R9 The Yard Hikari | Hikari | 45 rooms | Industrial belt |
| 2025 | Hotel Active! Shin-Yamaguchi Premier | Yamaguchi City | 194 rooms | Shinkansen station-front |
| 2025 | Risonare Shimonoseki | Shimonoseki | 187 rooms | Kanmon / strait sightseeing |
| 2025 | HOTEL R9 The Yard Iwakuni Kuga Inter | Iwakuni | 51 rooms | Expressway interchange |
| 2025 | HOTEL R9 The Yard Yamaguchi Ajisu | Yamaguchi City | 40 rooms | Arterial roadside |
Source: MetroEngines Research & Consulting (OTA-listing basis; drawn from 18 openings in 2025 and 12 in 2026 in Yamaguchi Prefecture, limited to those with 40 or more rooms) / APA Hotel press release (April 7, 2026)
* New-opening data is on an OTA-listing basis. Because listings typically appear some months before opening, counts for recent and future months will rise as further listings are added. Read the current figures as a floor for the confirmed pipeline. On planning data based on the Ministry of Land, Infrastructure, Transport and Tourism “Building Dynamics Statistics Survey”, only one qualifying large hotel project in Yamaguchi Prefecture was captured at the time of the survey — 190 rooms in the Arcaport district of Shimonoseki, completing in December 2025 — and that figure, too, rests on building-permit filings and will rise with further applications.
What stands out is the geographic concentration of that supply. Of the 721 rooms across six major 2026 projects, five projects and 633 rooms land in the four industrial-belt cities of Ube, Iwakuni, Shunan and Hikari. Brand debuts are also arriving in succession: APA Hotel (Yamaguchi Iwakuni-Ekimae-Nishi), which pre-opened in June 2026, is the first APA Hotel in Iwakuni and the brand’s second property in Yamaguchi Prefecture after Hofu. Toyoko Inn Ube-Shinkawa-eki likewise takes a station-front site within walking distance of Ube-Shinkawa Station.
All of these, however, add depth to the existing ¥6,000–8,000 band; none fills the ¥8,000–12,000 band. Supply is growing, yet the price-band gap remains exactly that — a gap. For a new entrant this reads, if anything, as favourable: existing players keep cultivating area awareness and the pool of business demand, while competition in the band above remains thin.
Development scenarios — the 100-room upper-midscale build fits best, at a 6.3–7.2% yield
The reading so far can be put into numbers as a development scenario. The assumed site is a station-front location in the Seto Inland Sea industrial belt (Shunan, Ube or Iwakuni), 1,200 m², with land acquisition priced at the prefecture’s 2026 official average for commercial land of ¥64,100/m².
| Item | A. Economy, rate held | B. Upper-midscale recommended | C. Upscale |
|---|---|---|---|
| Rooms | 90 rooms | 100 rooms | 70 rooms |
| Area per room | 18㎡ | 22㎡ | 30㎡ |
| Assumed estimated settled ADR (tax-exclusive equivalent) | ¥6,500 | ¥10,000 | ¥16,000 |
| Assumed occupancy | 84% | 82% | 75% |
| Guest-room floor ratio | 68% | 65% | 60% |
| Construction unit cost (2025 actual) | ¥2.026m/tsubo | ¥2.026m/tsubo | ¥2.405m/tsubo |
| Construction cost (2025 actual basis) | ¥1.46bn | ¥2.07bn | ¥2.55bn |
| Land acquisition cost | ¥77m | ¥77m | ¥77m |
| Total investment (2025 actual basis) | ¥1.54bn | ¥2.15bn | ¥2.62bn |
| Annual revenue (rooms + ancillary) | ¥206m | ¥344m | ¥353m |
| GOP margin | 50% | 45% | 38% |
| GOP | ¥103m | ¥155m | ¥134m |
| GOP yield (2025 actual basis) | 6.7% | 7.2% | 5.1% |
| Construction cost (after construction-period inflation) | ¥1.69bn | ¥2.40bn | ¥2.95bn |
| Total investment (after inflation) | ¥1.77bn | ¥2.48bn | ¥3.02bn |
| GOP yield (after inflation) | 5.8% | 6.3% | 4.4% |
| Simple payback period (after inflation) | 17.1 years | 16.0 years | 22.6 years |
Sources: construction unit cost = 2025 actuals based on the Ministry of Land, Infrastructure, Transport and Tourism “Building Construction Starts Statistics” (RC ¥2.026m/tsubo, S-frame ¥2.405m/tsubo) / construction-period inflation = Turner & Townsend forecast (+5.3% in 2026, +5.0% in 2027) and this article’s assumption (+4.5% from 2028, compounded to the construction midpoint for a 1.157x factor) / land unit price = 2026 official land price survey, Yamaguchi Prefecture commercial land average ¥64,100/m² / ADR and occupancy assumptions = MetroEngines Research & Consulting. This is a simplified calculation; an actual investment decision requires a detailed feasibility study.
Scenario A simply traces the existing price band. Construction cost is contained, so the GOP yield of 6.7% (5.8% after inflation) is not bad, but of the belt’s 5,811 business-hotel rooms, 50 properties and 5,363 rooms sit below ¥8,000 — the thickest competition of any band — so demand can be captured while the scope for rate upside stays small. Scenario C targets the band above, at 30 m² and ¥16,000, but the construction unit cost of an S-frame, high-specification build and the 75% occupancy assumption both weigh heavily, leaving the yield at 5.1% (4.4% after inflation).
The best fit is Scenario B. On assumptions of 22 m², 100 rooms, an estimated settled ADR of ¥10,000 and 82% occupancy, the GOP yield is 7.2% (6.3% once construction-period inflation is priced in). An ADR of ¥10,000 sits inside the actual range of the three existing properties within the belt (¥8,000–11,700), and 82% occupancy is set 4 points more conservatively than the 86.6% three-month average for business hotels in the prefecture. Because the assumptions stay within the range of existing results, the scenario is more achievable than A or C.
| Scenario B sensitivity | Base case | ADR -10% | Occupancy -5pt | Both |
|---|---|---|---|---|
| Estimated settled ADR | ¥10,000 | ¥9,000 | ¥10,000 | ¥9,000 |
| Occupancy | 82% | 82% | 77% | 77% |
| Annual revenue | ¥344m | ¥310m | ¥323m | ¥291m |
| GOP | ¥155m | ¥139m | ¥145m | ¥131m |
| GOP yield (2025 actual basis) | 7.2% | 6.5% | 6.8% | 6.1% |
| GOP yield (after inflation) | 6.3% | 5.6% | 5.9% | 5.3% |
Source: MetroEngines Research & Consulting (assumptions identical to the table above)
Even in the most conservative case, cutting ADR by 10% and occupancy by 5 points at the same time, the GOP yield holds at 6.1% (5.3% after inflation). Because land acquisition in the industrial belt accounts for only about 3–4% of total investment, downside resilience is structurally high. Put the other way round, investment risk in this area is concentrated almost entirely in construction-cost inflation. Construction costs running 10% above assumption would lower the yield by roughly 0.6 points.
| ADR ¥8,000 | ADR ¥9,000 | ADR ¥10,000 | ADR ¥11,000 | ADR ¥12,000 | |
|---|---|---|---|---|---|
| Assumed occupancy 74% | 4.5% | 5.1% | 5.6% | 6.2% | 6.8% |
| Assumed occupancy 78% | 4.8% | 5.4% | 5.9% | 6.5% | 7.1% |
| Assumed occupancy 82% | 5.0% | 5.6% | 6.3% BASE | 6.9% | 7.5% |
| Assumed occupancy 86% | 5.2% | 5.9% | 6.6% | 7.2% | 7.9% |
| Assumed occupancy 90% | 5.5% | 6.2% | 6.9% | 7.6% | 8.2% |
Source: MetroEngines Research & Consulting (assumptions identical to Table 8, Scenario B: 100 rooms, 65% guest-room floor ratio, ancillary revenue at 15% of room revenue, 45% GOP margin, total investment ¥2.48bn after construction-period inflation). Navy = BASE case at 6.3% or above, pale blue = most conservative case, 5.3% to 6.3%, white = below 5.3%.
On two axes, the conditions under which Scenario B works become clear. Holding the BASE case of 6.3% broadly requires one of ADR ¥10,000 × 82% occupancy, ADR ¥11,000 × 78% occupancy, or ADR ¥12,000 × 74% occupancy. Conversely, drop ADR to ¥8,000 — the same level as the existing business band — and even pushing occupancy to 90% reaches only 5.5%, pinned to the most conservative case. This project is decided by rate, not by occupancy — which is precisely the reason to go after the upper-midscale band.
| Risk factor | Rating | Substance and direction of response |
|---|---|---|
| Construction-cost inflation | High | A structure in which construction accounts for more than 96% of total investment. Bringing the construction start forward, standardising specifications and shortening the build period have the greatest effect on yield. At the same time, rising construction costs suppress new supply overall, which is an upside factor for existing and early-moving projects in the form of an easier competitive environment. |
| Acceptance of the rate band | Medium | Three properties within the belt already achieve ¥8,000–11,700, establishing precedent. That said, corporate travel allowances set a ceiling on rates, so corporate sales and price design need to be built together. |
| Demand volatility | Low | Prefecture-wide monthly ADR moves within -10% to +16%, so seasonality is small and business demand is levelled across the year. At holiday peaks, inventory is exhausted more than a month in advance. |
| Competing supply | Medium | In 2026, 633 rooms arrive across four industrial-belt cities, but all sit in the ¥6,000–8,000 band. Competition in the ¥8,000–12,000 band is expected to stay limited. |
| Land acquisition | Low | Acquisition costs are low, with commercial land averaging ¥64,100/m², and account for 3–4% of total investment. Land values have risen for three consecutive years, but the rate of change is a gentle +0.8%. |
Sources: MetroEngines Research & Consulting / Ministry of Land, Infrastructure, Transport and Tourism “Official Land Price Survey (2026)” / Ministry of Land, Infrastructure, Transport and Tourism “Building Construction Starts Statistics”
Conclusion — Yamaguchi’s headroom is in the band above
Breaking Yamaguchi’s lodging market down to the granularity of 14 municipalities, 158 properties and 12,989 rooms brings three things into view.
First, the price tiers within the prefecture span 3.7x, with the top end carried by the tourism assets of Hagi, Nagato and Suo-Oshima and the bottom by business demand in the Seto Inland Sea industrial belt. Second, the ¥8,000–12,000 band between them is thin — 13.8% on a room basis among business hotels, and just 7.7% within the industrial belt. Third, the demand side is not weak: estimated OCC for business hotels is 86.6% (May–July 2026 average, N=85 properties), and at holiday peaks several properties reached sell-out at LT33–35.
Overlay the three and Yamaguchi’s headroom turns out to lie not in “opening up a new area” but in “placing product one price band higher in areas that already have demand”. Put a product of roughly 22 m², 100-room scale and an estimated settled ADR in the ¥10,000s into the station catchments of Tokuyama, Shimonoseki and Ube-Shinkawa, where office employment is concentrated at 7,000 to 15,000 workers. On these calculations the GOP yield holds at 6.3% even after construction-cost inflation is priced in, and 5.3% under the most conservative assumptions.
Yamaguchi City, whose representative figure stops at ¥8,200 despite hosting Yuda Onsen, sits on the same logic. It is a city where the ryokan segment alone achieves ¥15,400, and what is missing is the middle ground between the business band and the hot-spring band — a non-ryokan product at ¥12,000–20,000 and 40 to 90 rooms. Of anywhere in the prefecture, this is the city with the raw material but no product.
Yamaguchi has been a prefecture that struggles to enter an investor’s field of view. Land is cheap, the market is unshowy, and there is no pronounced peak. Turn those characteristics over, though, and they also mean small land risk, small seasonal variation, and a price-band gap that has been left open for a long time. On the investment map of the Chugoku region, Yamaguchi is still unshaded territory.
⚠ A note on the data: The estimated settled ADR in this article covers confirmed months only (August 2025 to July 2026). Listed prices for future months are a snapshot of the selling prices published on OTAs at the time of the survey and move as check-in approaches, so they are excluded from this analysis. Because remaining-room signals are observed from data on and after March 10, 2026, conditions before LT54 cannot be traced for May 2026 check-ins. Actual sell-outs may have come earlier than the lead times shown here.
Related reading
- Yamaguchi’s 4-Tier Hotel Market — prices and white space across Shimonoseki, Yuda Onsen, Iwakuni and Akiyoshidai/Nagatoyumoto
- Yamaguchi Settled ADR H1 2026: Business +3.4%, City Hotels −6.4%
- Yamaguchi DC 2026: rates are already moving — October to December read through monthly curves and booking pace by municipality
- Miyazaki and Saga hotel investment white space — the price-band structure of two prefectures read through ADR × early sell-out LT
- Inside Hiroshima’s 1,003 rooms opening in 2026 — supply skewed to large business hotels, and an estimated settled ADR that turned in June
- Shiga hotel development: 2026 new supply at 1.5% of existing stock — the price band open in the business segment, and a yield calculation
References and Sources
■ Data sources
Estimated settled ADR, estimated OCC, remaining-room trajectories and new openings are compiled by MetroEngines Research & Consulting (14 municipalities in Yamaguchi Prefecture, 158 properties, 12,989 rooms; ADR covers the confirmed months of August 2025 to July 2026, OCC covers May–July 2026). Land values, construction unit costs, tourism statistics and corporate location data are from the Ministry of Land, Infrastructure, Transport and Tourism, the Ministry of Internal Affairs and Communications, Yamaguchi Prefecture and published materials from the companies concerned.
■ Calculation assumptions
The development scenarios assume a 1,200 m² site at a land unit price of ¥64,100/m² (2026 official land price survey, Yamaguchi Prefecture commercial land average), guest-room floor ratios of 68/65/60%, construction unit costs of ¥2.026m/tsubo for RC and ¥2.405m/tsubo for S-frame (2025 actuals), construction-period inflation compounded at 1.157x to the construction midpoint, ancillary revenue at 15% of room revenue, and GOP margins of 38–50% applied by property type. The sensitivity analysis holds these assumptions fixed and moves only ADR and occupancy.
■ Limitations and caveats
ADR and OCC are estimates based on OTA published prices and sales inventory, not each property’s actual results (the median error against property-level disclosures by listed hotel REITs is about 7%). Future months are not included in the counts. Because remaining-room observations rest on data from March 10, 2026 onward, earlier lead times cannot be traced retrospectively. The development scenarios are representative calculations; an investment decision on an individual project requires a detailed feasibility study.
■ Market data
- MetroEngines Research & Consulting — estimated settled ADR (14 municipalities in Yamaguchi Prefecture, 158 properties), estimated occupancy (OCC), remaining-room trajectories and sell-out observations, new openings (OTA-listing basis)
■ Government statistics and public data
- Yamaguchi Prefecture, “Results of the 2026 Official Land Price Survey (Yamaguchi Prefecture)” (commercial land +0.8%, average ¥64,100/m²; residential land +0.7%, average ¥36,000/m²; 304 sites across 17 municipalities)
- Ministry of Internal Affairs and Communications / Ministry of Economy, Trade and Industry, “Economic Census for Business Activity (2021)”; boundaries from the Ministry of Internal Affairs and Communications “2020 Population Census, small-area statistics” (e-Stat Statistical GIS)
- Ministry of Land, Infrastructure, Transport and Tourism, “Building Construction Starts Statistics” (actual construction unit costs) / Ministry of Land, Infrastructure, Transport and Tourism, “Building Dynamics Statistics Survey” (planning pipeline)
- Yamaguchi Prefecture, “Tourist Movement Survey / 2024 Tourism Trends Survey” (record-high foreign overnight stays)
- Japan Tourism Agency, “Overnight Travel Statistics Survey”
■ News and press releases
- APA Hotel Co., Ltd., “APA Hotel debuts in Iwakuni, Yamaguchi Prefecture: APA Hotel (Yamaguchi Iwakuni-Ekimae-Nishi) opens June 5, 2026” (April 7, 2026)
- APA Hotel Co., Ltd., “Second property in Yamaguchi Prefecture: APA Hotel (Yamaguchi Iwakuni-Ekimae-Nishi) pre-opens today” (150 rooms, pre-opened June 5, 2026)
- Toyoko Inn Ube-Shinkawa-eki property information
- Kampu Ferry Co., Ltd. official site (Shimonoseki–Busan scheduled route)
- City of Shimonoseki, “Shimonoseki Port, Korea ferry route”
- Yamaguchi Shimbun, “Official land prices: residential up for a fifth straight year, commercial for a third / Yamaguchi Prefecture”
■ Investment assumptions
- Construction cost per tsubo = 2025 actuals (RC ¥2.026m/tsubo, S-frame ¥2.405m/tsubo)
- Construction-period inflation = Turner & Townsend construction market forecast (+5.3% in 2026, +5.0% in 2027) / +4.5% from 2028 on this article’s assumption
- GOP margin = the general range for limited-service lodging (38–50%), applied by property type