

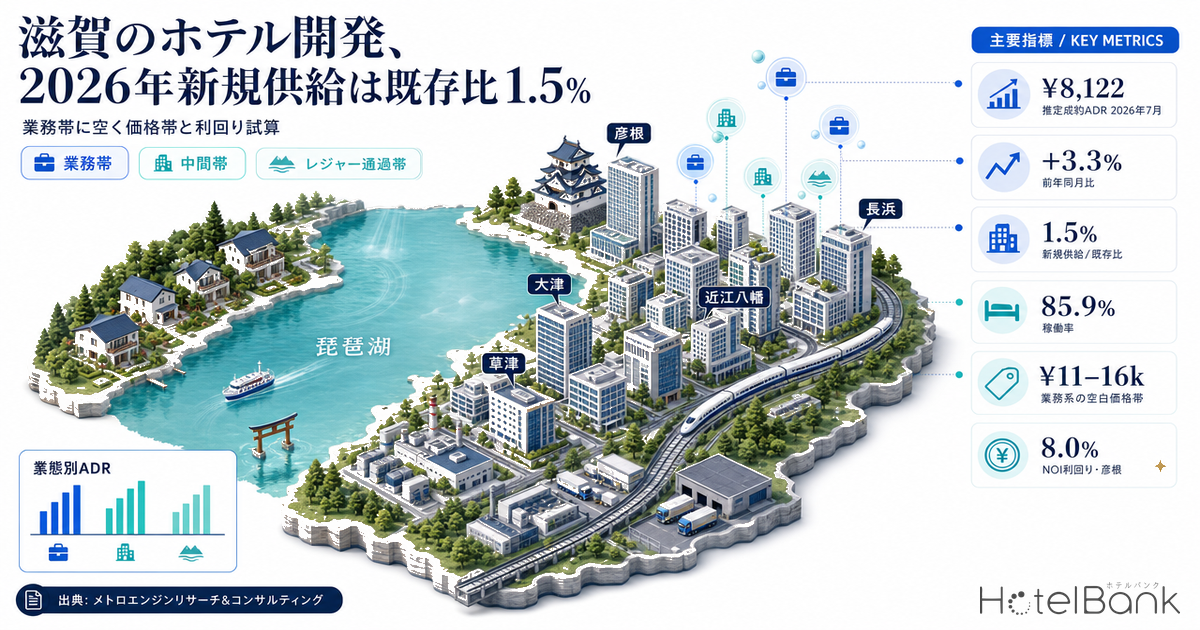
Shiga Prefecture’s accommodation market has been moving in the opposite direction to its neighbours since the start of 2026. The settled-ADR estimate compiled by MetroEngines Research (July 2026, N=160 properties) was up 3.3% year on year. In the same month Kyoto was down 12.8%, Osaka down 30.7% and Hyogo down 3.0% — of the six prefectures that make up the Kinki region, Shiga was the only one above its year-earlier level. New supply, meanwhile, has barely moved. Business-hotel openings in 2026 amount to two properties and 91 rooms, just 1.5% of the existing stock of 75 properties and 6,030 rooms. This article identifies where — in which areas and at which price points — this combination of “rising rates, frozen supply” shows up as an investment opportunity, using employment data, inventory sell-through data and land prices.
Where this article sits: HotelBank’s earlier Shiga coverage has looked at search demand and leisure dispersion (Shiga #2 in Summer Search Growth) and at revenue management (the ADR split by property category), but no piece has been published in the investment & development category. Rather than treating Shiga as “the overflow catchment for Kyoto,” this article takes as its subject the weekday business demand generated by inland manufacturing and logistics clusters, and the imbalance in supply by property category that is meant to absorb it.
Metric Definitions Used in This Article
- ADR (average daily rate): an estimated settled rate (tax-exclusive equivalent) calculated by applying a category-specific adjustment coefficient to the lowest published plan level each property lists on OTAs (double occupancy, per-room rate, tax-inclusive). Cross-checked against the property-level results disclosed by listed hotel REITs, the median error is 6.6%. It is an estimate and differs from each property’s actual transacted rates and accounting figures. Area-level ADR is the median across the covered properties (the level of a typical property in that area).
- Listed price: the average of all plans published on OTAs (room-only through to plans with meals; double occupancy, per-room, tax-inclusive). Because it is measured on a different basis from the ADR above, it is labelled “listed price” wherever it appears in the text.
- OCC (occupancy): sold rooms as a share of total rooms in the area (an estimate based on OTA sales inventory). It is derived from how OTA-distributed inventory is being taken up, and differs from a property’s true overall occupancy.
- LT (lead time): days remaining until check-in. LT0 = same day. Early sell-out LT = the lead time at which remaining rooms first reached zero (a higher value means it sold out earlier). Sell-out observation days = the cumulative number of days on which zero remaining rooms were observed.
- Data source: MetroEngines Research & Consulting
- — The settled-ADR estimate rose 3.3% year on year in July 2026 (¥8,122, N=160 properties). Shiga was the only one of the six Kinki prefectures above its year-earlier level.
- — Business-hotel supply added in 2026 comes to two properties and 91 rooms, or 1.5% of the existing 75 properties and 6,030 rooms. On a room-count basis, meaningful supply additions have all but stopped.
- — The prefecture splits into three layers — a business belt, a middle zone and a leisure/through-traffic belt. The business belt (80 covered properties) posts a settled-ADR estimate of ¥7,883, up 6.1% year on year, ahead of the prefecture as a whole.
- — Three stations have more workers than residents within 1 km of the station: Nagahama, Hikone and Otsu. Weekday early sell-outs were observed at mid- to large-sized properties in Hikone, Konan and Omihachiman.
- — Only two properties in the prefecture achieve a settled-ADR estimate above ¥11,000 in a business location. A 100-room development in Hikone pencils out at an 8.0% NOI yield on 2025 construction costs.
New Supply Is 1.5% of Existing Stock — Frozen Supply Leaves Room for Investment
Start with supply. Within the scope MetroEngines Research tracks, two business hotels totalling 91 rooms opened in Shiga in 2026 (confirmed via OTA listings): 47 rooms in January and 44 rooms in April. Against the existing 75 properties and 6,030 rooms, that is 0.8% and 0.7% respectively, or 1.5% combined. Ryokan added one property and one room against an existing 60 properties and 967 rooms (0.1%); guesthouses added three properties and nine rooms against six properties and 29 rooms; whole-house rentals added three properties and three rooms against five properties and 21 rooms; and cottages added one property and one room against four properties and 26 rooms.
In other words, the only meaningful supply addition in Shiga on a room-count basis is the 91 business-hotel rooms — and even that is 1.5% of existing stock. Set against a national hotel supply-growth rate of 1.5-1.7% (JLL, held down by construction-cost inflation), Shiga sits within the same low-supply band as the country as a whole. For incumbents that means a stable competitive environment; for anyone weighing entry it means the market remains one where no first mover has staked a claim.
To check where this frozen supply is heading, we also referenced planning data based on the Ministry of Land, Infrastructure, Transport and Tourism (MLIT) Building Construction Dynamics Statistics Survey. Because building confirmation applications are normally filed one to two years before opening, however, counts for future years are structurally undercounted. They should be read as a floor for the confirmed pipeline as it stands today; property and room counts are likely to rise as further applications are filed.
The Only Kinki Prefecture Above Last Year — Seven Straight Positive Months in H1 2026
Now to pricing. Shiga’s settled-ADR estimate for July 2026 was ¥8,122 (N=160 properties), against ¥7,866 (N=163 properties) a year earlier — up 3.3%. Tracking H1 2026 month by month: January +10.9%, February +4.5%, March +4.8%, April +0.6%, May +2.6%, June +1.7% and July +3.3%. All seven months were above the year-earlier level. This is a sustained trend, not a single-month blip.
Lining up the same July 2026 across the six Kinki prefectures, Shiga was the only one above last year. Kyoto came in at ¥12,161 (−12.8% YoY, N=604 properties), Osaka at ¥8,761 (−30.7%, N=647), Hyogo at ¥12,027 (−3.0%, N=545), Nara at ¥10,395 (−13.3%, N=131) and Wakayama at ¥9,218 (−3.0%, N=218). Osaka’s sharp correction includes the payback from large-event demand in 2025, and the declines in Kyoto and Nara likely reflect the same shift in how demand is distributed across the wider region. That Shiga alone sits above last year suggests its demand originates somewhere other than wide-area tourism events.
Breaking the figures down by property category shows what is driving the increase. Settled-ADR estimates for July 2026 were ¥7,425 for business hotels (+4.5% YoY, N=82 properties), ¥12,389 for city hotels (+0.4%, N=12), ¥23,632 for resort hotels (+7.7%, N=11) and ¥13,134 for ryokan (−5.9%, N=54). Both business hotels, which carry the weight of property numbers, and resort hotels, which carry the highest rates, are growing.
| Category | Settled ADR est. July 2026 | YoY | Properties covered | Occupancy (est.) July 2026 | Existing rooms |
|---|---|---|---|---|---|
| Business hotel | ¥7,425 | +4.5% | 82 | 85.9% | 6,030 rooms (75 properties) |
| City hotel | ¥12,389 | +0.4% | 12 | 82.0% | — |
| Ryokan | ¥13,134 | −5.9% | 54 | 88.0% | 967 rooms (60 properties) |
| Resort hotel | ¥23,632 | +7.7% | 11 | 93.1% | — |
Splitting the Prefecture into Three Layers — Rate Structures Differ Across Business, Middle and Leisure Belts
Treating Shiga as a single market misreads its structure. Geography and industry divide it cleanly into three layers. First, the business belt of Konan and Koto (Kusatsu, Ritto, Moriyama, Yasu, Konan, Higashiomi, Hikone, Omihachiman and Koka). The Meishin and Shin-Meishin expressways, National Route 1 and the Tokaido Main Line run through it, and inland manufacturing and logistics cluster there. Second, the leisure and through-traffic belt of Kosai and Kohoku (Takashima, Nagahama, Maibara and Taga), driven by lakeside resorts and hot springs plus traffic heading for the Hokuriku region. Third, Otsu sits between the two: as the prefectural capital it carries office demand alongside leisure demand from Ogoto Onsen and Mount Hiei.
Laying out the numbers layer by layer shows how differently listed prices and settled-ADR estimates relate to each other. In Takashima, in the leisure/through-traffic belt, the listed price of ¥32,065 (84 listed properties) is the highest in the prefecture, yet the settled-ADR estimate of ¥6,786 (N=13 properties) is among the lowest. That is because much of Takashima’s listed inventory consists of whole-house rentals, pensions and cottages, which fall outside the five categories covered by the settled-ADR estimate (business, city, resort, ryokan and capsule). It is a textbook case of a high listed price not translating into a high achieved rate.
| Layer | Municipality | Listed properties | Listed price July 2026 | Settled ADR est. July 2026 | Properties covered | YoY |
|---|---|---|---|---|---|---|
| Business | Hikone | 30 | ¥18,622 | ¥9,124 | 20 | +14.0% |
| Business | Kusatsu | 11 | ¥17,840 | ¥8,125 | 11 | +1.1% |
| Business | Ritto | 5 | ¥15,676 | ¥8,050 | 2 | +9.4% |
| Business | Moriyama | 9 | ¥15,310 | ¥8,120 | 5 | −10.2% |
| Business | Koka | 20 | ¥33,558 | ¥7,678 | 14 | +7.5% |
| Business | Omihachiman | 21 | ¥22,652 | ¥7,190 | 11 | −7.6% |
| Business | Higashiomi | 16 | ¥19,387 | ¥6,938 | 9 | +20.5% |
| Business | Konan | 7 | ¥14,378 | ¥6,936 | 6 | +9.8% |
| Business | Yasu | 3 | ¥16,738 | ¥5,720 | 2 | +0.3% |
| Middle | Otsu | 75 | ¥24,034 | ¥9,668 | 34 | −10.0% |
| Leisure | Nagahama | 49 | ¥30,875 | ¥10,086 | 24 | +12.8% |
| Leisure | Takashima | 84 | ¥32,065 | ¥6,786 | 13 | +7.5% |
| Leisure | Maibara | 11 | ¥22,639 | ¥6,538 | 2 | −11.0% |
| Leisure | Taga | 2 | ¥26,279 | ¥6,269 | 1 | −19.5% |
Within the business belt the highest rate is Hikone at ¥9,124, and its +14.0% year-on-year increase is also among the largest. Kusatsu (¥8,125), Ritto (¥8,050) and Moriyama (¥8,120) — the three cities along the Tokaido Main Line — sit at broadly the same level. Konan (¥6,936), Higashiomi (¥6,938) and Yasu (¥5,720) are close to industrial parks and their rates are the lowest within the business belt. Higashiomi (+20.5%) and Konan (+9.8%), however, rank near the top on growth. They are improving from a low base, which makes them worth watching in terms of headroom on price.
Identifying Business Districts by the Worker-to-Resident Ratio — Hikone, Nagahama and Otsu Have More Workers Than Residents
To quantify the depth of business demand, we pulled employment data within a 1 km radius of the prefecture’s main stations (Economic Census for Business Activity, Ministry of Internal Affairs and Communications / Ministry of Economy, Trade and Industry) alongside resident population for the same 1 km radius (MLIT National Land Numerical Information, projected population by 250 m mesh). All eight stations are covered in the data (coverage verified), so there is no undercounting from missing records.
Three stations turned out to have more workers than residents within 1 km — the “more people work here than live here” pattern: Nagahama (12,261 workers / 11,792 residents, ratio 1.04), Hikone (7,977 / 7,745, 1.03) and Otsu (14,362 / 14,102, 1.02). By contrast Kusatsu is at 0.45, Moriyama at 0.37 and Minami-Kusatsu at 0.35, with residents far outnumbering workers. Kusatsu, Moriyama and Minami-Kusatsu are residential and university locations with dense housing; on the measure of employment density within 1 km of the station, they are hard to call business districts.
| Station | Establishments (1 km radius) | Workers (1 km radius) | Office-type share | Residents 2025 est. (1 km radius) | Workers / residents | 2040 population change | Type |
|---|---|---|---|---|---|---|---|
| Nagahama | 1,285 | 12,261 | 8.8% | 11,792 | 1.04 | -18.8% | Business core |
| Hikone | 863 | 7,977 | 14.2% | 7,745 | 1.03 | -11.3% | Business core |
| Otsu | 1,238 | 14,362 | 27.3% | 14,102 | 1.02 | -3.8% | Business core |
| Omihachiman | 695 | 5,777 | 10.2% | 10,198 | 0.57 | -6.3% | Mixed business/residential |
| Ritto | 533 | 4,994 | 12.2% | 9,715 | 0.51 | +1.2% | Mixed business/residential |
| Kusatsu | 878 | 10,796 | 9.9% | 23,946 | 0.45 | +6.2% | Primarily residential |
| Moriyama | 789 | 8,094 | 10.7% | 21,944 | 0.37 | +5.5% | Primarily residential |
| Minami-Kusatsu | 334 | 5,160 | 3.6% | 14,814 | 0.35 | +3.2% | Primarily residential |
On the share of office-type workers, Otsu stands out at 27.3%, concentrating office demand from the prefectural government, local financial institutions and branch offices. Hikone follows at 14.2% and Ritto at 12.2%. Nagahama, at 8.8%, and Minami-Kusatsu, at 3.6%, are low, indicating that their workforces lean towards manufacturing, retail and services. A location such as Nagahama, with a low office share but a large total workforce, is more likely to see business travellers coming for plant and on-site work rather than head-office meetings — a different character of accommodation demand.
What matters here is combining this with the 2040 population projection. Within 1 km of Nagahama station the projection is −18.8%, and around Hikone station −11.3%: resident populations are set to fall. Yet workers already outnumber residents today. That is a structure of “fewer people living in the town, but people still commuting in to work,” which means business demand is relatively more durable than leisure-led accommodation demand. Conversely, the areas around Kusatsu (+6.2%) and Moriyama (+5.5%) stations are projected to gain residents, so accommodation demand tied to residency — extended stays, family visits, university entrance exams — may accumulate there instead.
Prefecture-wide industrial trends support this. According to METI’s Factory Location Trend Survey, there were 22 factory sitings in Shiga in 2025, two more than the previous year and a second consecutive annual increase against a declining national trend. Site area came to roughly 500,994 m2, up 18,272 m2 year on year. By region, Konan and Koto led with seven each, followed by Higashiomi with four, Kohoku with three and Koka with one. By industry, fabricated metal products led with five, followed by food manufacturing, textiles and production machinery with three each. The concentration falls precisely in Konan and Koto — the area this article defines as the business belt.
Geographic Imbalance in Supply — Property Counts in the West, Room Counts in the East
Mapping the distribution of supply shows that property counts and room counts do not line up. Takashima, on the western shore, has the largest number of properties in the prefecture, but most are small whole-house rentals, pensions and cottages. The business-belt cities of Hikone, Kusatsu and Ritto have fewer properties but a much larger room count per property. The map below plots the 127 properties with 20 or more rooms across the four main categories (business hotels, city hotels, resort hotels and ryokan).
Demand Differs in Kind — Business Hotels Build Over 90 Days on Weekdays, Ryokan Spike Late
Next, when demand actually books. Taking two settled past dates — Wednesday 8 July 2026 and Saturday 11 July 2026 — we compared booking curves (occupancy by lead time) for business hotels and ryokan in the prefecture.
On the Wednesday, business hotels (75 properties, 6,593 rooms) had already reached 60.8% occupancy at LT90 (estimated for 8 July 2026 check-ins; 2,586 rooms remaining), then filled gradually to 66.3% at LT30, 71.7% at LT14 and 85.4% at LT1 (963 rooms remaining). Roughly 25 points accumulate over 90 days — a two-stage demand structure in which corporate contracts and early business-trip bookings lock in inventory well ahead, with a further tranche arriving close in.
Ryokan (39 properties, 888 rooms) on the Wednesday look quite different: 64.5% at LT90, 63.1% at LT45 and 67.3% at LT21 — essentially flat to LT21 — then a sharp climb from LT14 onward, 71.7% to 74.2% (LT7) to 86.7% (LT1). Weekday ryokan demand is a last-minute decision; 90 days out, almost nothing has sold. Saturday (44 properties, 1,071 rooms) starts at a similar level, 67.9% at LT90, but runs consistently higher than weekdays thereafter: 72.5% at LT45, 82.4% at LT7 and 91.7% at LT1.
From an investment standpoint the implication is clear. Entering the business belt with a business-hotel product means the base occupancy underpinning revenue forecasts is already visible 90 days out, so the business plan carries relatively high confidence. Entering the leisure belt with a ryokan or resort product means revenue hinges on how precisely last-minute demand is captured, so the quality of the revenue-management operation widens the dispersion of investment returns considerably.
Positioning Analysis — All 40 Business Properties Sit at or Below a ¥12,600 Settled-ADR Estimate
Next we match price against supply and demand at the individual property level. For business hotels in the prefecture we pulled inventory sell-through data for four settled weekdays (Monday to Thursday, 8-11 June 2026). Restricting to properties whose OTA-released allocation is at least 30% of total rooms, 78 of the 131 covered properties had observation data and 51 passed the filter. Of those, the 40 properties for which a settled-basis ADR estimate was available for the most recent six months (February to July 2026) were plotted with the settled-ADR estimate on the horizontal axis and the average early sell-out LT across the four weekdays (the mean lead time at which remaining rooms first hit zero) on the vertical.
The result is unambiguous. All 40 properties fall at or below a ¥12,600 settled-ADR estimate; only two exceed ¥11,000 and only three exceed ¥10,000. At the top is a 362-room converted resort-type property in Nagahama at ¥12,592, followed by a 126-room property in Omihachiman at ¥11,618 and a 129-room property in Hikone at ¥10,924. The remaining 37 properties fall below ¥10,000, with the modal band at ¥6,500-¥8,500. Meanwhile, in the same prefecture, ryokan as a category reach a settled-ADR estimate of ¥13,134, city hotels ¥12,389 and resort hotels ¥23,632.
This is where the gap lies. There is effectively no accommodation-led product in the prefecture that sits in a business location and achieves a settled-ADR estimate of ¥11,000-¥16,000. Of the two properties above ¥11,000, the higher is a conversion from a resort format, leaving just one pure business or select-service property aimed primarily at business demand above ¥11,000. Since ryokan and city hotels already clear the ¥12,000 mark, it is not that Shiga’s accommodation demand will not pay this rate. The price point exists; there is simply no product at that price point in a business location. For a comparable reading of price-band structure in other prefectures using the same ADR x early sell-out LT framework, see Miyazaki & Saga Hotel Investment Whitespace.
The depth of demand is also visible. The fastest sell-out over the four weekdays was a 245-room hotel at the east exit of Hikone station: an average early sell-out LT of 26.8 days, sell-outs observed on all four days and 71 cumulative sell-out observation days. As noted above, the 1 km radius around Hikone station is a business core where workers outnumber residents, and demand is deep enough for a property of this size to fill four weeks ahead on weekdays. Similarly, a 129-room property in Konan recorded an average early sell-out LT of 22.5 days over 25 cumulative days, and a 126-room property in Omihachiman 15.2 days over 19 days — mid- to large-sized properties in the business belt selling out early on weekdays. All of them carry settled-ADR estimates in the ¥7,200-¥11,600 range.
Crowded Where the market already is
Settled-ADR estimate ¥5,000-¥10,000 x business location
35 of the 40 properties cluster in this band. National chain limited-service hotels dominate, leaving little room for a new entrant to differentiate.
WS1 Upper economy in a business location
Settled-ADR estimate ¥11,000-¥16,000 x business location
Just two properties qualify. Ryokan (¥13,134) and city hotels (¥12,389) already clear this level, so willingness to pay exists in the market.
WS2 Mid-sized weekday-oriented product
100-150 rooms x Koto and Konan
The size band where early weekday sell-outs were observed in Hikone, Konan and Omihachiman. Existing properties of this size stay within ¥7,200-¥11,600.
Note: the inventory sell-through data in this section covers only properties whose OTA-released allocation is at least 30% of total rooms. Properties with a small released allocation may be running channels centred on direct booking, call centres, travel agents or corporate contracts; may be adding inventory as check-in approaches; or may have a low contractual OTA allocation. These cannot be distinguished from OTA data alone, so such properties are excluded. A low remaining-room count also means “rooms remaining within the OTA-released allocation” and does not mean the property as a whole is full.
Land Costs — Kusatsu Commercial Land Up 6.84%, Hikone Up 0.75%, a Threefold Price Gap
Now the land prices that set the entry cost. According to MLIT’s Published Land Prices (2026), the average for commercial land in Shiga is ¥117,009/m2 (¥386,806 per tsubo), up 2.80% year on year. By municipality, Kusatsu stands out at ¥241,222/m2 (+6.84%), followed by Otsu at ¥179,490/m2 (+5.03%), Moriyama at ¥133,800/m2 (+4.80%), Ritto at ¥99,650/m2 (+4.02%) and Hikone at ¥81,110/m2 (+0.75%). The gap between Kusatsu and Hikone is roughly 3.0x.
Commercial land in Kusatsu has been accelerating: ¥210,277/m2 (+3.61%) in 2024, ¥222,766/m2 (+4.06%) in 2025 and ¥241,222/m2 (+6.84%) in 2026. The highest-priced point near the station is 80 m from Kusatsu station at ¥510,000/m2 (+11.84%), zoned commercial with an 80% building coverage ratio and 600% floor area ratio. Hikone, by contrast, is flat at +0.75% for commercial land, which makes it considerably more attractive on land acquisition cost. As established in the previous section, the 1 km radius around Hikone station is a business core where workers outnumber residents, and early weekday sell-outs have been observed there. That combination — strong demand indicators with land prices standing still — raises Hikone’s relative standing within the business belt.
Development Scenario — The ADR and Yield That Work for 100 Rooms in a Business Location
We model the economics of entering the identified whitespace (settled-ADR estimate ¥11,000-¥16,000 x business location) with a 100-room accommodation-led product. All of the following are simplified calculations; an actual investment decision requires a detailed feasibility study.
Assumptions: 100 guest rooms, 22 m2 of exclusive area per room, guest-room area at 65% of the total, gross floor area 3,385 m2 (1,024 tsubo). Site of 1,000 m2 with a 400% floor area ratio. Occupancy of 80% (set conservatively against the 85.9% estimated occupancy for Shiga business hotels in July 2026). Non-room revenue (breakfast, vending, parking and so on) booked at 10% of room revenue. GOP margin of 50% (the midpoint of the 40-60% industry benchmark for business hotels, per Relo Hotel Solutions). FF&E and soft costs booked at 12% of construction cost.
Construction cost (stage 1: 2025 actuals). Based on MLIT’s Building Construction Statistics, 2025 hotel construction costs were ¥2.026 million per tsubo for reinforced concrete, ¥2.405 million for steel frame and ¥1.952 million as the all-structure average. That is up 42% in two years from ¥1.375 million per tsubo in 2023, and the elevated level persists. We adopt the RC figure of ¥2.026 million per tsubo, giving a construction cost of ¥2.07 billion for 1,024 tsubo.
| Site | Land cost (1,000 m2) | Construction | FF&E etc. (12%) | Total investment | Room revenue | GOP | NOI yield |
|---|---|---|---|---|---|---|---|
| Hikone | ¥81m | ¥2,074m | ¥249m | ¥2,404m | ¥350m | ¥193m | 8.0% |
| Ritto | ¥100m | ¥2,074m | ¥249m | ¥2,423m | ¥350m | ¥193m | 8.0% |
| Kusatsu | ¥241m | ¥2,074m | ¥249m | ¥2,564m | ¥350m | ¥193m | 7.5% |
Construction cost (stage 2: allowing for inflation during construction). Applying Turner & Townsend’s construction-cost inflation forecast (+5.3% in 2026, +5.0% in 2027; this article assumes +4.5% from 2028 onward) and compounding to a mid-construction point of mid-2028 for a 2029 opening, the unit construction cost rises about 13.0%, from ¥2.026 million to ¥2.290 million per tsubo. Total investment and yields on that basis are as follows.
| Site | Construction (post-inflation) | Total investment | NOI yield | Change vs stage 1 |
|---|---|---|---|---|
| Hikone | ¥2,345m | ¥2,707m | 7.1% | −0.9pt |
| Ritto | ¥2,345m | ¥2,725m | 7.1% | −0.9pt |
| Kusatsu | ¥2,345m | ¥2,867m | 6.7% | −0.8pt |
Rising construction costs also work to suppress new supply. Given that construction cost is one reason Shiga’s new business-hotel supply is stuck at 1.5% of existing stock, a high barrier to entry also means the competitive environment stays benign. Over the life of a project, cost inflation is a negative and a positive at the same time: it deters competing entrants.
Sensitivity Analysis — Does a ¥11,000 ADR at 76% Occupancy Still Hold 7%?
Now the tolerance for assumptions moving. Holding the site at Hikone (¥81,110/m2) and construction cost at stage 1 (¥2.026 million per tsubo), NOI yields at varying settled-ADR estimates and occupancy levels are as follows.
| Settled ADR est. | 72% occupancy | 76% occupancy | 80% occupancy (base) | 84% occupancy |
|---|---|---|---|---|
| ¥10,000 | 6.0% | 6.3% | 6.7% | 7.0% |
| ¥11,000 | 6.6% | 7.0% | 7.3% | 7.7% |
| ¥12,000 | 7.2% | 7.6% | 8.0% | 8.4% |
| ¥13,000 | 7.8% | 8.2% | 8.7% | 9.1% |
The base case of a ¥12,000 settled-ADR estimate at 80% occupancy gives 8.0%. Cutting ADR to ¥11,000 still holds 7.0% at 76% occupancy. Even the conservative case of ¥10,000 and 72% occupancy delivers 6.0%, so the structure does not collapse easily (for the perspective of working back to a required ADR from the interest-rate environment, see Policy Rate 1.00%: Break-Even ADR Across Japan’s 8 Hotel Markets). Applying stage 2 (post-inflation construction costs) to a Ritto site gives 7.1% at ¥12,000 and 80% occupancy, and 8.0% at ¥13,000 and 84% occupancy.
The ¥12,000 settled-ADR estimate assumed here is a level only the single highest-rated of the prefecture’s 40 business hotels currently reaches. This model therefore does not assume “the same product at the same price as incumbents.” Achieving it depends on product-design differences — 22 m2 rooms (larger than existing limited-service properties in the prefecture), a business-belt location, and catering to weekday multi-night and corporate demand — that lift the position from the existing ¥7,000-¥9,000 band into the ¥11,000-¥13,000 band. That ryokan already achieve ¥13,134 and city hotels ¥12,389 is corroborating evidence that willingness to pay at this level exists in the prefecture.
| Risk factor | Detail | Assessment |
|---|---|---|
| Market risk | A wider correction in accommodation demand. In Kinki, five prefectures other than Shiga were below last year in July 2026. If Shiga’s demand is primarily business-driven the impact is limited, but the leisure component moves with the region | Medium |
| Construction cost | Cost per tsubo rose 42% from 2023 to 2025. A 2029 opening requires a further 13.0% to be factored in | High |
| Land risk | Commercial land in Kusatsu is accelerating at +6.84% year on year, so any delay in acquisition feeds straight into cost. Hikone is relatively stable at +0.75% | Medium |
| Demand risk | Resident population within 1 km of the station is projected at −18.8% for Nagahama and −11.3% for Hikone (2040). Maintaining the worker count is a precondition | Medium |
| Rate-achievement risk | A ¥12,000 settled-ADR estimate is reached by only one of the prefecture’s 40 existing properties. Differentiation through product design is a necessary condition | High |
| Competitive entry | New supply in 2026 is 1.5% of existing stock. Construction-cost inflation acts as a barrier to entry | Low |
Scenario Comparison — The Viable Range Across Optimistic, Base and Pessimistic Cases
The assumptions above are bundled into three cases: optimistic, base and pessimistic. The site is fixed at Hikone (published commercial land price ¥81,110/m2, 1,000 m2) throughout, the settled-ADR estimate and occupancy take the top, base and bottom of the sensitivity table above, and construction cost takes either stage 1 (2025 actuals, ¥2.026 million per tsubo) or stage 2 (inflation included, ¥2.290 million per tsubo). No new assumptions are introduced; these are combinations of figures already presented.
| Case | Settled ADR est. | Occupancy | Construction cost basis | Total investment | GOP | NOI yield |
|---|---|---|---|---|---|---|
| Pessimistic | ¥10,000 | 72% | Stage 2 | ¥2,707m | ¥145m | 5.3% |
| Base | ¥12,000 | 80% | Stage 1 | ¥2,404m | ¥193m | 8.0% |
| Optimistic | ¥13,000 | 84% | Stage 1 | ¥2,404m | ¥219m | 9.1% |
The range runs from 5.3% (pessimistic) to 9.1% (optimistic), with 8.0% in the middle. The pessimistic case has the rate falling short even of the bottom of the whitespace band, occupancy at just 72% on a full-year modelling basis, and construction-cost inflation absorbed in full — and it still returns 5.3%. At the same rate and occupancy but with construction cost held at stage 1, the figure is 6.0%: that 0.7-point difference comes not from the site or from demand but from the timing of construction. Put the other way round, what most determines whether this project works is the cost at the point of breaking ground, which is why construction cost is assessed as “high” in the risk table.
Conclusion — How to Read a Market Where Prices Are Rising and Supply Has Stopped
To summarise what this article has established about Shiga’s accommodation market. First, the settled-ADR estimate was above the year-earlier level in all seven months of H1 2026, and July 2026 came in at +3.3% (¥8,122, N=160 properties) — the only one of the six Kinki prefectures above last year. Second, new supply amounts to two business hotels and 91 rooms, or 1.5% of existing stock: effectively frozen. Third, the prefecture divides into business, middle and leisure/through-traffic layers, and the business belt (80 covered properties, weighted average ¥7,883) is up 6.1% year on year, ahead of the prefecture as a whole. Fourth, three stations — Nagahama, Hikone and Otsu — have more workers than residents within 1 km, and weekday early sell-outs were observed at mid- to large-sized properties in Hikone, Konan and Omihachiman. Fifth, only two properties in the prefecture are accommodation-led products in a business location achieving a settled-ADR estimate of ¥11,000-¥16,000, while ryokan and city hotels already operate at that level.
Overlay those five and the outline of the opportunity appears. Demand rests on the durable base of business travel, prices are rising, and supply has stopped because of construction-cost inflation — and yet business locations hold nothing but low-rate product. Starting from Hikone, where land costs have moved least, a 100-room development that uses room size and product design to take a position a notch above the existing ¥7,000-¥9,000 band pencils out at an 8.0% NOI yield on 2025 construction costs, or 7.1% on an inflation-adjusted basis for a 2029 opening.
Viewing Shiga as “a low-rate prefecture” flattens its three-layer structure and its mix of property categories into a single average. Just as Takashima has the highest listed price in the prefecture but a settled-ADR estimate near the bottom, averages conceal structure. Broken apart, what this market shows is demand entering a phase that pushes rates up without the product in place to meet it — and that is precisely the room to enter.
Frequently Asked Questions
Q. Why is Shiga the only prefecture in Kinki with a positive settled-ADR estimate?
The data in this article suggests its demand mix differs from its neighbours. Year-on-year changes for July 2026 were −12.8% in Kyoto, −30.7% in Osaka and −13.3% in Nara — the largest declines fell in prefectures likely affected by shifts in how wide-area tourism and large-event demand is distributed. Shiga, by contrast, has business cores where workers outnumber residents within 1 km of the station (Nagahama, Hikone and Otsu), and METI’s Factory Location Trend Survey recorded 22 factory sitings in 2025, a second consecutive annual increase. Weekday booking curves also show business hotels already at 60.8% occupancy at LT90 (estimated for 8 July 2026 check-ins), pointing to a structure in which business demand — relatively insulated from swings in tourism events — supports rates.
Q. Will new business-hotel supply in Shiga stay low?
Openings in 2026 come to two properties and 91 rooms (1.5% of existing stock), but that figure is based on confirmed OTA listings, and because listings appear several months before opening, the most recent and future months may rise. Supply further out has to be checked against planning data from MLIT’s Building Construction Dynamics Statistics Survey; since building confirmation applications are filed one to two years before opening, however, future years are structurally undercounted and should be read as a floor for the confirmed pipeline. That said, 2025 construction costs of ¥2.026 million per tsubo for reinforced concrete — 32% above 2023 — are likely to keep suppressing supply for some time.
Q. What exactly is the “whitespace price band in business locations”?
It is the ¥11,000-¥16,000 settled-ADR estimate band (tax-exclusive equivalent). Of the 40 business hotels in Shiga covered here (OTA-released allocation of 30% or more, with a settled-basis ADR estimate available), only two exceed ¥11,000 and 37 fall below ¥10,000. In the same prefecture, however, ryokan operate at ¥13,134 and city hotels at ¥12,389. Willingness to pay at this level exists in the market; there is simply no accommodation-led product at that price point in a business location.
Q. Why does Hikone come up as a candidate?
Three indicators overlap. First, within 1 km of Hikone station there are 7,977 workers against 7,745 residents (2025 estimate) — a business core where workers outnumber residents. Second, the inventory sell-through data for four weekdays (8-11 June 2026) shows depth of demand: a 245-room property at the station’s east exit recorded an average early sell-out LT of 26.8 days, sold out on all four days and logged 71 cumulative sell-out observation days. Third, published commercial land prices are ¥81,110/m2 (2026, +0.75% year on year), about a third of Kusatsu’s ¥241,222/m2 (+6.84%), and essentially flat. Strong demand indicators alongside land costs that have not moved.
Q. How does the settled-ADR estimate in this article differ from the price shown on OTAs?
The settled-ADR estimate is an estimated settled rate (tax-exclusive equivalent) calculated by applying a category-specific adjustment coefficient to the lowest published plan level each property lists on OTAs (double occupancy, per-room, tax-inclusive). Cross-checked against property-level results disclosed by listed hotel REITs, the median error is 6.6%. What this article calls the “listed price,” by contrast, is the average across all plans listed on OTAs (room-only through to plans with meals), tax-inclusive and per room at double occupancy. Because the two are measured on different bases, and because the category mix of listed inventory differs, gaps arise such as Takashima having the highest listed price in the prefecture (¥32,065) while its settled-ADR estimate is near the bottom (¥6,786).
Note on the modelling: the development scenarios in this article are simplified calculations based on public data; an actual investment decision requires a detailed feasibility study. Land costs are reference figures based on published land prices and exclude actual acquisition prices, site preparation and incidental costs. Construction costs, GOP margins and occupancy are all assumptions drawn from published benchmarks and do not guarantee the results of any individual project.
Related Reading
- Shiga Settled ADR H1 2026: Business Hotels +4.8%, Resort Hotels −2.9%
- Shiga #2 in Summer Search Growth: Lake Biwa as Kyoto’s Spillover Hotel Market
- Hotel Supply Pressure Ranking 2026-2027: Ozu Kumamoto Tops at 30.8%
- Miyazaki & Saga Hotel Investment Whitespace: Zero Hotels at ¥18-25k
- Policy Rate 1.00%: Break-Even ADR Across Japan’s 8 Hotel Markets
References and Sources
■ Data sources
MetroEngines Research & Consulting OTA published-price and inventory data (settled-ADR estimate: Shiga N=160 properties, July 2026 / by municipality N=1-34 properties / by category N=11-82 properties; listed price; estimated occupancy; booking curves; inventory sell-through data). Booking curves cover check-ins on Wednesday 8 July 2026 and Saturday 11 July 2026; inventory sell-through data covers 8-11 June 2026 (Mon-Thu) and is limited to properties whose OTA-released allocation is at least 30% of total rooms (of 131 covered properties, 78 had observation data and 51 passed the filter). Official statistics: MLIT Published Land Prices (2026), Building Construction Statistics Survey (2025, construction cost by structure) and National Land Numerical Information (projected population by 250 m mesh); Economic Census for Business Activity (Ministry of Internal Affairs and Communications / METI); METI Factory Location Trend Survey (2025).
■ Modelling assumptions
100 guest rooms, 22 m2 of exclusive area per room, guest-room area at 65% of the total, gross floor area 3,385 m2 (1,024 tsubo), site of 1,000 m2 (400% floor area ratio). Occupancy of 80% (a full-year modelling assumption, set conservatively against the 85.9% estimated occupancy for Shiga business hotels in July 2026). Non-room revenue at 10% of room revenue; GOP margin of 50% (the midpoint of the 40-60% industry benchmark for business hotels); FF&E and soft costs at 12% of construction cost. Construction cost: stage 1 = ¥2.026 million per tsubo (2025 actuals, reinforced concrete); stage 2 = ¥2.290 million per tsubo, set at a mid-2028 mid-construction point for a 2029 opening using construction-cost inflation forecasts. Land cost = each city’s published commercial land price x 1,000 m2. NOI yield = GOP / total investment. The sensitivity analysis and scenario comparison vary only ADR and occupancy within this formula.
■ Limitations and caveats
The settled-ADR estimate applies a category-specific adjustment coefficient to OTA published prices; cross-checked against property-level results disclosed by listed hotel REITs, the median error is 6.6%. Occupancy is an estimate based on how OTA-distributed inventory is taken up and differs from a property’s true overall occupancy. Year-on-year changes for municipalities with two or fewer covered properties (Ritto, Yasu, Maibara and Taga) rest on small samples and swing widely. New supply is based on confirmed OTA listings, and because listings appear several months before opening, the most recent and future months may rise. Station-level employment and residential data are values for a 1 km radius around each station, and the figures vary with how the centre point is set. Land costs are reference figures based on published land prices and exclude actual acquisition prices, site preparation and incidental costs. All of the feasibility modelling in this article is simplified; an actual investment decision requires a detailed feasibility study.
■ Market data
- MetroEngines Research & Consulting — settled-ADR estimate (Shiga N=160 properties, July 2026), listed price, estimated occupancy, booking curves, inventory sell-through data
- MetroEngines Research & Consulting — new-opening data (based on confirmed OTA listings, compiled as of 1 August 2026)
■ Government and official statistics
- MLIT, Published Land Prices (2026)
- MLIT, Building Construction Statistics Survey (2025, construction cost by structure)
- MLIT, National Land Numerical Information (projected population by 250 m mesh)
- Ministry of Internal Affairs and Communications / METI, Economic Census for Business Activity (boundaries = Population Census small areas)
- METI, Factory Location Trend Survey (2025)
- Shiga Prefecture, Business Location Guide
■ Industry reports and benchmarks
- JLL, Japan Hotel Investment Market 2025 (new supply rate, GOP outlook)
- Invincible Investment Corporation, portfolio disclosure (GOP margin actuals)
- Relo Hotel Solutions, GOP margin benchmarks by property category
- Turner & Townsend, Global Construction Market Intelligence 2025 (formerly the International Construction Market Survey; construction-cost inflation forecasts)
- Tochidai, published and standard land prices for Shiga Prefecture (2026)