

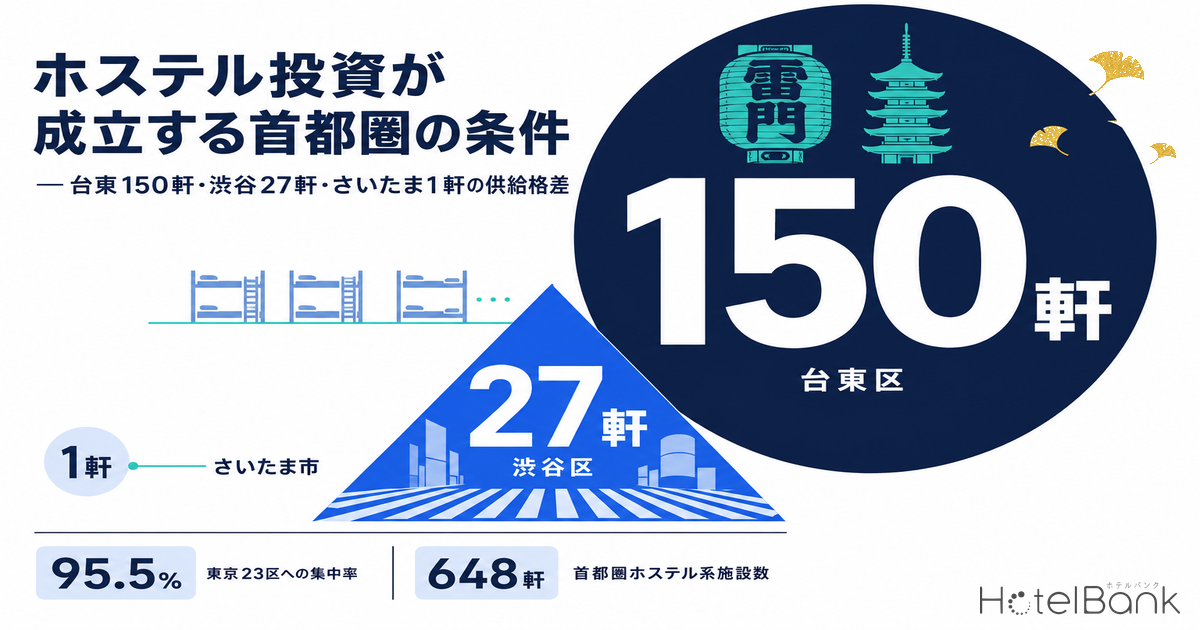
Anyone considering an investment in hostels or guesthouses in Greater Tokyo runs into the same question first: in which areas does the business actually work? We start with the conclusion. Within the coverage of MetroEngines Research & Consulting, Greater Tokyo (Tokyo’s 23 wards plus the wards of Saitama, Chiba, Yokohama, Kawasaki and Sagamihara cities) had 648 properties and 11,266 rooms in the hostel / guesthouse / dormitory category with sales confirmed on OTAs between March and September 2026. Of these, 619 properties (95.5%) are concentrated in Tokyo’s 23 wards. Taito Ward alone accounts for 150, and together with Sumida Ward (69) and Shinjuku Ward (65), the top three wards hold 45.9% of the 23-ward total. By contrast, Saitama City has just 1, Chiba City 2 and Yokohama City 22. There is a wide gap between the interest implied by searches such as “hostel investment Saitama”, “hostel investment Chiba” or “hostel business Shinagawa” and where supply actually sits.
Metric Definitions Used in This Article
- Listed price: the average selling price each property publishes on OTAs. The base is the per-room rate for two guests sharing one room (tax included, average of all plans); where a single-occupancy figure is shown, this is stated explicitly. It differs from the actual transacted price. Area-level figures are the median, within the area, of each property’s average price over the period (i.e. the level of a typical property in that area).
- Hostel / guesthouse category (referred to as “hostel-type” in this article): the sum of four categories in our property classification — “hostel”, “guesthouse”, “dormitory” and “youth hostel”. This does not correspond to the business-license types under the Inns and Hotels Act (simple lodging vs. ryokan/hotel business).
- Coverage: properties with a selling price observed on OTAs for any check-in date from March 1 to September 30, 2026. Properties not listed on OTAs are excluded.
- Occupancy rate (OCC): all occupancy rates in this article are published figures from the Japan Tourism Agency’s “Overnight Travel Statistics Survey”, not our own estimates.
- Number of simple lodging (kan-i shukusho) facilities: the number of licensed facilities as of fiscal year-end in the Ministry of Health, Labour and Welfare’s “Report on Public Health Administration and Services”.
- — Of the 648 hostel-type properties (11,266 rooms) in Greater Tokyo, 619 (95.5%) are in Tokyo’s 23 wards. The top three wards — Taito (150), Sumida (69) and Shinjuku (65) — alone account for 45.9% of the 23-ward total.
- — Saitama City has 1 and Chiba City 2. Simple lodging license counts (Saitama City 3, Chiba City 34) point the same way. It is safer to read these as markets where supply never formed, not as untapped markets.
- — “Hostels are cheap” does not hold in Greater Tokyo. Taito Ward’s median listed price of ¥25,786 is about 17% above business hotels (¥22,000). Chuo Ward is +42% and Chiyoda Ward +30%.
- — Per-room pricing is the norm. The listed-price gap between single occupancy and two guests per room is only 7–15%, so a design that stacks up beds does not translate directly into revenue.
- — Occupancy is determined by the area, not the property type. The national average for simple lodging is 29.6%, but Osaka Prefecture reaches 75.2% (both full-year 2025, preliminary).
Greater Tokyo’s Hostel Supply Is 95% Concentrated in the 23 Wards — 150 in Taito Ward, 1 in Saitama City
First, we map supply. The chart below ranks hostel-type property counts by ward and city across Greater Tokyo. Taito Ward stands out with 150, followed by Sumida Ward (69) and Shinjuku Ward (65). Taito Ward — home to Ueno, Asakusa and Kuramae — holds 24.2% of all hostel-type supply in the 23 wards on its own.
Source: MetroEngines Research & Consulting (based on confirmed OTA listings; properties with price observations for check-in dates in March–September 2026; N=648 properties)
What stands out is not just the absolute count but the share within each area. Hostel-type properties make up 24 of 39 lodging properties (61.5%) in Nakano Ward, 12 of 24 (50.0%) in Itabashi Ward and 69 of 139 (49.6%) in Sumida Ward. The fewer large hotels an area has, the more small properties become the main source of lodging supply. Conversely, in areas where large hotels cluster — Minato Ward (15.9%), Shinagawa Ward (15.8%), Chuo Ward (16.1%) and Chiyoda Ward (16.5%) — hostel-type properties carry relatively little weight.
On a map, this skew becomes even clearer. Circle size shows the number of properties; color intensity shows the share within the area.
Source: MetroEngines Research & Consulting / Each circle is centered on the average coordinates of lodging properties within the ward or city
Dark circles run from the east side of the Yamanote Line further east (Taito, Sumida, Arakawa, Katsushika, Edogawa), while the west side (Setagaya, Suginami, Nerima) and the suburbs of Saitama, Chiba and Yokohama are almost blank. The breakdown for the main areas is shown below.
| Ward / City | Hostel-type | Hostel-type rooms | All lodging | Share | Median listed price | Price N |
|---|---|---|---|---|---|---|
| Taito | 150 | 3,370 | 426 | 35.2% | ¥25,786 | 141 |
| Sumida | 69 | 1,053 | 139 | 49.6% | ¥20,667 | 64 |
| Shinjuku | 65 | 861 | 252 | 25.8% | ¥21,743 | 63 |
| Toshima | 36 | 458 | 150 | 24.0% | ¥19,326 | 27 |
| Minato | 35 | 624 | 220 | 15.9% | ¥29,927 | 29 |
| Chuo | 34 | 1,014 | 211 | 16.1% | ¥37,923 | 28 |
| Shibuya | 27 | 368 | 105 | 25.7% | ¥27,857 | 27 |
| Ota | 25 | 309 | 91 | 27.5% | ¥18,675 | 22 |
| Nakano | 24 | 137 | 39 | 61.5% | ¥22,882 | 20 |
| Chiyoda | 21 | 425 | 127 | 16.5% | ¥30,622 | 15 |
| Yokohama (Naka Ward) | 19 | 367 | 92 | 20.7% | ¥21,856 | 14 |
| Setagaya | 17 | 83 | 39 | 43.6% | ¥30,695 | 12 |
| Arakawa | 16 | 261 | 35 | 45.7% | ¥19,117 | 16 |
| Koto | 16 | 162 | 76 | 21.1% | ¥25,481 | 15 |
| Edogawa | 12 | 359 | 44 | 27.3% | ¥21,800 | 11 |
| Katsushika | 12 | 120 | 54 | 22.2% | ¥14,023 | 11 |
| Kita | 12 | 113 | 48 | 25.0% | ¥21,605 | 11 |
| Shinagawa | 12 | 310 | 76 | 15.8% | ¥21,281 | 12 |
| Itabashi | 12 | 151 | 24 | 50.0% | ¥15,786 | 12 |
| Suginami | 9 | 46 | 23 | 39.1% | ¥21,038 | 7 |
| Bunkyo | 8 | 203 | 33 | 24.2% | ¥18,458 | 7 |
| Adachi | 4 | 29 | 23 | 17.4% | ¥15,005 | 4 |
| Meguro | 3 | 107 | 25 | 12.0% | — | — |
| Kawasaki (Kawasaki Ward) | 2 | 242 | 41 | 4.9% | — | — |
Source: MetroEngines Research & Consulting (Property counts based on confirmed OTA listings, March–September 2026. Listed price: the per-room rate for two guests per room, tax included, for check-ins March–August 2026, averaged per property, then the median. Price N is the number of properties with at least 20 days of price observations.)
Note: The Greater Tokyo tally in this article covers Tokyo’s 23 wards and the wards of the designated cities (Saitama, Chiba, Yokohama, Kawasaki and Sagamihara); municipalities such as Kamakura, Hakone and Narita are not included. Kamakura and Hakone do have their own clusters of guesthouses and small inns, but their demand structure differs from urban hostel investment, so they are outside the scope of this article.
One point to note in this table is that some areas have no value in the listed-price column. Meguro Ward (3 properties), Kawasaki Ward in Kawasaki City (2), Hanamigawa Ward in Chiba City (2) and Sakura Ward in Saitama City (1) each have fewer than four properties whose prices can be observed consistently. The very fact that there is not a large enough base to talk about an area’s market rate says something about these areas today.
Checking the Base with Government Data — Simple Lodging Licenses: 3 in Saitama City, 34 in Chiba City
Our tally is based on OTA listings, so properties that do not list on OTAs are excluded. Government license data is a useful way to check the base from another angle. According to the Ministry of Health, Labour and Welfare’s “Report on Public Health Administration and Services”, there were 44,901 simple lodging facilities nationwide as of the end of FY2024 (end of March 2025). By prefecture, Chiba has 1,533, Tokyo 1,256 and Kanagawa 1,116, while Saitama has only 143. How re-basing prefectural supply on this 44,901-facility denominator reshuffles the ranking itself is examined in detail in our article on prefectural supply including simple lodging in the denominator.
Source: Compiled by MetroEngines Research & Consulting from the Ministry of Health, Labour and Welfare, “Report on Public Health Administration and Services” (FY2024)
Source: Compiled by MetroEngines Research & Consulting from the Ministry of Health, Labour and Welfare, “Report on Public Health Administration and Services” (FY2024, designated-city breakout figures)
The designated-city breakout shows the same picture as our OTA-based tally. Saitama City has just 3 facilities, Chiba City 34, Kawasaki City 52 and Sagamihara City 39. Yokohama City is somewhat higher at 165, but that is an order of magnitude below Kyoto City (2,956) or Osaka City (572). Of the 1,533 simple lodging facilities in Chiba Prefecture, Chiba City accounts for only 2.2%; the rest are spread across tourism and airport demand areas within the prefecture, such as the Boso area and around Narita. “Chiba Prefecture has many simple lodging facilities” and “hostels work in Chiba City” are entirely different statements.
Note that the license-granted and closure columns combine ryokan/hotel business and simple lodging business, so the annual number of new simple lodging licenses on its own cannot be separated out from this table.
192 New Openings Nationwide in 2026, 33 in Greater Tokyo — 29 in Tokyo vs. 0 in Saitama
Beyond the stock, we also want to look at the flow. Properties in the hostel / guesthouse / dormitory category confirmed as opening in 2026 total 192 properties and 2,444 rooms nationwide. By prefecture, Tokyo leads with 29, followed by Fukuoka (21) and Hokkaido (18). The other Greater Tokyo prefectures are Chiba with 3, Kanagawa with 1 and Saitama with 0.
Source: MetroEngines Research & Consulting (based on confirmed OTA listings; 2026 openings; N=192 properties)
Note: Opening counts are based on confirmed OTA listings. Listings appear several months before opening, so figures for the second half of 2026 onward may increase as more listings are added. These are current observations, not a confirmed annual total.
From an investor’s perspective, this distribution shows two things. First, new entry is polarized between Tokyo’s 23 wards and regional tourism and inbound hubs (Fukuoka, Hokkaido, Hiroshima, Okinawa, Kyoto). Second, virtually no new supply is entering the suburban cities of Greater Tokyo. Areas with thin stock are thin in flow too.
“Hostels Are Cheap” Does Not Hold in Greater Tokyo — Per-Room Rates Are Roughly on Par with Business Hotels
Now for the revenue side. The common image of hostel investment is “low rates, high occupancy, and earning through space efficiency.” Yet actual figures in Greater Tokyo contradict this premise. The chart below compares, by ward, the median listed price for hostel-type properties, business hotels and all property types.
Source: MetroEngines Research & Consulting (check-ins March–August 2026; two guests per room, per-room rate, tax included. Each property’s period average, median within the ward. Only properties with at least 20 days of price observations.)
In Taito Ward, the median for hostel-type properties is ¥25,800 versus ¥22,000 for business hotels, making hostel-type properties about 17% more expensive. The same holds in Chuo Ward (¥37,900 vs. ¥26,700, +42%), Chiyoda Ward (¥30,600 vs. ¥23,600, +30%) and Minato Ward (¥29,900 vs. ¥25,700, +16%). Hostel-type properties come in lower in Shibuya Ward (¥27,900 vs. ¥38,900), Shinjuku Ward (¥21,700 vs. ¥23,800) and Sumida Ward (¥20,700 vs. ¥21,800), among others, and apart from Shibuya the gap is within 10%.
The reason for this reversal is that the “hostel” category in Greater Tokyo includes not only bunk-bed dormitories sold by the bed, but also many small lodging properties rented by the room or as a whole building. The gap between single-occupancy and two-guests-per-room listed prices backs this up.
| Ward | Single occupancy | Two guests per room | Second-guest premium | N (1 guest / 2 guests) |
|---|---|---|---|---|
| Taito | ¥22,837 | ¥25,786 | +12.9% | 141 / 141 |
| Sumida | ¥19,192 | ¥20,667 | +7.7% | 64 / 64 |
| Shinjuku | ¥20,198 | ¥21,743 | +7.6% | 63 / 63 |
| Toshima | ¥16,843 | ¥19,326 | +14.7% | 31 / 27 |
| Arakawa | ¥17,118 | ¥19,117 | +11.7% | 16 / 16 |
Source: MetroEngines Research & Consulting (single occupancy for check-ins May–August 2026; two guests per room for check-ins March–August 2026. Both are per-room listed prices, tax included, averaged per property, median within the ward.)
Even when the number of guests doubles, the listed price rises only 7–15%. In other words, per-room pricing, not per-person pricing, is the norm. This directly affects how an investment should be structured. Revenue is not driven by “how many beds can fit in a room” but by “how many rooms can be built” and “what each room can sell for.” If space efficiency is designed on the assumption that more beds mean more revenue, actual selling prices may not keep up.
Guest Review Scores Favor Hostel-Type Properties — Tokyo 4.12 vs. Business Hotels 3.86
We also want to check how the demand side receives these properties. Comparing average property scores for properties with at least 10 reviews, using guest reviews compiled by the HotelBank Editorial Team, hostel-type properties in Tokyo score 4.12 (N=152 properties, 323,464 reviews in total), above business hotels at 3.86 (N=663 properties, 4,579,436 reviews in total).
Source: HotelBank Editorial Team survey (average for properties with at least 10 reviews and an available review score; property and review counts are given in the text)
The same tendency appears in Kanagawa (4.09 vs. 3.73, N=53 vs. 165), Osaka (4.05 vs. 3.84, N=112 vs. 317), Hyogo (4.25 vs. 3.65, N=28 vs. 134) and Kyoto (4.25 vs. 4.04, N=306 vs. 158). In Chiba the gap narrows somewhat to 3.80 vs. 3.68 (N=17 vs. 117). Saitama has only four qualifying hostel-type properties — too small a base to speak of an average.
How should this gap be read? Small properties are easier for operators to keep an eye on, and guests’ expectations of location and facilities are calibrated in advance. In addition, because the core clientele deliberately chooses to stay there, mismatches between expectations and reality are less likely. Put the other way, hostel-type properties are a format in which high ratings are a precondition for occupancy. A small property without good ratings finds it hard to secure occupancy on location and brand alone, the way a large hotel can.
Condition 1: The Inns and Hotels Act and Zoning — Architect Confirmation of Compliance Required from May 2026
From here, we lay out the regulatory framework that underpins investment decisions. Most hostels and guesthouses obtain a license for simple lodging business under the Inns and Hotels Act. Simple lodging is defined as “a facility whose structure and equipment are mainly designed for lodging spaces shared by many people,” and in principle requires a total guest-room floor area of at least 33㎡ (or at least 3.3㎡ × capacity for facilities with a capacity of fewer than 10 guests). There is no cap on annual operating days, which is the decisive difference from the Private Lodging Business Act (180-day annual cap).
Next is zoning. Under the Building Standards Act, hotels and ryokan (including simple lodging) may only be built in certain zoning districts.
| Zoning district | Hotel / ryokan construction |
|---|---|
| Category I Exclusively Low-rise Residential Zone | Not permitted |
| Category II Exclusively Low-rise Residential Zone | Not permitted |
| Category I Exclusively Medium-high-rise Residential Zone | Not permitted |
| Category II Exclusively Medium-high-rise Residential Zone | Not permitted |
| Category I Residential Zone | Permitted up to 3,000㎡ floor area |
| Category II Residential Zone | Permitted |
| Quasi-residential Zone | Permitted |
| Neighborhood Commercial Zone | Permitted |
| Commercial Zone | Permitted |
| Quasi-industrial Zone | Permitted |
| Industrial Zone | Not permitted |
| Exclusively Industrial Zone | Not permitted |
| Rural Residential Zone | Not permitted |
Source: Organized by MetroEngines Research & Consulting from Appended Table 2 of the Building Standards Act. Where local ordinances impose additional restrictions, separate confirmation is required.
Converting a vacant house in a residential neighborhood into a hostel is intuitively appealing, but in Category I and II Exclusively Low-rise Residential Zones and in Exclusively Medium-high-rise Residential Zones, such buildings cannot be built at all. Even in Category I Residential Zones, a 3,000㎡ floor-area limit applies. This is one reason hostel supply is thin in the residential suburbs of Saitama, Chiba and Yokohama. The relationship between floor-area ratio, zoning and development capacity is covered in detail in our article on hotel development capacity by zoning, FAR and land price.
What changed with the May 28, 2026 notice
On May 28, 2026 (Reiwa 8), the Ministry of Health, Labour and Welfare and the Ministry of Land, Infrastructure, Transport and Tourism issued the notice “On Thorough Confirmation of Compliance with the Building Standards Act When Licensing Inn and Hotel Businesses” (Kensei-Eihatsu 0528 No. 1 / Kokujushi No. 164). As before, a building confirmation procedure is required when the total floor area subject to a change of use exceeds 200㎡, but even where the floor area is 200㎡ or less and no building confirmation procedure is required, compliance with building standards-related regulations after the change of use must now be thoroughly confirmed. In practice, property selection should proceed on the assumption that even small properties will need a specialist to confirm Building Standards Act compliance. Acquiring a property on the understanding that “200㎡ or less means lighter procedures” can lead to unexpected costs and delays at the licensing stage.
Other items to check before acquisition include the use classification under the Fire Service Act (most hostels fall under Category (5)-i, requiring automatic fire alarms, exit lights, fire extinguishers and the like), requirements for stairs and evacuation routes, and, depending on scale, coverage under the Barrier-Free Act. Rather than securing a property first and then consulting the public health center, building guidance division and fire department, the sequence of completing those consultations first and then deciding whether to acquire is especially important for this format.
Condition 2: Occupancy — 29.6% for Simple Lodging Nationwide, 75.2% in Osaka
Obtaining a license and running a viable business are two different things. According to full-year 2025 figures (preliminary) from the Japan Tourism Agency’s “Overnight Travel Statistics Survey”, the guest-room occupancy rate by facility type was 29.6% for simple lodging — less than half the level of business hotels (75.3%) and city hotels (74.2%).
Source: Compiled by MetroEngines Research & Consulting from the Japan Tourism Agency, “Overnight Travel Statistics Survey”, full-year 2025 (Reiwa 7), preliminary
However, it is not appropriate to use this 29.6% national average directly as an investment assumption for Greater Tokyo. In the same statistics, simple lodging in Osaka Prefecture recorded 75.2%, higher than the national business-hotel average. Discussed as a national average, simple lodging looks like a format that doesn’t work, yet in urban areas where demand concentrates it achieves occupancy rivaling large hotels. As the license counts cited earlier show (Nagano 4,361, Okinawa 3,804, Kyoto Prefecture 3,647, Hokkaido 3,314), the national simple-lodging base is dominated by small properties in tourist destinations, which include many highly seasonal, low-occupancy facilities.
In other words, the question to ask in an investment decision is not “Is simple lodging profitable?” but “Is this area a demand market that can build occupancy year-round?” The skewed supply seen in the previous sections (concentration in Taito, Sumida and Shinjuku) can be read as the market’s answer to this question, delivered by operators over time.
Condition 3: Setting Investment per Bed and Required Revenue
Finally, we lay out how to build the numbers. What follows is a simplified estimate with all assumptions stated explicitly; it is not a substitute for a feasibility study of any specific property.
Annual lodging revenue per bed (or per single-guest sales unit) can be set as “bed rate × occupancy × 365 days.” We set the GOP margin conservatively at 35%. As a reference point, Invincible Investment Corporation discloses a GOP ratio of 38.9% for its 91 domestic hotels (operator: MHM) for the fiscal period ended December 2024 (up 1.6 points year on year) — a figure for established properties with stable occupancy. We judged it reasonable to assume that small operators in the early years after opening would fall below this. With a target yield of 8%, the “allowable investment per bed” is as follows.
| Bed rate | Occupancy (assumed) 40% | Occupancy (assumed) 55% | Occupancy (assumed) 70% |
|---|---|---|---|
| ¥3,500 | ¥511,000 GOP ¥178,800 / Max. investment ¥2.24M | ¥702,600 GOP ¥245,900 / Max. investment ¥3.07M | ¥894,200 GOP ¥313,000 / Max. investment ¥3.91M |
| ¥5,000 | ¥730,000 GOP ¥255,500 / Max. investment ¥3.19M | ¥1,003,800 GOP ¥351,300 / Max. investment ¥4.39M | ¥1,277,500 GOP ¥447,100 / Max. investment ¥5.59M |
| ¥6,500 | ¥949,000 GOP ¥332,200 / Max. investment ¥4.15M | ¥1,304,900 GOP ¥456,700 / Max. investment ¥5.71M | ¥1,660,800 GOP ¥581,300 / Max. investment ¥7.27M |
Assumptions: annual lodging revenue = bed rate × occupancy × 365 days; GOP margin 35%; target yield 8%. Excludes land, FF&E and pre-opening costs. GOP margin reference: Invincible Investment Corporation’s disclosed results (91 properties, 38.9% for the period ended December 2024) / Estimates by MetroEngines Research & Consulting
Now we compare this with supply-side costs. Based on the Ministry of Land, Infrastructure, Transport and Tourism’s “Statistics on Building Construction Starts”, the 2025 hotel construction cost averaged ¥1.952M per tsubo (≈3.3㎡) across all structure types (steel frame ¥2.405M, reinforced concrete ¥2.026M). ¥1.952M per tsubo is roughly ¥591,000 per ㎡. Assuming 8–12㎡ of gross floor area per bed including common areas and back-of-house, construction cost alone comes to roughly ¥4.72M–¥7.09M per bed, excluding land.
The table above shows combinations of assumptions as a grid, but an investment decision requires choosing which combination to use as the base case. Using the same formula, the pessimistic, mid and optimistic cases compared with the lower bound of construction cost look like this.
| Scenario | Bed rate | Occupancy | Annual lodging revenue | GOP | Allowable investment | Vs. construction-cost lower bound / interpretation |
|---|---|---|---|---|---|---|
| Pessimistic | ¥3,500 | 40% | ¥511,000 | ¥178,850 | ¥2.24M | Far below the ¥4.72M lower bound Does not work as new construction. Total acquisition + renovation must be kept within ¥2.24M per bed |
| Mid | ¥5,000 | 55% | ¥1,003,750 | ¥351,312 | ¥4.39M | Slightly below the ¥4.72M lower bound New construction does not work; conversion of an existing building comes within reach |
| Optimistic | ¥6,500 | 70% | ¥1,660,750 | ¥581,262 | ¥7.27M | Above the ¥4.72M lower bound Can work even as new construction, but assumes Taito Ward-level rates and year-round occupancy |
Assumptions: annual lodging revenue = bed rate × occupancy × 365 days; GOP margin 35%; target yield 8%; allowable investment = GOP ÷ target yield. Excludes land, FF&E and pre-opening costs. The ¥4.72M construction-cost lower bound corresponds to the 8㎡-per-bed floor area assumed in the text. / Estimates by MetroEngines Research & Consulting
Across the three cases, allowable investment ranges from ¥2.24M to ¥7.27M — a 3.2x spread. If the bed rate and occupancy each slip just one step below the assumption, a plan that should have worked falls below the construction-cost lower bound. This high sensitivity is why area selection must come first in hostel investment.
Putting the two together shows how high the bar is for building a hostel from scratch. In the grid above, allowable investment exceeds ¥4.72M only in the upper-right region: a ¥5,000 bed rate at 70% occupancy (¥5.59M), and a ¥6,500 bed rate at 55% (¥5.71M) or 70% (¥7.27M). Targeting an 8% yield on new construction including land works only under quite limited conditions, even in Greater Tokyo. This arithmetic explains why conversions of existing buildings have become the mainstream of hostel supply in Greater Tokyo.
For conversions, however, there are no public statistics indicating renovation cost levels. The range is too wide — depending on the building’s condition, whether a change of use is required, and the extent of additional fire-safety equipment — so this article does not estimate it. In practice, a realistic approach is to work backward from the “allowable investment” in the table above as the ceiling for acquisition price plus renovation cost, and consider only properties that fit within that range.
Reading Individual Wards and Cities — What to Look for Beyond Ueno and Asakusa
We now apply the data so far to the individual areas that are most frequently searched.
Taito Ward (Ueno, Asakusa, Kuramae): The largest in Greater Tokyo with 150 properties and 3,370 rooms. Its base of 426 lodging properties is itself the largest among the 23 wards; that structure is covered in detail in our article on why Taito Ward has the most hotels and its price-band structure. The median listed price for hostel-type properties (¥25,800) exceeds that of business hotels (¥22,000), so this is not an area where rates are hard to achieve. On the other hand, competition is the thickest.
Sumida Ward and Arakawa Ward: Hostel-type properties account for 69 of 139 (49.6%) in Sumida Ward and 16 of 35 (45.7%) in Arakawa Ward, with supply spreading out as Taito Ward’s outer ring. Median listed prices are ¥20,700 in Sumida and ¥19,100 in Arakawa — 20–30% below Taito Ward. These areas absorb demand as neighbors of Taito Ward while both land prices and room rates step down a level.
Nakano Ward: 24 of 39 properties (61.5%) — the highest hostel-type share in Greater Tokyo. The median listed price for hostel-type properties is ¥22,900, close to the ward’s all-type median of ¥24,500. With almost no large hotels, small properties are the main source of supply here.
Kita Ward (Akabane) and Itabashi Ward: 12 of 48 properties in Kita Ward and 12 of 24 (50.0%) in Itabashi Ward. Median listed prices are ¥21,600 in Kita and ¥15,800 in Itabashi. Kita Ward’s hostel-type properties are well above business hotels (¥15,700), an example of small properties securing rates in an area with few lodging properties overall.
Ota Ward (Kamata): 25 of 91 properties. Backed by access to Haneda Airport, listed prices for hostel-type properties and business hotels have converged at nearly the same level (¥18,700 vs. ¥18,100). Upside in rates is hard to expect, but year-round support from airport demand sets it apart from other surrounding wards.
Koto Ward (Toyosu), Shinagawa Ward, Minato Ward (Aoyama), Shibuya Ward (Harajuku), Bunkyo Ward (Korakuen) and Meguro Ward: All have many lodging properties overall but a low hostel-type share (Koto 21.1%, Shinagawa 15.8%, Minato 15.9%, Shibuya 25.7%, Bunkyo 24.2%, Meguro 12.0%). Large hotels and business hotels got to these areas first, and land prices are high. In Shibuya Ward, the median listed price for hostel-type properties is ¥27,900 versus ¥38,900 for business hotels, so large properties also come out on top in terms of rates. It is not easy for a small property on the same land to close that rate gap. Meguro Ward does not even have four hostel-type properties whose prices can be observed consistently.
Saitama, Chiba and Yokohama: Saitama City has 1 hostel-type property among 53 lodging properties, and just 3 simple lodging licenses. Chiba City has 2 of 80, with 34 simple lodging facilities. Yokohama City has 22 of 188 (19 of them in Naka Ward), with 165 simple lodging facilities. What they have in common is that lodging demand itself exists, but business hotels absorb it, leaving structurally little room for small properties to break in. The all-type listed price in Omiya Ward, Saitama City is ¥19,800 (August 2026, 15 properties) and in Chuo Ward, Chiba City ¥17,900 (same, 24 properties), so rate levels are not high either. A low-rate market centered on business demand is a poor fit for the hostel model, which secures occupancy by accumulating strong guest reviews and being chosen. Yokohama’s Naka Ward (19 properties, median listed price ¥21,900) is the exception in having formed supply, because it contains tourist destinations such as Kannai, Motomachi and Chinatown.
This article is written from the perspective of those who acquire, open and operate properties, rather than from that of travelers comparing guesthouse rates or extended-stay prices.
Reference: How Osaka and Hyogo Differ
Looking outside Greater Tokyo, Osaka and Hyogo provide useful comparisons. Simple lodging licenses number 773 in Osaka Prefecture (572 of them in Osaka City) and 986 in Hyogo Prefecture (56 in Kobe City). The facility counts themselves are lower than Tokyo’s 1,256. Yet in the Japan Tourism Agency statistics, the simple lodging occupancy rate in Osaka Prefecture is 75.2% (full-year 2025 [Reiwa 7], preliminary) — among the highest in the country.
In guest reviews too, hostel-type properties score 4.05 in Osaka (N=112 properties) and 4.25 in Hyogo (N=28 properties), each above the respective business-hotel average (3.84 and 3.65). The gap is particularly large in Hyogo at 0.60 points. However, of Hyogo’s 986 simple lodging facilities, only 56 are in Kobe City; the rest are spread across hot-spring towns such as Kinosaki and Arima, Awaji Island and elsewhere. Even within “hostels in Hyogo”, central Kobe and the hot-spring towns have entirely different demand structures and seasonality.
In Osaka, acceptance of new applications for Special Zone private lodging (tokku minpaku) certification ended on May 29, 2026, so the regulatory environment for short-stay lodging supply differs from other areas. Figures from areas with different regulatory premises cannot be lined up and compared against Greater Tokyo using the same yardstick.
Summary — The Sequence for Evaluating Hostel Investment in Greater Tokyo
We summarize the practical conclusions drawn from the data in this article.
First, settle area selection first. Of the 648 hostel-type properties in Greater Tokyo, 95.5% are in Tokyo’s 23 wards, and 45.9% of those are concentrated in just three wards: Taito, Sumida and Shinjuku. The figures of 1 property in Saitama City and 2 in Chiba City are safer read not as “untouched markets” but as “markets where supply did not form after operators repeatedly considered them.” Simple lodging license counts (Saitama City 3, Chiba City 34) point in the same direction.
Second, question the assumptions of the revenue model. Per-room pricing is the norm for hostel-type properties in Greater Tokyo, and the listed-price gap between single occupancy and two guests per room is only 7–15%. A design in which revenue rises in proportion to the number of beds is hard to sustain in this market. Listed prices themselves are on par with or above business hotels, so the premise of “a format that sells cheaply” does not apply in Greater Tokyo either.
Third, put regulatory checks before property acquisition. Many areas do not permit construction under zoning, and since the May 28, 2026 notice, Building Standards Act compliance must be confirmed even for changes of use of 200㎡ or less. Discovering either of these after securing a property can be irreversible.
Fourth, do not base occupancy assumptions on the national average. Against a national average occupancy rate of 29.6% for simple lodging (full-year, January–December 2025, preliminary), Osaka Prefecture posts 75.2% (same basis). The area, not the format, determines occupancy. In Greater Tokyo, that means checking whether year-round lodging demand can be observed in an area, based on how supply has clustered and the level of guest review scores.
Because hostels and guesthouses can be started small, they are a format strongly affected by location and operational quality. The fact that they outscore business hotels in guest reviews shows the strength of this format, while also showing that an operating structure capable of building strong ratings is a precondition for the business to work. Setting the numbers first and then searching for properties turns out to be the sequence with the highest certainty.
Related Reading
- Hotel Development Capacity 2026: Zoning, FAR & Land Price in 5 Markets
- Why Taito Ward Has Tokyo’s Most Hotels: 403 Properties, Mid-Tier ADR
- Lodging Supply Denominator: 44,901 Simple Lodgings Move Kyoto 21st→5th
- Simple Lodging × Vacant Home Reuse 2026: Kyoto, Osaka & Naha Whole-House IRR
- Tokyo 23 Wards Supply Pressure 2026: Arakawa 16.0%, Minato Just 4.5%
- Hotel Investment in Japan’s “Second-Tier” Cities: ADR, Supply & Yield Across 5 Markets
References & Sources
■ Data sources
Property counts, room counts and listed prices are aggregated from OTA listing data held by our company. Coverage: properties with a selling price observed for any check-in date from March 1 to September 30, 2026 (N=648). Listed prices are the per-room rate for two guests per room (tax included) for check-ins March–August 2026, averaged per property and, limited to properties with at least 20 days of price observations, converted to the median within each ward. Single occupancy covers check-ins May–August 2026. Reviews are averages for properties with at least 10 reviews and an available review score. License counts are from the Ministry of Health, Labour and Welfare’s “Report on Public Health Administration and Services” (FY2024), occupancy rates from the Japan Tourism Agency’s “Overnight Travel Statistics Survey” (full-year 2025 [Reiwa 7], preliminary), and construction cost per tsubo from the Ministry of Land, Infrastructure, Transport and Tourism’s “Statistics on Building Construction Starts”.
■ Estimate assumptions
Annual lodging revenue per bed (or per single-guest sales unit) = bed rate × occupancy × 365 days. The 35% GOP margin places Invincible Investment Corporation’s disclosed GOP ratio of 38.9% for its 91 domestic hotels (operator: MHM) for the period ended December 2024 on the conservative side, allowing for underperformance in the early years after opening. Target yield 8%; allowable investment = GOP ÷ target yield. Excludes land, FF&E and pre-opening costs. The construction-cost comparison is the 2025 all-structure average of ¥1.952M per tsubo (about ¥591,000 per ㎡) multiplied by 8–12㎡ of floor area per bed, giving roughly ¥4.72M–¥7.09M. Bed rates and occupancy in the sensitivity table and the three-scenario table are assumptions, not actual results.
■ Limitations and caveats
Listed prices are the prices each property publishes on OTAs and differ from actual transacted prices or realized ADR. Properties not listed on OTAs are excluded, so the population does not match government license counts. Our “hostel-type” classification (the four categories of hostel, guesthouse, dormitory and youth hostel) does not correspond to business types under the Inns and Hotels Act. All occupancy rates are figures published by the Japan Tourism Agency, not our estimates, but because they are national statistics by facility type and prefecture, they do not guarantee occupancy for any individual area or property. The number of new openings in 2026 is an observed value based on confirmed OTA listings, not a confirmed annual total. Conversions of existing buildings are not estimated because no public statistics indicate renovation cost levels. This article is a general market analysis and is not a substitute for investment decisions or feasibility studies on individual properties.
■ Market data
- MetroEngines Research & Consulting — OTA listed-price data, property master data, new-opening data (based on confirmed OTA listings)
- HotelBank Editorial Team survey — aggregation of guest reviews (properties with at least 10 reviews)
■ Government statistics and public documents
- Ministry of Health, Labour and Welfare, “Report on Public Health Administration and Services” FY2024, Table 8: Number of facilities and rooms for ryokan/hotel business and number of facilities for simple lodging and boarding-house business (e-Stat)
- Ministry of Health, Labour and Welfare and Ministry of Land, Infrastructure, Transport and Tourism, “On Thorough Confirmation of Compliance with the Building Standards Act When Licensing Inn and Hotel Businesses” (Kensei-Eihatsu 0528 No. 1 / Kokujushi No. 164, May 28, 2026)
- Japan Tourism Agency, “Overnight Travel Statistics Survey”, full-year 2025 (Reiwa 7), preliminary
- Ministry of Land, Infrastructure, Transport and Tourism, “Statistics on Building Construction Starts” (construction cost per tsubo)
- Building Standards Act, Appended Table 2 (restrictions on buildings within zoning districts)
- Enforcement Order of the Inns and Hotels Act, Article 1, Paragraph 3 (structural and equipment standards for simple lodging business)
■ REIT disclosures
- Invincible Investment Corporation, financial results presentation materials — GOP ratio of 38.9% for 91 domestic hotels (operator: MHM), period ended December 2024