

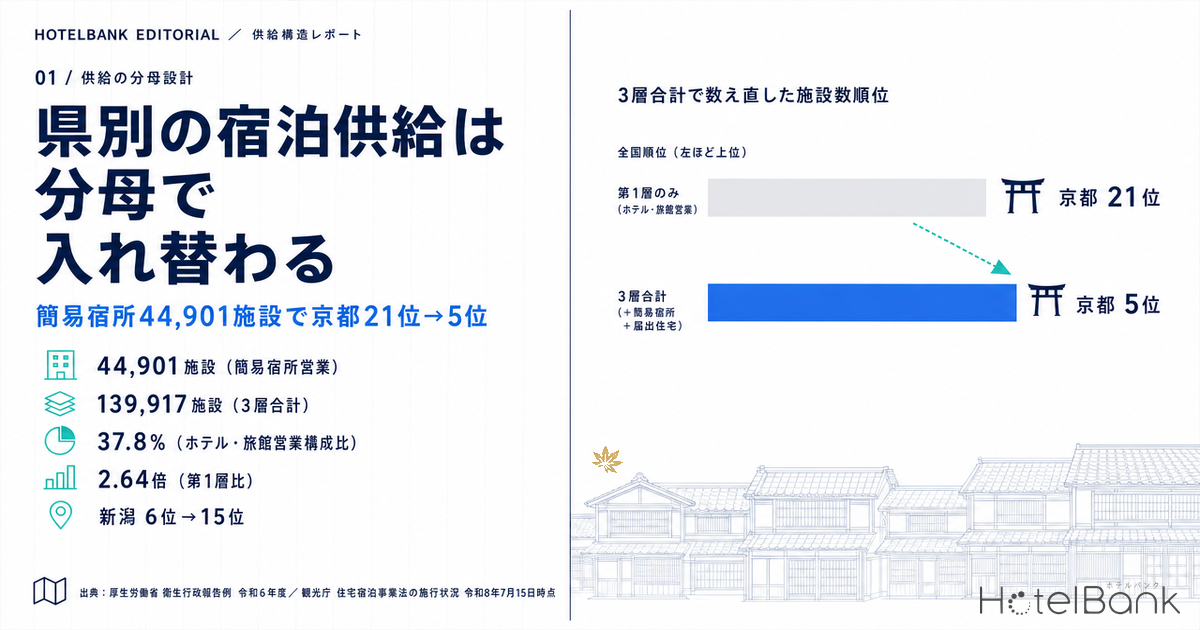
When the lodging industry talks about supply, most business plans put “hotel and ryokan guest rooms” in the denominator. But in the finalized FY2024 figures of the Ministry of Health, Labour and Welfare’s Report on Public Health Administration and Services, Ryokan & Hotel Business establishments numbered 52,946 nationwide, while Simple Lodging (kani-shukusho) establishments reached 44,901 — already close behind on an establishment-count basis. Add the 42,070 registered private lodgings from the Japan Tourism Agency’s Status of Enforcement of the Private Lodging Business Act (as of July 15, 2026) and the total pool of short-stay accommodation reaches 139,917 establishments, leaving the Ryokan & Hotel Business category at just 37.8% of the whole.
This article is not about demand. It focuses on how the supply denominator should be designed. Recounting prefectural rankings across three tiers — “hotel rooms only,” “plus Simple Lodgings,” and “plus active registered private lodgings” — moves 15 of the top 20 prefectures. Kyoto jumps from 21st to 5th; Niigata falls from 6th to 15th. The choice of denominator alone changes both the occupancy assumptions in a business plan and the way competition is perceived.
Metric Definitions Used in This Article
- Tier 1 | Ryokan & Hotel Business: Facilities licensed under the Hotel Business Act. Establishment and guest-room counts from the MHLW Report on Public Health Administration and Services, FY2024 (as of end of FY2024). This is the only tier for which guest-room counts are published.
- Tier 2 | Simple Lodging Business: Facilities licensed under the Hotel Business Act in the Simple Lodging category. Establishment counts, also as of end of FY2024. Guest-room counts are not available in the statistics, so establishment counts and room counts are never summed in the same table.
- Tier 3 | Registered private lodgings (active basis): Registrations under the Private Lodging Business Act, excluding those that have ceased operations. Japan Tourism Agency, Status of Enforcement of the Private Lodging Business Act, as of July 15, 2026. We use 42,070 — the 65,837 cumulative registrations minus 23,767 withdrawals. Registration does not equal operation, so cumulative registration counts are not used. Facilities licensed under the Hotel Business Act and National Strategic Special Zone minpaku are not included in Tier 3.
- Non-hotel inventory per 100 hotel guest rooms: (Simple Lodging establishments + registered private lodgings) ÷ Ryokan & Hotel Business guest rooms × 100. Because the units differ (establishments versus rooms), this metric is used for relative comparison between prefectures, not as an absolute level.
- Note on differing reference dates: Tiers 1 and 2 are as of end of FY2024 (March 31, 2025); Tier 3 is as of July 15, 2026. These are not a single point-in-time cross-section.
- Data sources: MHLW Report on Public Health Administration and Services / Japan Tourism Agency, Status of Enforcement of the Private Lodging Business Act / new openings from MetroEngines Research (based on confirmed OTA listings)
- — The Ryokan & Hotel Business category totals 52,946 establishments nationwide — only 37.8% of the entire short-stay accommodation pool. Adding 44,901 Simple Lodgings and 42,070 active registered private lodgings brings the three-tier total to 139,917 establishments, expanding the denominator 2.64-fold.
- — Recounting on a three-tier basis moves 15 of the top 20 prefectures. Kyoto rises from 21st to 5th (expansion multiple 6.32x) and Niigata falls from 6th to 15th (1.38x) — the definition of the denominator alone reorders how the market looks.
- — What fills the denominator differs completely by prefecture. In Nagano, 96% of non-hotel inventory is Simple Lodgings; in Tokyo, 93% is registered private lodgings. Non-hotel inventory per 100 hotel rooms ranges from 10.2 in Kyoto to 1.5 in Miyagi — a 6.8-fold gap that makes any single nationwide adjustment factor untenable.
- — Using cumulative registration counts as supply overstates the market. The nationwide withdrawal rate is 36.1%, and Osaka’s is 61.0%. Without converting to an active basis, Osaka’s denominator would be 2.6 times the real figure.
- — Regulatory changes in 2026 are moving the denominator. Permitting single-room operations channels supply into Tier 1, while the endorsement of “zero-day” restrictions and ward ordinances (Sumida, Katsushika and Shibuya) impose area and day-of-week constraints on Tier 3. What is needed is a day-of-week denominator, not an annual average.
The national denominator expands 2.64-fold — hotels and ryokan are only 37.8%
Start with the national figures. Adding 44,901 Simple Lodgings to 52,946 Ryokan & Hotel Business establishments gives 97,847. Adding 42,070 active registered private lodgings brings the total to 139,917 — 2.64 times the count obtained from hotel rooms alone. The composition is close to an even three-way split: Ryokan & Hotel Business 37.8%, Simple Lodgings 32.1%, registered private lodgings 30.1%.
All three tiers are inventory with a legal basis for accommodating paying overnight guests, and they sit on the same shelf on a traveler’s search screen. Even so, most supply-side analysis counts only Tier 1. If the denominator differs by a factor of 2.6, the occupancy assumption derived from dividing the same demand naturally shifts with it.
Source: Compiled by the HotelBank Editorial Team from MHLW “Report on Public Health Administration and Services” FY2024 and Japan Tourism Agency “Status of Enforcement of the Private Lodging Business Act” as of July 15, 2026
Looking at the breakdown for the top 12 prefectures, 71.1% of Tokyo’s 24,635 three-tier total is registered private lodgings, with the Ryokan & Hotel Business category at just 23.8%. Nagano is the opposite: Simple Lodgings account for 60.5% of its 7,212 three-tier total, and registered private lodgings number only 195 (2.7%). Two prefectures can both be described as having “deep supply” while the substance of that depth is entirely different.
Prefectural rankings shift in 15 prefectures — Kyoto 21st→5th, Niigata 6th→15th
Next, we compare prefectural rankings on an establishment-count basis, Tier 1 alone versus the three-tier total. To keep units consistent, the comparison uses establishment counts rather than guest rooms, since room counts are not published for Simple Lodgings or registered private lodgings.
| # | Prefecture | Hotel/ryokan guest rooms |
Tier 1 establishments |
+ Simple Lodgings | + Private lodgings | Three-tier total | Change in establishment rank | Non-hotel per 100 rooms |
|---|---|---|---|---|---|---|---|---|
| 1 | Tokyo | 212,888 | 5,858 | 1,256 | 17,521 | 24,635 | 1st→1st ±0 | 8.8 |
| 2 | Hokkaido | 122,333 | 2,930 | 3,314 | 4,492 | 10,736 | 3rd→2nd +1 | 6.4 |
| 3 | Okinawa | 67,747 | 3,799 | 3,804 | 1,623 | 9,226 | 2nd→3rd -1 | 8.0 |
| 4 | Nagano | 63,280 | 2,656 | 4,361 | 195 | 7,212 | 4th→4th ±0 | 7.2 |
| 5 | Kyoto | 50,075 | 955 | 3,647 | 1,438 | 6,040 | 21st→5th +16 | 10.2 |
| 6 | Shizuoka | 68,174 | 2,535 | 2,016 | 575 | 5,126 | 5th→6th -1 | 3.8 |
| 7 | Osaka | 128,519 | 1,646 | 773 | 2,600 | 5,019 | 7th→7th ±0 | 2.6 |
| 8 | Chiba | 59,041 | 1,232 | 1,533 | 1,219 | 3,984 | 15th→8th +7 | 4.7 |
| 9 | Yamanashi | 27,243 | 1,325 | 2,080 | 378 | 3,783 | 11th→9th +2 | 9.0 |
| 10 | Kanagawa | 58,662 | 1,308 | 1,116 | 1,276 | 3,700 | 13th→10th +3 | 4.1 |
| 11 | Fukuoka | 64,550 | 1,315 | 400 | 1,844 | 3,559 | 12th→11th +1 | 3.5 |
| 12 | Tochigi | 36,556 | 1,398 | 919 | 493 | 2,810 | 9th→12th -3 | 3.9 |
| 13 | Hyogo | 46,733 | 1,411 | 986 | 310 | 2,707 | 8th→13th -5 | 2.8 |
| 14 | Kagoshima | 27,134 | 847 | 1,626 | 206 | 2,679 | 24th→14th +10 | 6.8 |
| 15 | Niigata | 43,524 | 1,926 | 279 | 452 | 2,657 | 6th→15th -9 | 1.7 |
| 16 | Aichi | 68,339 | 1,220 | 158 | 1,012 | 2,390 | 16th→16th ±0 | 1.7 |
| 17 | Gunma | 29,680 | 1,121 | 926 | 255 | 2,302 | 17th→17th ±0 | 4.0 |
| 18 | Nagasaki | 22,815 | 639 | 1,425 | 211 | 2,275 | 32nd→18th +14 | 7.2 |
| 19 | Gifu | 26,692 | 1,065 | 838 | 339 | 2,242 | 18th→19th -1 | 4.4 |
| 20 | Fukushima | 41,169 | 1,382 | 652 | 147 | 2,181 | 10th→20th -10 | 1.9 |
Source: Compiled by the HotelBank Editorial Team from MHLW “Report on Public Health Administration and Services” FY2024 (as of end of FY2024) and Japan Tourism Agency “Status of Enforcement of the Private Lodging Business Act” as of July 15, 2026. Top 20 prefectures by three-tier total. Figures for designated cities, special wards and public-health-center cities are consolidated into their host prefecture
Kyoto moves the most. Its Ryokan & Hotel Business count of 955 establishments ranks only 21st nationally, but adding 3,647 Simple Lodgings lifts it straight into the upper tier, and its three-tier total of 6,040 puts it 5th nationwide. The expansion multiple over Tier 1 is 6.32x — more than twice the national average of 2.64x. Framing Kyoto’s lodging supply as “955 hotels” means seeing only one-sixth of the options a traveler can actually choose from.
Moving the other way are Niigata (6th→15th), Fukushima (10th→20th) and Yamagata (26th→39th) — prefectures with many Ryokan & Hotel Business establishments but thin non-hotel inventory. Niigata’s expansion multiple stays at 1.38x, and its non-hotel inventory per 100 hotel rooms is 1.7, among the lowest nationwide. These prefectures can be read as markets where competition has not accumulated outside the existing stock — arguably easier to assess competitively when entering.
Source: Compiled by the HotelBank Editorial Team from MHLW “Report on Public Health Administration and Services” FY2024 and Japan Tourism Agency “Status of Enforcement of the Private Lodging Business Act” as of July 15, 2026. Shorter bars indicate higher rank (1 = top)
The denominator’s contents differ by prefecture — Simple Lodging type vs. private lodging type
Breaking down why the rankings move reveals that the type of non-hotel inventory splits cleanly by prefecture. The chart below plots all 47 prefectures on two axes of counts per 100 hotel guest rooms: Simple Lodgings (horizontal) and registered private lodgings (vertical).
Source: Compiled by the HotelBank Editorial Team from MHLW “Report on Public Health Administration and Services” FY2024 and Japan Tourism Agency “Status of Enforcement of the Private Lodging Business Act” as of July 15, 2026 (N=47 prefectures). Bubble size represents Ryokan & Hotel Business guest rooms
The lower right holds the Simple Lodging type. Yamanashi (7.6 Simple Lodgings, 1.4 private lodgings), Nagano (6.9 and 0.3), Nagasaki (6.2 and 0.9) and Kagoshima (6.0 and 0.8) are representative, each with a layer of small operators licensed under the Hotel Business Act — pensions, rental villas and island guesthouses.
The upper left is the private lodging type: Tokyo (0.6 Simple Lodgings, 8.2 private lodgings), Fukuoka (0.6 and 2.9), Osaka (0.6 and 2.0) and Saitama (0.5 and 1.7). Here the urban apartment stock serves as the accommodation pool.
And in the upper right, where both are deep, sit Kyoto (7.3 and 2.9), Nara (3.6 and 3.1) and Okinawa (5.6 and 2.4). Kyoto’s 10.2 units of non-hotel inventory per 100 hotel rooms is the highest nationwide, a 6.8-fold gap over Miyagi’s 1.5. Even for the same decision to “build one hotel,” the depth of non-hotel inventory already stacked up nearby differs by an order of magnitude between prefectures.
Note that Osaka has a fourth layer not included in the three above: National Strategic Special Zone minpaku under the National Strategic Special Zones Act. Certified rooms nationwide total 26,167 (as of end of April 2026, Japan Tourism Agency), the vast majority concentrated in Osaka City. Osaka City closed applications for new special-zone certifications as of May 29, 2026 (already-certified facilities continue to operate), so the regulatory framework itself differs from other prefectures. Because the unit is “rooms” rather than establishments, this layer is not included in the three-tier table here. When counting Osaka’s supply, it must be added separately. Where the framework converges after the close of special-zone applications is examined city by city in Simple Lodging × Vacant Home Reuse 2026: Kyoto, Osaka & Naha Whole-House IRR.
The denominator is moving — Simple Lodgings +7.1% a year, private lodgings at a 36.1% withdrawal rate
The denominator is not a fixed value. Simple Lodgings grew from 41,909 establishments in FY2023 to 44,901 in FY2024 — +2,992 establishments, or +7.1%, in a single year. The largest absolute increases were Hokkaido +285, Shizuoka +223, Yamanashi +215, Kyoto +195 and Chiba +178. By growth rate, Kagawa (+21.0%), Tochigi (+18.6%) and Gifu (+14.6%) led. This tier is concentrated in the lower price bands, where small-scale operators compete on a different basis from full-service hotels.
Source: Compiled by the HotelBank Editorial Team from MHLW “Report on Public Health Administration and Services” FY2023 and FY2024
Registered private lodgings, by contrast, move in both directions. Against 65,837 cumulative registrations nationwide there have been 23,767 withdrawals — a withdrawal rate of 36.1%. By prefecture the rate is high in Osaka (61.0%), Hiroshima (44.5%), Hokkaido (44.4%) and Fukuoka (41.2%), and low in Chiba (22.2%), Niigata (20.6%), Shizuoka (20.4%) and Tochigi (15.9%). Treating cumulative registrations as supply would put 2.6 times the actual figure into Osaka’s denominator. Capturing the active basis is essential.
Overlaying our own data, accommodation facilities confirmed to have opened in 2026 total 1,174 establishments and 33,075 rooms nationwide (MetroEngines Research, based on confirmed OTA listings) — 1.9% of the existing 1,782,232 Ryokan & Hotel Business guest rooms. By prefecture, the largest additions relative to existing stock are in places that do not stand out in absolute terms: Kagawa at 5.16% of existing stock (718 rooms), Saitama 4.60% (1,232 rooms), Kumamoto 4.40% (1,187 rooms) and Iwate 4.34% (904 rooms). By establishment count, rental villas were the largest category of 2026 openings at 551 facilities, and much of that layer enters supply as Simple Lodgings or registered private lodgings.
* New-opening data is based on confirmed OTA listings. Because listings typically appear several months before opening, counts for the most recent months onward may rise as further listings appear.
2026 regulatory changes are reshaping how the denominator must be designed
Through 2026, a series of regulatory changes moved the boundaries between these three tiers. Three of them bear directly on denominator design.
(1) Enforcement of the amended Hotel Business Act (June 15, 2026) The minimum room-count thresholds — 10 rooms for hotel operations and 5 for ryokan operations — were abolished, making it possible to obtain a Ryokan & Hotel Business license from a single room. The separate “ryokan operation” and “hotel operation” categories were merged into a single “Ryokan & Hotel Business,” and the front desk requirement can now be waived provided there is no impediment to verifying guests’ identity and monitoring entry and exit. ICT-based identity verification was also permitted. This opens a path for the small-scale, unstaffed formats that previously existed only as Simple Lodgings or registered private lodgings to flow into Tier 1.
(2) Endorsement of “zero-day” restrictions (notice of July 15, 2026) The Ministry of Health, Labour and Welfare, the Ministry of Land, Infrastructure, Transport and Tourism, and the Japan Tourism Agency set out the position that local governments may, by ordinance, designate areas in which the permitted annual operating days for registered private lodgings is effectively zero. This is technical advice under Article 245-4, Paragraph 1 of the Local Autonomy Act, so the notice itself is not legally binding, but it functions as reference material when ordinances are drafted. New entry into Tier 3 can be halted on an area-by-area basis, which means the assumption that future denominator values extend linearly no longer holds.
(3) Day-of-week and area restrictions under municipal and ward ordinances Tokyo’s Sumida Ward, under an ordinance effective April 1, 2026, provides that for new registrations of the owner-absent type without a resident manager, guests may not be accommodated anywhere in the ward from Monday noon to Saturday noon (excluding public holidays and the year-end/New Year period). Existing facilities and cases with a resident manager are exempt. Katsushika Ward similarly limits operation of owner-absent facilities without a resident manager to Saturday noon–Monday noon and from noon on a public holiday to noon the following day. In Shibuya Ward, an ordinance amendment effective July 1, 2026 expanded the restricted areas to Category I and Category II residential districts and quasi-residential districts.
These do not reduce Tier 3 in aggregate so much as create a temporal structure in which the denominator differs between weekdays and weekends. For business hotels whose main battleground is weekday corporate demand, non-hotel inventory thins out on weekdays inside ordinance areas — a change that widens the room for hotels to absorb that demand. On weekends, leisure demand still faces all three tiers as before. In short, what is needed is a day-of-week denominator, not an annual average.
A denominator-design checklist for business plans
The following organizes the analysis above into a form usable in practice.
| Item | What not to do | Recommended |
|---|---|---|
| Unit consistency | Adding Simple Lodging establishment counts to hotel guest-room counts | Keep establishments with establishments and rooms with rooms. Room counts for Tiers 2 and 3 are not published |
| Treatment of private lodgings | Treating cumulative registrations as supply | Use the active basis, net of withdrawals. The nationwide withdrawal rate is 36.1%; Osaka’s is 61.0% |
| Reference dates | Presenting figures with different reference dates as one cross-section | The Report on Public Health Administration and Services is fiscal year-end (most recently March 31, 2025); private lodging data updates bimonthly. State both reference dates |
| Special-zone minpaku | Assuming it is included in the three tiers | 26,167 certified rooms nationwide, centered on Osaka City, sit in a separate bucket. The regulatory regime differs, so do not place it in the same series as other prefectures |
| Day-of-week denominator | Deriving occupancy from an annual-average denominator | In ordinance areas, the operable volume of Tier 3 differs between weekdays and weekends. Split the denominator by day of week |
| Setting future values | Simply extrapolating Simple Lodgings at +7.1% | Opposing forces act at once: single-room licensing pulls supply into Tier 1, while zero-day restrictions constrain Tier 3 by area |
Compiled by the HotelBank Editorial Team
Conclusion
The 52,946 establishments in the Ryokan & Hotel Business category are just 37.8% of the 139,917-establishment short-stay accommodation pool. Putting 44,901 Simple Lodgings and 42,070 active registered private lodgings back into the denominator moves 15 of the top 20 prefectures: Kyoto from 21st to 5th, Niigata from 6th to 15th.
More important still is that not only the depth but the type of non-hotel inventory differs by prefecture. Non-hotel inventory per 100 hotel guest rooms is 10.2 in Kyoto against 1.5 in Miyagi — a 6.8-fold gap — and the composition is the mirror image: 96% Simple Lodgings in Nagano versus 93% registered private lodgings in Tokyo. No uniform nationwide coefficient for inflating the denominator can hold.
The three regulatory changes enacted or notified in 2026 will move this denominator further. Single-room licensing channels supply into Tier 1, while the endorsement of zero-day restrictions and ward ordinances impose area and day-of-week constraints on Tier 3. The tightening itself is a change that widens the room for existing hotels on weekdays and inside ordinance areas. Designing the denominator correctly, and then identifying where that room emerges, is the starting point for the next investment decision.
Related Reading
- Simple Lodging × Vacant Home Reuse 2026: Kyoto, Osaka & Naha Whole-House IRR
- Vacation Rentals Take 45% of Japan’s 2026 New Hotel Openings (247 Villas)
- Minpaku Hits 10% of Inbound Stays: Kyoto, Okinawa, Tokyo Analysis
References and Sources
■ Data sources
Tiers 1 and 2 use prefecture-level establishment and guest-room counts from the MHLW “Report on Public Health Administration and Services,” FY2024 (as of end of FY2024). Tier 3 uses the prefecture-level registration table in the Japan Tourism Agency’s “Status of Enforcement of the Private Lodging Business Act” as of July 15, 2026 (N=47 prefectures). New-opening figures come from MetroEngines Research 2026 new-opening facility data (based on confirmed OTA listings, N=1,174 establishments / 33,075 rooms).
■ Calculation assumptions
Tier 3 uses the active basis of 42,070 — cumulative registrations of 65,837 less 23,767 business withdrawals (registration does not equal operation, so the cumulative figure is not used). Prefectural rankings are standardized on an establishment basis for unit consistency, with room counts shown only for Tier 1, the sole tier for which they are published. “Non-hotel inventory per 100 hotel guest rooms” is (Simple Lodging establishments + registered private lodgings) ÷ Ryokan & Hotel Business guest rooms × 100. Figures for designated cities, special wards and public-health-center cities are consolidated into their host prefecture.
■ Limitations and caveats
(1) Reference dates differ by tier (Tiers 1 and 2 as of March 31, 2025; Tier 3 as of July 15, 2026), so this is not a single point-in-time cross-section. (2) Room counts are not published for Tiers 2 and 3, so establishment counts and room counts are never summed in the same column. Because units differ between establishments and rooms, the per-100-rooms metric is used for relative comparison between prefectures rather than as an absolute level. (3) National Strategic Special Zone minpaku (26,167 certified rooms nationwide as of end of April 2026) is excluded from the three tiers because its unit is “rooms” and its regulatory framework differs. (4) The effects of the regulatory changes are not yet reflected in finalized statistics so soon after enforcement, so extrapolating future values linearly does not hold.
■ Government statistics
- MHLW “Report on Public Health Administration and Services,” FY2024, Table 8: Establishments and guest rooms of Ryokan & Hotel Business, and establishments, licenses, closures and dispositions of Simple Lodging and Boarding House businesses, by prefecture / designated city / core city (reproduced) (the same table is used for FY2023)
- Japan Tourism Agency, “Status of Enforcement of the Private Lodging Business Act,” as of July 15, 2026 (prefecture-level registration status)
■ Regulatory changes
- Amended Hotel Business Act takes effect June 15 (Kanko Keizai Shimbun)
- MHLW, Summary of the Study Group on the Smooth Enforcement of the Amended Hotel Business Act
- Private lodging operating days may be set effectively to zero by ordinance; ICT management also to be required (Honichi Lab, July 24, 2026)
- Tokyo’s Sumida Ward enacts private lodging ordinance limiting operations ward-wide to Friday–Sunday; existing facilities exempt (Nikkei)
- Osaka City formally decides to end new special-zone minpaku applications as of May 29, 2026 (Travel Voice, November 28, 2025)
■ Proprietary data
- MetroEngines Research — 2026 new-opening facility data (based on confirmed OTA listings, N=1,174 establishments / 33,075 rooms)