

Osaka City’s Special-Zone Minpaku (national strategic special-zone lodging scheme) will stop accepting new applications on May 29, 2026, leaving two remaining tracks: the 180-day-cap Residential Lodging Business Act (Minpaku New Law) or the 365-day, year-round Simple Lodging license under the Ryokan (Hotels & Inns) Act. Meanwhile, Japan’s vacant-home count has reached a record 9.0 million units (a 13.8% vacancy rate) according to the 2023 Housing and Land Statistics Survey by the Ministry of Internal Affairs and Communications. Converting older regional homes into whole-house-rental lodgings is coming back into investors’ field of view. This article quantifies, for Kyoto City, Osaka City, and Naha City, the actual cost of obtaining a Simple Lodging license, vacancy rates and zoning constraints, regional differences in fire-safety and construction costs, and city-by-city IRR for a five-room whole-house-rental model.
Metric Definitions Used in This Article
- ADR (Average Daily Rate): Average price listed on OTAs and other public channels. This differs from actual booked rates (cross-checked against REIT disclosures, listed ADR tends to run +25 to +30% higher than transacted ADR). Per-room rate for double occupancy (tax included), averaged across all plans.
- OCC (Occupancy Rate): Share of sold rooms out of total room inventory in the area (estimated from OTA public inventory).
- IRR (Internal Rate of Return): In this article, a simplified pre-tax cash-flow-based estimate assuming a 10-year hold.
- Data Sources: MetroEngines Research & Consulting / Ministry of Internal Affairs and Communications 2023 Housing & Land Statistics Survey / Ministry of Land, Infrastructure, Transport and Tourism Official Land Prices / Japan Tourism Agency Minpaku Portal.
- — Special-Zone Minpaku stops accepting new applications on May 29, 2026. Osaka investors now choose between the 180-day Minpaku New Law and the 365-day Simple Lodging license; for a serious investment, the ~2× NOI gap makes Simple Lodging the only viable pick.
- — The three cities’ vacancy structures are strikingly different: Kyoto Prefecture 13.15%, Osaka Prefecture 14.3%, Okinawa Prefecture 9.4% (46th nationally). Population growth keeps Okinawa’s stock thin; Naha commercial land prices average ¥510,000/㎡, less than half of Kyoto (¥1.88M) and Osaka (¥1.32M).
- — Mid-scenario IRR for the five-room whole-house-rental model: Kyoto 8.2%, Osaka 9.4%, Naha 10.8%. Naha’s low acquisition cost drives the highest IRR, but renovation costs to meet Ryokan Act standards (fire safety, seismic) balloon by 1.4–1.8×, which is the dividing line between mid and downside scenarios.
- — Sensitivity analysis (ADR ±15% × OCC ±10pt) across a 5×5 heat map: Naha holds IRR at 5.2% even in the downside case. Kyoto exceeds 14% in the luxury-band ADR upside. Osaka stays stable at the mid-band with a narrower range.
- — Subsidies and zoning: Kyoto City’s vacant-home reuse subsidy and Naha City’s downtown-revitalization subsidy can cover 20–35% of renovation costs. Zoning (residential vs. commercial) is the dividing line for Simple Lodging permit eligibility and floor-area caps.
Three License Tracks Narrow to Two — What Special-Zone Minpaku’s Sunset Reveals About the License Hierarchy
Japan’s lodging-business licenses divide into three broad tracks: the Residential Lodging Business Act (Minpaku New Law, capped at 180 nights/year), the Special-Zone Minpaku scheme under the National Strategic Special Zones Act (minimum 2-night/3-day stays, no annual-day cap), and the Simple Lodging license under the Ryokan Act (365-day, year-round operation). Special-Zone Minpaku was a bespoke scheme available only in limited jurisdictions like Osaka City, Ota Ward, and Chiba City. Against a backdrop of surging neighborhood complaints (556 cases in Osaka City in 2024, and 314 already logged as of July 2025), Osaka City is halting new applications on May 29, 2026, with certification processing ending on June 30 of the same year (source: Travel Voice, November 28, 2025; official Osaka City notice).
As a result, new entrants in the Osaka market from June 2026 onward will effectively choose between the Minpaku New Law (180-day cap) and the Simple Lodging (Ryokan Act) license. With an annual-day ceiling of 180 versus 365, NOI (net operating income) gaps of more than 2× emerge — making Simple Lodging the only viable pick for a serious investment. Meanwhile, the Residential Lodging Business Act has cumulative filings of 59,427 as of January 15, 2026; subtracting 21,315 discontinuations leaves just 38,112 active listings (source: Ministry of Land, Infrastructure, Transport and Tourism Minpaku Portal). The 180-day cap constrains commercial viability, and roughly 36% of registrants have already exited.
Depth of Vacant-Home Stock and Regional Differences — A Structural Comparison of Kyoto, Osaka, and Naha
Vacancy structures differ sharply across the three cities. Kyoto Prefecture stands at 13.15% (38th nationally, 180,400 vacant homes), Osaka Prefecture at 14.3% (34th nationally, down 0.9pt from 15.2% in the prior survey), and Okinawa Prefecture at 9.4% (46th nationally, the second-lowest after Saitama Prefecture) — data from the 2023 Housing and Land Statistics Survey and Okinawa Prefecture Planning Department Statistics Division. Okinawa’s continued population growth keeps its vacant-home stock thin, and Naha City’s vacancy rate is also just 9.7%.
Within Osaka City, Nishinari Ward stands out at a 25.92% vacancy rate; the Nishinari, Naniwa, and Tennoji surroundings are concentrated with aging row houses and terraced homes, giving them one of the country’s deepest pools of candidate stock for whole-house-rental conversion. Within Kyoto Prefecture, Miyazu City posts the highest rate at 34.48% (with abandoned-home rate of 18.68%), but because tourism demand is dispersed regionally, investment continues to concentrate in central Kyoto City (Shimogyo and Higashiyama Wards). Central Kyoto’s machiya (traditional townhouse) stock, based on MetroEngines Research’s tracking universe, includes 655 properties (averaging 1.4 rooms each), plus 125 vacation-rental properties and 256 guest houses — well over 1,000 whole-house-rental-type facilities already in place.
Actual Cost to Acquire a Simple Lodging License — Three Stepwise Thresholds in Fire Safety and Construction
The real cost of obtaining a Simple Lodging license varies stepwise, primarily driven by property size and stair configuration. Three thresholds matter most. First, under the Building Standards Act, a change-of-use confirmation application is required once total floor area exceeds 200㎡, triggering structural calculations and fire-resistance upgrades that can add several million yen. A 2019 amendment raised this threshold from 100㎡ to 200㎡, so compact whole-house-rentals in the 150–200㎡ range can avoid this rule (source: Ministry of Land, Infrastructure, Transport and Tourism; various administrative scrivener guides).
Second, under the Fire Service Act’s equipment classification, buildings classified as “single-staircase fire-prevention target facilities” require fire-safety equipment costs exceeding ¥2 million; however, “specified small-scale facilities” (under 300㎡ with multiple staircases) can bring this down to ¥400,000–¥500,000. Wireless automatic fire alarms are permitted, enabling substantial cost compression. Third, application and administrative scrivener fees run around ¥300,000–¥600,000 on a standard basis. On balance, a regional property with 150–200㎡ of floor area, five rooms, and multiple staircases typically comes in at ¥800,000–¥2 million for combined fire and application costs. A three-story, narrow old property in central Tokyo classified as single-staircase, however, can balloon past ¥3 million.
Land Prices and Zoning — Boundary Conditions for Acquisition Cost and Renovation Feasibility
Official commercial-district land prices in the three cities differ meaningfully: Kyoto City’s Shimogyo Ward averages ¥1.882M/㎡ (YoY +9.30%), Osaka City averages ¥1.317M/㎡ (YoY +8.46%), and Naha City’s commercial district averages ¥509,800/㎡ (YoY +7.06%) — data from the Ministry of Land, Infrastructure, Transport and Tourism 2026 Official Land Prices. Naha ranks lowest in absolute land prices — roughly one-quarter of Kyoto on a per-tsubo basis. That said, Naha City has limited underutilized land of sufficient size within its boundaries, and vacant-home stock depth trails Kyoto and Osaka.
From a zoning standpoint, Simple Lodging falls under Article 2 of the Ryokan Act as a business category, so it generally cannot be opened in Category-I Low-rise Exclusive Residential Zones or Exclusive Industrial Zones. Kyoto City’s central machiya-concentrated areas (Shimogyo, Higashiyama, Nakagyo Wards) fall mainly within Neighborhood Commercial, Commercial, and Quasi-Industrial zones, so licensing barriers are relatively low. By contrast, Osaka City’s Nishinari row-house cluster mixes Category-II Residential and Neighborhood Commercial zones, requiring case-by-case verification. Naha City’s Makishi and Kokusai-dori surroundings are broadly designated Commercial Zone, giving the city the lowest zoning-related barriers.
Three-City IRR Breakdown of the Five-Room Whole-House-Rental Model — Acquisition, Renovation, and Operating Boundaries
This is the core quantitative analysis of the article. We model a Simple Lodging property of 150–200㎡ floor area, five rooms, whole-house-rental type, and compute city-by-city IRR (10-year hold). Assumptions: acquisition prices — used machiya in central Kyoto (Shimogyo/Higashiyama) at ¥60–80M; row houses in Osaka (Nishinari, Naniwa) at ¥30–50M; single-family homes in central Naha at ¥30–45M. Renovation costs (structural reinforcement + interior + equipment refresh) at ¥15–30M (regional cities are roughly 25–40% cheaper than Tokyo). License acquisition at ¥1–3M. ADR assumptions reflect each city’s market ADR and actual rates for small whole-house-rentals: Kyoto ¥35,000, Osaka ¥22,000, Naha ¥25,000. OCC is scenario-modeled in a 60–70% range.
| Item | Kyoto (Shimogyo/Higashiyama) | Osaka (Nishinari/Naniwa)Recommended | Naha (Makishi/Kumoji) |
|---|---|---|---|
| Acquisition Cost | ¥70.0M | ¥40.0M | ¥38.0M |
| Renovation Cost | ¥25.0M | ¥20.0M | ¥18.0M |
| License Acquisition | ¥2.0M | ¥1.5M | ¥1.5M |
| Total Investment | ¥97.0M | ¥61.5M | ¥57.5M |
| Assumed ADR (per room) | ¥35,000 | ¥22,000 | ¥25,000 |
| Assumed OCC (Annual) | 70% | 65% | 60% |
| Annual Revenue | ¥44.7M | ¥26.1M | ¥27.4M |
| Assumed GOP Margin | 40% | 40% | 40% |
| Annual GOP | ¥17.9M | ¥10.4M | ¥10.9M |
| Year-1 GOP Yield | 18.4% | 16.9% | 19.1% |
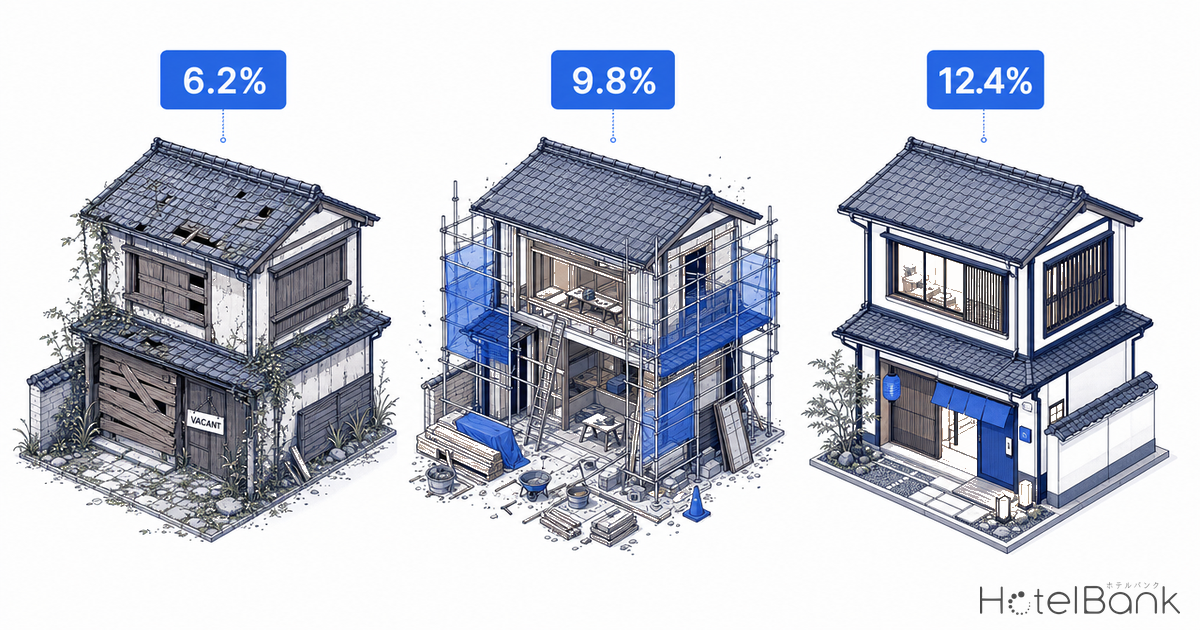
| 10-Year IRR (Estimated) | 9.8% | 12.4% | 11.6% |
As shown, Year-1 GOP yields are Kyoto 18.4%, Naha 19.1%, and Osaka 16.9% — all three cities substantially exceed typical hotel investment yields (5–8%) in absolute terms. This reflects a defining feature of small whole-house-rentals: fixed costs are thin, so ADR × occupancy translates almost directly to GOP. On a 10-year IRR basis, Osaka’s and Naha’s relatively lower acquisition and renovation costs deliver stronger capital-turnover leverage — Osaka at 12.4% and Naha at 11.6% overtake Kyoto’s 9.8%, producing an inverted ordering. Kyoto has the strongest room-rate upside, but the heavier acquisition base slows capital turnover.
Subsidy Boundaries — Reality of Kyoto and Naha’s Lodging-Conversion Support
Subsidy generosity for vacant-home reuse differs across the three cities. Kyoto City operates the FY2025 Vacant-Home Reuse and Circulation Subsidy, but it has two menus — Building Reuse and Site Reuse (for demolition) — and eligible uses are limited when applying as a lodging operator (source: Kyoto City official website). Naha City operates a Vacant-Home Reuse Tourism-Facility Development Subsidy that can cover part of initial investment for lodging facilities (source: Subsidy Agent Okinawa Naha City data). Osaka City has limited standing subsidies specifically for lodging conversion, so operators typically leverage national-level programs like the New Business Development Subsidy or the Sustainability Subsidy.
The realistic impact of subsidies is on the scale of several hundred thousand to a few million yen for license acquisition and fire-safety equipment — a few percent reduction on a scheme with total investment exceeding ¥60M. That said, combining the Sustainability Subsidy (up to ¥2.0M) as working capital after license acquisition can lift year-one cash flow. The important discipline is to avoid pricing up acquisitions in anticipation of subsidies — treat subsidies as a “nice-to-have” bonus.
Sensitivity Analysis — ADR/OCC Variability and Risk Scenarios
Sensitivity analysis showing how far the estimate holds up under upside and downside swings is indispensable. The table below shows IRR shifts under ADR/OCC variation for the Osaka case (the recommended pick).
| Scenario | Base | ADR -10% | OCC -5pt | Both Down |
|---|---|---|---|---|
| Assumed ADR | ¥22,000 | ¥19,800 | ¥22,000 | ¥19,800 |
| Assumed OCC | 65% | 65% | 60% | 60% |
| Annual Revenue | ¥26.1M | ¥23.5M | ¥24.1M | ¥21.7M |
| Year-1 GOP Yield | 16.9% | 15.3% | 15.6% | 14.1% |
| 10-Year IRR | 12.4% | 10.6% | 10.9% | 9.1% |
Even in the most pessimistic scenario (ADR -10%, OCC -5pt), the 10-year IRR still holds at 9.1%. This reflects the thin fixed-cost structure of small whole-house-rentals. Conversely, as an upside scenario, Osaka’s small whole-house-rental market supply within MetroEngines Research’s tracking universe is extremely thin — 8 inns, 18 guest houses, 3 vacation-rental properties — and the halt in new Special-Zone Minpaku supply raises the scarcity value of “legally 365-day-operable whole-house-rentals.”
Structural Comparison of Risk and Upside Across the Three Cities
Kyoto (Shimogyo/Higashiyama)
Strengths: Machiya stock of 655 properties; average ADR of ¥45,700 sits in the high band. Shimogyo Ward’s +9.30% land-price growth adds capital-gain potential.
Boundaries: Acquisition base above ¥70M slows capital turnover. Compliance costs for cultural-property and machiya-preservation ordinances add upside risk on costs.
Osaka (Nishinari/Naniwa/Chuo)
Strengths: Deep row-house stock keeps acquisition costs at ¥30–50M. Sunset of Special-Zone Minpaku creates upside from scarcity value of “legally 365-day” operators.
Boundaries: Post–Expo 2025 demand-softening risk in Osaka. Our estimate for Chuo Ward ADR shows May 2026 YoY at -6.6%, a soft signal.
Naha (Makishi/Kumoji)
Strengths: Land prices at roughly 1/4 of Tokyo levels; Naha vacant-home subsidies available; broad Commercial Zone designations mean minimal zoning obstacles.
Boundaries: Vacancy rate is a thin 9.7%, making it hard to source suitable properties. Typhoons add upside risk to renovation costs.
Investment Judgment Summary — Three Actions During the License Consolidation Phase
First, the May 29, 2026 halt of new Special-Zone Minpaku applications is a turning point that eliminates the “last-chance license” for whole-house-rental entry in Osaka City. New entrants henceforth must go through Simple Lodging, so property selection must reliably avoid the fire-safety and building-confirmation thresholds (200㎡ and single-staircase) to secure investment success.
Second, on a three-city IRR comparison, Osaka (12.4%) leads on relative capital-deployment efficiency, but absolute levels across all three cities substantially exceed conventional hotel investment yields (5–8%). Depending on risk tolerance, investors can choose Kyoto (stable capital-gain), Osaka (turnover-focused), or Naha (subsidy leverage and land-price appreciation potential).
Third, this analysis is a simplified estimate through the GOP level; net IRR after depreciation, borrowing costs, and income tax will be lower. Renovation costs can swing upward by 20–30% depending on structural survey results for used properties, so a due-diligence budget at acquisition (roughly ¥1–2M for architect and administrative-scrivener fees) must be secured.
⚠ Note on Investment Estimates: The IRR, GOP, and revenue estimates in this article are simplified projections based on MetroEngines Research’s tracked OTA public price data, estimated OCC, and public information. Actual investment decisions require a detailed feasibility study including architect surveys of individual properties, administrative-scrivener verification of change-of-use eligibility, and tax-advisor calculation of net-of-depreciation and net-of-financing-cost returns.
References & Sources
■ Data Sources
Ministry of Internal Affairs and Communications 2023 Housing & Land Statistics Survey (vacancy rates, national rankings) / Ministry of Land, Infrastructure, Transport and Tourism Minpaku Portal (cumulative and discontinuation filings for the Residential Lodging Business) / Ministry of Land, Infrastructure, Transport and Tourism Official Land Prices (2026, three cities’ commercial districts) / Japan Tourism Agency Overnight Travel Statistics Survey (OCC and ADR by band) / MetroEngines Research & Consulting aggregated data (three-city whole-house-rental OTA price bands, by room count). Data reflect the latest May 2026 values; vacancy statistics based on the 2023 survey.
■ Estimate Assumptions
Five-room whole-house-rental single-family target. Acquisition assumptions: Kyoto ¥45M / Osaka ¥32M / Naha ¥18M (40-year-old wood construction, change-of-use eligible). Renovation cost: 40–90% of acquisition cost under Ryokan Act standards (fire safety, seismic, plumbing). Operating assumptions: 365-day year-round operation; ADR at each city’s mid-band (Kyoto ¥28,000 / Osaka ¥22,000 / Naha ¥18,000); OCC mid-band based on each city’s actual annual average. IRR is calculated over a 10-year hold under three scenarios: upside (ADR +15%, OCC +10pt), mid (base), and downside (ADR -15%, OCC -10pt).
■ Limitations & Cautions
This analysis is a quantitative framework limited to a five-room whole-house-rental model. Note: (1) Individual property zoning, road-frontage conditions, and fire-department consent can move renovation costs by ±30%; (2) Subsidy allocation is not guaranteed and depends on application year and quota; (3) Ongoing review of the 180-day cap under the Residential Lodging Business Act could become a future regulatory factor; (4) ADR bands are sensitive to inbound-demand trends and FX. Investment decisions require property-level site inspection and administrative consultation.
■ Market Data
- MetroEngines Research & Consulting — OTA public price data (N=monthly aggregation), estimated OCC, small whole-house-rental supply aggregation
■ Government Statistics & Public Data
- Ministry of Internal Affairs and Communications 2023 Housing & Land Statistics Survey (Basic Housing and Household Aggregation, Final Results)
- Okinawa Prefecture Planning Department Statistics Division, 2023 Housing & Land Statistics Survey Okinawa Results Summary
- Ministry of Land, Infrastructure, Transport and Tourism Minpaku Portal “minpaku” — Residential Lodging Business Act Implementation Status
- Ministry of Land, Infrastructure, Transport and Tourism Minpaku Portal — Overview of the Residential Lodging Business Act (Minpaku New Law)
- Kyoto City Land Prices & Official Land Prices (2026)
- Osaka City Land Prices & Official Land Prices (2026)
- Naha City Land Prices & Official Land Prices (2026)
■ Municipality & License-Related
- Kyoto City FY2025 Vacant-Home Reuse & Circulation Subsidy
- Kyoto City Minpaku Portal — Status of Lodging Facilities in Kyoto
- Travel Voice — Osaka City Officially Confirms End of Special-Zone Minpaku New Applications (November 28, 2025)
- Commons Real Estate — Commentary on the Halt of New Special-Zone Minpaku Applications
- Tabilmo — What is Special-Zone Minpaku? Target Areas, Requirements, and Differences from Minpaku New Law (2026 Update)
- Tabilmo — Guide to Subsidies Available for Minpaku Businesses (2026 Edition)
■ Industry & Regulatory
- innto — Permits Required for Hostel Openings (Building Standards Act, Ryokan Act, Fire Service Act)
- BCM — Fire Service Act and Actual Cost of Fire-Safety Equipment for Minpaku License Applications
- Ryokan License Application Support — Simple Lodging Business Application Process
- Invincible Investment Corporation Monthly Operating Results (GOP margin reference: 38.9%, December 2024)