

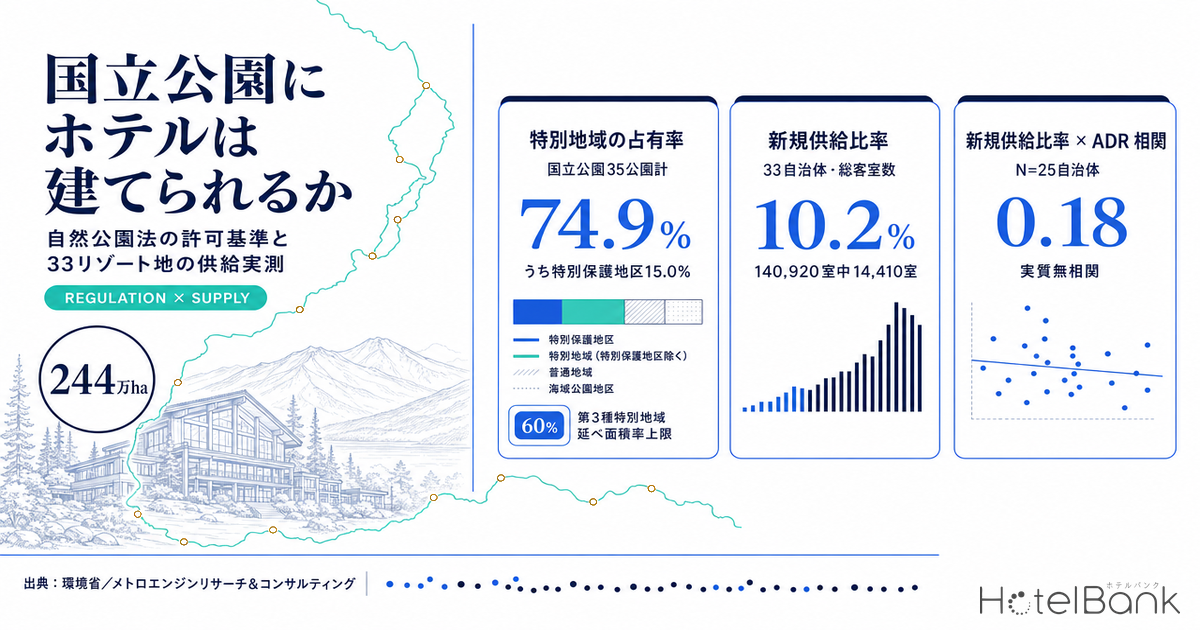
When you look for a site for a resort hotel, the first map you open is not the zoning map. It is the Ministry of the Environment’s park-area map. Inside a National Park or Quasi-National Park, a layer sits above the building rules that govern a structure’s shape — a layer that decides whether you may operate that business in that place at all. That layer is the park plan and the authorization to execute a park project under the Natural Parks Act. Lock up a site without checking it and the deal can fail before design work even begins.
This article cross-references the land-classification breakdown of Japan’s 35 National Parks — roughly 2,447,855 hectares (Ministry of the Environment, as of April 10, 2026) — against supply data for 33 resort municipalities that host National Parks, covering 140,920 rooms in total, and quantifies what the regulation actually does to supply and to room rates. The conclusion up front: regulation reliably shuts off supply, but it does not guarantee a high rate. Developers, funds and regional banks each need to check things in a different order.
How this differs from our earlier regulation series
The rules we have covered so far — zoning districts, floor-area ratios and absolute height limits, scenic districts, forest-land development permits (over 1 ha, residual forest ratio), the Embankment Regulation Act, special landslide-hazard zones, and height restrictions under the Civil Aeronautics Act — all constrain how you build. The site is assumed to be usable, and what is limited is form, height and earthwork method.
The Natural Parks Act belongs to a different family. In a location where an accommodation business is not designated in the park plan, you cannot execute a lodging business at all. It is not a question of form but of project authorization, and the regulatory layer sits one level higher. The two are not alternatives but stack on top of each other: inside a park area you must clear the Natural Parks Act layer first, and the Building Standards Act layer and below still apply separately.
Metric Definitions Used in This Article
- ADR (average daily rate): an estimated transacted rate (tax-excluded equivalent) calculated by applying a category-specific adjustment coefficient to the lowest publicly listed plan rate each property posts on OTAs (double occupancy, per-room rate, tax included). Cross-checked against per-property results disclosed by listed hotel REITs (91 properties, most recent three months), the median error is about 7%. These are estimates and differ from each property’s actual transacted prices and accounting figures. Area-level ADR is the median of the properties covered (the level of a typical property in that area).
- OCC (occupancy rate): sold rooms as a share of total rooms in the area (an estimate based on inventory offered for sale on OTAs). Because it is estimated from how listed OTA inventory is taken up, it differs from a property’s actual overall occupancy.
- New-supply ratio: rooms at properties confirmed to have opened since 2020, as a share of total rooms confirmed in operation in each municipality.
- Data sources: MetroEngines Research & Consulting / Ministry of the Environment / e-Gov Japanese Law Search
- — Two regulatory layers: whether an accommodation business is designated in the park plan (the project layer) and whether a given act is permitted (the regulatory layer) are judged separately. Before confirming that a site is legally buildable, confirm that you can execute the business there.
- — A 60% gross floor-area ratio is the ceiling in a Class 3 Special Zone. A 1,000 sqm site yields roughly 17 rooms (at 35 sqm per room including common areas), so a model that recovers its cost through room count is structurally unworkable.
- — New-supply ratio of 10.2%: of 140,920 rooms across 33 resort municipalities, 14,410 have opened since 2020. The bottom five municipalities have turned over just 1.6% of their stock in six years.
- — Correlation of 0.18: new-supply ratio and estimated transacted ADR are essentially uncorrelated. Regulation stops supply but does not guarantee rate; scarcity converts into a premium only where demand-side conditions are also in place.
- — REIT ownership is 1.45%: against 140,920 rooms in the 33 municipalities, seven listed REITs hold 20 properties and 2,037 rooms (acquisition prices totaling ¥91,279 million). Most of the stock sits with individuals and local capital.
The Natural Parks Act has two layers — the project and the act are judged separately
The legal layers that bite when you build or acquire a hotel in a National Park fall broadly into two. They are easily confused, but the reviewing authority and the criteria are different things.
The first is the “project layer.” Article 2 of the Natural Parks Act defines a park plan as “a plan concerning the regulations or projects for the protection or use of a National Park or Quasi-National Park,” and a park project as “a project executed on the basis of a park plan.” An accommodation business is one type of park project, and under Article 9 it is decided by the Minister of the Environment after hearing the opinion of the Central Environment Council. Article 10(1) then provides that “National Park projects shall be executed by the State,” while Article 10(3) provides that “persons other than the State and public entities may, as provided by Ministry of the Environment ordinance, execute part of a National Park project with the authorization of the Minister of the Environment.”
In other words, for a private operator to run an accommodation business inside a National Park, two things must hold: (1) an accommodation business must be designated for that location in the park plan, and (2) the operator must obtain the Minister’s authorization to execute it. Where the park plan does not designate an accommodation business, acquiring the site does not let you run one. This is what needs checking before site acquisition, not after.
The second is the “act-regulation layer.” Article 20(3) requires, for 18 categories of act within a Special Zone — including “newly building, rebuilding or extending a structure” — permission from the Minister of the Environment in National Parks and from the prefectural governor in Quasi-National Parks. Article 21(3) imposes stricter controls within Special Protection Zones, and Article 33(1) makes new construction of “structures exceeding standards specified by Ministry of the Environment ordinance” in Ordinary Zones subject to notification.
These two layers are independent. Authorization to execute a park project does not get you a building if you fail the permit criteria, and meeting the permit criteria does not let you execute a project that is not in the park plan. Due diligence has to confirm both, separately.
Source: prepared by MetroEngines Research & Consulting from Ministry of the Environment, “Area by Land Classification, National Parks” (as of April 10, 2026)
Land-classification mixes vary enormously from park to park. Across all 35 National Parks, Special Zones account for 74.9% (of which Special Protection Zones are 15.0%) and Ordinary Zones for 25.1% — but in Chubusangaku National Park, Special Protection Zones alone are 36.8% and Ordinary Zones only 13.1%. In Yakushima National Park, Ordinary Zones are 0.3% (65 ha), meaning that in practice the entire park is Special Zone. At the other end, Ordinary Zones make up 51.1% of Nikko National Park and 52.2% of Joshinetsu-Kogen National Park. “It’s inside a National Park, so you can’t build” does not hold; the judgment has to be made from the land classification on the area map, not from the park’s name. Five parks — Shiretoko, Oze, Myoko-Togakushi Renzan, Hakusan and Minami Alps — have zero hectares of Ordinary Zone, with every part of their area designated as Special Zone.
Quantitative requirements by land classification — even a Class 3 Special Zone caps gross floor-area ratio at 60%
The permit criteria for regulated acts are written out numerically in Article 11 of the Enforcement Regulation of the Natural Parks Act and in the Ministry of the Environment’s “Review Guidelines for Various Acts within National Parks” (Kanjiki No. 570 of November 20, 1974; revised by Kanjiho No. 657 of November 14, 1990). The numbers that matter to a developer are these.
| Land classification | New general buildings | Main quantitative requirements |
|---|---|---|
| Special Protection Zone | Not permitted in principle | Not permitted unless there is a public-interest necessity such as academic research (public benefit) and the purpose cannot be achieved anywhere else (unavoidability) |
| Class 1 Special Zone | Not permitted in principle | As above (except where public benefit and unavoidability are recognized) |
| Class 2 Special Zone | Permitted if criteria are met | Height 13 m or less / building footprint 2,000 sqm or less / ground slope 30% or less / site area 1,000 sqm or more (cluster villas, recreation facilities) / setbacks of at least 20 m from the shoulder of a park-project road, 5 m from other roads and 5 m from site boundaries / building coverage and gross floor-area ratios of 10% and 20% on sites under 500 sqm, 15% and 30% from 500 to under 1,000 sqm, and 20% and 40% at 1,000 sqm or more |
| Class 3 Special Zone | Permitted if criteria are met | As above, with building coverage of 20% or less and gross floor-area ratio of 60% or less / buildings within subdivided lots limited to two storeys and 10 m in height / cluster villas require at least 250 sqm of site area per unit |
| Ordinary Zone | Notification | Buildings require notification where height exceeds 13 m or gross floor area exceeds 1,000 sqm (Article 14 of the Enforcement Regulation). For solar power facilities the threshold is a combined horizontal projected area of 1,000 sqm |
Source: prepared by MetroEngines Research & Consulting from the Enforcement Regulation of the Natural Parks Act (e-Gov Japanese Law Search) and the Ministry of the Environment’s “Review Guidelines for Various Acts within National Parks” and “Outline of Permit Criteria for Various Acts within Special Zones of National and Quasi-National Parks”
Set these numbers beside our earlier zoning series and the difference in regulatory intensity is an order of magnitude. In urban commercial districts a floor-area ratio of 400–700% is common, and a limited-service hotel by a station builds its economics by using that volume up. Against that, the gross floor-area ratio ceiling is 60% in a Class 3 Special Zone and 40% in a Class 2 Special Zone. Being able to build only 600 sqm of floor area on a 1,000 sqm site (Class 3) means that, at 25 sqm guest rooms and 35 sqm per room including common areas, a 1,000 sqm site yields about 17 rooms. A 13 m height limit caps you at roughly four storeys, so stacking floors is not available as a workaround either. Note that outside park areas too, sites beyond the urbanization promotion area are governed on the same schedule-defining basis by development permits and farmland conversion (see 61% of 2026 openings are outside urbanization promotion areas).
This constraint structurally determines the business model for resort development. A model that recovers cost through room count does not work; only a model that recovers through rate and length of stay remains. That accommodation inside National Parks skews small and expensive is a consequence of the regulation, not a preference of operators. Put the other way round: a brand or operator that cannot compete in that band cannot run a site inside a park even after acquiring it.
Room counts back-solved from the regulatory ceilings — sensitivity on site area x land classification
The “17 rooms on 1,000 sqm” above is a single point estimate on mid-case assumptions. For an investment decision it is faster to see, as a surface, which of the two variables — site scale or land classification — does the work. What follows mechanically applies the upper limits in the permit criteria (building coverage 20% or less, gross floor-area ratio 40% for Class 2 and 60% for Class 3, building footprint 2,000 sqm or less, height 13 m or less) to a site area and divides by 35 sqm per room including common areas. These are not figures from real projects; read them as an upper-bound guide back-solved from the regulation.
| Site area | Class 2 Special Zone gross floor area (40%) |
Class 2 rooms |
Class 3 Special Zone gross floor area (60%) |
Class 3 rooms |
|---|---|---|---|---|
| 1,000 sqm | 400 sqm | 11 rooms | 600 sqm | 17 rooms |
| 2,000 sqm | 800 sqm | 22 rooms | 1,200 sqm | 34 rooms |
| 3,000 sqm | 1,200 sqm | 34 rooms | 1,800 sqm | 51 rooms |
| 5,000 sqm | 2,000 sqm | 57 rooms | 3,000 sqm | 85 rooms |
| 10,000 sqm | 4,000 sqm | 114 rooms | 6,000 sqm | 171 rooms |
Source: MetroEngines Research & Consulting estimate from the quantitative requirements in Article 11 of the Enforcement Regulation of the Natural Parks Act and the Ministry of the Environment’s “Review Guidelines for Various Acts within National Parks”
Two things stand out. First, the gap between Class 2 and Class 3 is a consistent 1.5x (40% versus 60% gross floor-area ratio) — move one step in land classification and the rooms you can take from the same site shift by half. Second, on a 10,000 sqm site, using up the 20% building coverage gives a 2,000 sqm footprint, which exactly matches the footprint cap in the permit criteria. Beyond that site size the binding constraint is no longer the ratio but the absolute 2,000 sqm limit, and combined with the 13 m height limit (roughly four storeys) gross floor area tops out at about 8,000 sqm, or around 228 rooms. Inside a park area, taking a larger site does not buy you economies of scale.
Next, flex the estimate’s most sensitive input: area per room including common space. The more generously you size guest rooms to resort specification and the heavier you build out restaurants, spa and large communal baths, the fewer rooms the same gross floor area yields.
| Scenario | Area per room (incl. common areas) |
1,000 sqm site | 3,000 sqm site | 5,000 sqm site | Likely format |
|---|---|---|---|---|---|
| Optimistic | 30 sqm | 20 rooms | 60 rooms | 100 rooms | Rooms-focused with common areas pared back. Expectations for dining and bathing run high inside parks, so the room for this is limited |
| Mid | 35 sqm | 17 rooms | 51 rooms | 85 rooms | Standard resort hotel. The assumption used in the body of this article |
| Pessimistic | 45 sqm | 13 rooms | 40 rooms | 66 rooms | High-rate format with guest rooms above 40 sqm plus substantial common areas — large baths, restaurants and so on |
Source: as above (rough estimate dividing gross floor area by area per room; fractions discarded)
The spread is not small. On identical conditions — a 3,000 sqm site in a Class 3 Special Zone — the answer runs from 40 to 60 rooms, a 50% range, depending on how common areas are handled. Skip the volume study on a park-area project and build the financials first, and that spread becomes the error in your business plan. Taken together with the data in the preceding sections: the room ceiling is set by regulation, and the rate is set by demand. Both are variables to be pinned down before the site-acquisition decision, and reversing that order is not recoverable.
Has supply really stopped? Stock turnover across 33 municipalities and 140,920 rooms
From here we test it against data. For 33 resort municipalities nationwide that host National Parks or Quasi-National Parks, we aggregated total rooms at accommodation properties confirmed to be operating, and rooms at properties confirmed to have opened since 2020. Against 140,920 rooms in total, 14,410 have opened since 2020 — a ratio of 10.2%. The dispersion between municipalities, however, is extreme.
| Municipality | Associated natural park | Total rooms | Rooms opened since 2020 |
New-supply ratio | Est. transacted ADR (July 2026) |
Est. occupancy (August 2026) |
|---|---|---|---|---|---|---|
| Noboribetsu City | Shikotsu-Toya | 1,459 | 4 | 0.3% | ¥17,700(N=15) | — |
| Kamikawa Town | Daisetsuzan | 1,615 | 8 | 0.5% | ¥8,200(N=11) | — |
| Kokonoe Town | Aso-Kuju | 1,383 | 14 | 1.0% | ¥15,200(N=44) | 92.9% |
| Toyako Town | Shikotsu-Toya | 1,555 | 28 | 1.8% | ¥14,400(N=15) | — |
| Yamanouchi Town | Joshinetsu-Kogen | 7,376 | 162 | 2.2% | ¥11,000(N=97) | — |
| Minamioguni Town | Aso-Kuju | 1,060 | 35 | 3.3% | ¥25,900(N=47) | 78.8% |
| Shimoda City | Fuji-Hakone-Izu | 3,376 | 123 | 3.6% | ¥14,600(N=55) | — |
| Yakushima Town | Yakushima | 1,293 | 46 | 3.6% | ¥12,600(N=14) | — |
| Fuefuki City | — | 2,962 | 109 | 3.7% | ¥12,500(N=51) | — |
| Taketa City | Aso-Kuju | 674 | 28 | 4.2% | ¥8,100(N=20) | — |
| Hakuba Village | Chubusangaku | 9,240 | 426 | 4.6% | ¥11,700(N=44) | — |
| Gero City | — | 2,667 | 133 | 5.0% | ¥14,200(N=49) | — |
| Aso City | Aso-Kuju | 1,831 | 134 | 7.3% | ¥19,100(N=25) | 87.6% |
| Ibusuki City | Kirishima-Kinkowan | 1,802 | 132 | 7.3% | ¥14,100(N=18) | — |
| Nikko City | Nikko | 8,664 | 651 | 7.5% | ¥15,200(N=116) | 90.2% |
| Teshikaga Town | Akan-Mashu | 1,175 | 88 | 7.5% | ¥10,100(N=13) | — |
| Fujikawaguchiko Town | Fuji-Hakone-Izu | 7,004 | 540 | 7.7% | ¥15,400(N=73) | — |
| Yamanakako Village | Fuji-Hakone-Izu | 4,478 | 344 | 7.7% | ¥9,600(N=32) | — |
| Yugawara Town | Fuji-Hakone-Izu | 1,891 | 152 | 8.0% | ¥17,500(N=55) | 87.7% |
| Hakone Town | Fuji-Hakone-Izu | 9,912 | 934 | 9.4% | ¥23,300(N=187) | 90.5% |
| Yufu City | Aso-Kuju | 2,756 | 279 | 10.1% | ¥19,700(N=142) | 85.9% |
| Nasu Town | Nikko | 5,713 | 586 | 10.3% | ¥17,900(N=53) | — |
| Ito City | Fuji-Hakone-Izu | 7,645 | 799 | 10.5% | ¥17,400(N=127) | 88.8% |
| Kirishima City | Kirishima-Kinkowan | 3,686 | 414 | 11.2% | ¥14,000(N=57) | — |
| Matsumoto City | Chubusangaku | 6,821 | 886 | 13.0% | ¥13,100(N=107) | 97.5% |
| Atami City | Fuji-Hakone-Izu | 6,342 | 864 | 13.6% | ¥21,900(N=106) | 92.6% |
| Karuizawa Town | Joshinetsu-Kogen | 5,263 | 751 | 14.3% | ¥24,700(N=50) | 95.8% |
| Beppu City | Aso-Kuju | 8,577 | 1,398 | 16.3% | ¥13,700(N=123) | 88.3% |
| Takayama City | Chubusangaku | 9,480 | 1,588 | 16.8% | ¥15,200(N=140) | — |
| Furano City | — | 2,343 | 400 | 17.1% | ¥24,500(N=13) | — |
| Minamiaso Village | Aso-Kuju | 1,305 | 224 | 17.2% | ¥23,900(N=17) | — |
| Nasushiobara City | Nikko | 4,443 | 842 | 19.0% | ¥12,500(N=69) | 92.5% |
| Kutchan Town | Niseko-Shakotan-Otaru Kaigan (Quasi-National) | 5,129 | 1,288 | 25.1% | ¥17,500(N=22) | — |
Source: MetroEngines Research & Consulting (room counts and opening years based on confirmed OTA listings; ADR is July 2026 and N is the number of properties covered; estimated occupancy is based on August 2026 OTA listed inventory. “—” indicates too few properties covered to publish a figure)
Source: MetroEngines Research & Consulting (based on confirmed OTA listings, N=33 municipalities, 140,920 rooms)
At the bottom, Noboribetsu City has added just 4 rooms since 2020 against total stock of 1,459 (0.3%); Kamikawa Town 8 rooms against 1,615 (0.5%); and Kokonoe Town 14 rooms against 1,383 (1.0%). In every case these are municipalities whose main accommodation cluster overlaps a National Park’s use base (a group facility district or similar). Noboribetsu Onsen and Toyako Onsen lie within Shikotsu-Toya National Park, Sounkyo within Daisetsuzan National Park, Handa Kogen within Aso-Kuju National Park, and Shiga Kogen within Joshinetsu-Kogen National Park. The bottom five municipalities — Noboribetsu City, Kamikawa Town, Kokonoe Town, Toyako Town and Yamanouchi Town — hold 13,388 rooms between them, but new supply since 2020 amounts to 216 rooms, a ratio of 1.6%.
By contrast, at the top, Kutchan Town is at 25.1%, Nasushiobara City 19.0%, Minamiaso Village 17.2%, Furano City 17.1% and Takayama City 16.8% — turning over roughly a fifth of their room stock in six years. That gap is not a gap in demand; it is a gap in how far the supply side can move.
A note on the aggregation: this article does not sort municipalities into “inside the park” and “outside the park.” Municipal boundaries and park boundaries do not coincide, and a single municipality can contain Special Protection Zones, Special Zones, Ordinary Zones and land outside the park all at once. The “associated natural park” column indicates the park that the municipality’s representative accommodation cluster relates to; it does not mean the entire municipality is park area. The supply data is an aggregation of properties whose OTA listings MetroEngines Research & Consulting was able to confirm; ryokan, minshuku and simple lodging houses not listed on OTAs are excluded. It is not a complete census.
Source: MetroEngines Research & Consulting (new-supply ratio based on confirmed OTA listings; ADR is July 2026, for the 25 municipalities with 20 or more properties covered)
Stopping supply does not lift the rate — a correlation of 0.18
This is the core of the article. The intuition that “hard to build means supply is fixed means a scarcity premium” is not supported by the data.
Across the 25 municipalities with 20 or more properties in the ADR estimate, the correlation between new-supply ratio and estimated transacted ADR for July 2026 is 0.18 — effectively no correlation. The 12 municipalities below the median new-supply ratio (8.0%) have a median ADR of about ¥14,400, while the 13 at or above 8.0% come in at about ¥17,500: if anything, the places where supply is moving carry the higher rate.
Looked at individually the structure is clear. Kamikawa Town, with a new-supply ratio of 0.5%, has an estimated transacted ADR of about ¥8,200; Taketa City, at 4.2%, about ¥8,100. Meanwhile Kutchan Town at 25.1% runs about ¥17,500, Karuizawa Town at 14.3% about ¥24,700, and Atami City at 13.6% about ¥21,900. About the only municipality with frozen supply and a high rate is Minamioguni Town (3.3% new supply, about ¥25,900), and that is because Kurokawa Onsen stands there as a strong demand-side brand.
Translated into investment terms, it comes to this. The Natural Parks Act reliably closes the valve on the supply side, but that alone does not form a price. Scarcity converts into a premium only where demand-side conditions — access (time from a Shinkansen station, expressway or airport), recognition, year-round usability — are also in place. The argument that “the regulation is strict, so values will rise” does not hold up when used without demand-side support. Conversely, places where demand is strong and supply is closed — Minamioguni Town, Hakone Town, Nasu Town — have a structure that new entrants are unlikely to break, which makes them prone to competitive bidding.
On estimated occupancy, the demand floor is solid
Even in municipalities where rates are not growing, demand itself is not weak. On estimated occupancy for August 2026 (based on OTA listed inventory), 12 of the 13 municipalities for which a figure could be compiled exceed 85% — the sole exception being Minamioguni Town at 78.8%.
Source: MetroEngines Research & Consulting (August 2026, estimated from OTA listed inventory)
Matsumoto City at 97.5%, Karuizawa Town at 95.8%, Kokonoe Town at 92.9%, Atami City at 92.6% and Nasushiobara City at 92.5% — inventory is thin at the summer peak. Even Kokonoe Town, where supply is not moving, sits at 92.9%, which tells us demand is not thinning out. There are municipalities where demand exists but is not being converted into rate — and that is better read not as an operational problem at the property level, but as a consequence of the physical plant (room size, building age, facilities) being hard to renew, on both the regulatory and the capital side.
What is happening in the acquisition market — property data from listed REITs
In a market where new development is difficult, acquiring existing properties becomes the main arena for capital. Cross-referencing all 302 properties held by seven listed hotel REITs (ownership master, snapshot as of August 31, 2026) against the 33 municipalities covered here returns 20 properties. They are listed below from most to least recently acquired.
| Acquired | Municipality | Property | REIT | Rooms | Acquisition price | Per room |
|---|---|---|---|---|---|---|
| 2025-08 | Kirishima City | Kirishima Kokusai Hotel (霧島国際ホテル) | Invincible Investment Corporation (インヴィンシブル投資法人) | 165 | ¥6,534m | ¥39.6m |
| 2024-07 | Ito City | Kamenoi Hotel Izu-Kogen (亀の井ホテル 伊豆高原) | Invincible Investment Corporation (インヴィンシブル投資法人) | 55 | ¥5,563m | ¥101.1m |
| 2021-12 | Kirishima City | Kai Kirishima (界 霧島) | Hoshino Resorts REIT (星野リゾート・リート投資法人) | 49 | ¥3,913m | ¥79.9m |
| 2021-12 | Beppu City | Kai Beppu (界 別府) | Hoshino Resorts REIT (星野リゾート・リート投資法人) | 68 | ¥7,335m | ¥107.9m |
| 2020-01 | Karuizawa Town | BEB5 Karuizawa (BEB5軽井沢) | Hoshino Resorts REIT (星野リゾート・リート投資法人) | 73 | ¥2,170m | ¥29.7m |
| 2017-12 | Nikko City | Ooedo Onsen Monogatari Premium Kinugawa Kanko Hotel (大江戸温泉物語Premium 鬼怒川観光ホテル) | Japan Hotel & Residential Investment Corporation (日本ホテル&レジデンシャル投資法人) | 172 | ¥3,870m | ¥22.5m |
| 2017-10 | Beppu City | Kamenoi Hotel Beppu (亀の井ホテル 別府) | Invincible Investment Corporation (インヴィンシブル投資法人) | 322 | ¥8,870m | ¥27.5m |
| 2016-09 | Ito City | Ooedo Onsen Monogatari Premium Ito Hotel New Okabe (大江戸温泉物語Premium 伊東ホテルニュー岡部) | Japan Hotel & Residential Investment Corporation (日本ホテル&レジデンシャル投資法人) | 73 | ¥2,657m | ¥36.4m |
| 2016-09 | Atami City | Ooedo Onsen Monogatari Premium Atami (大江戸温泉物語Premium あたみ) | Japan Hotel & Residential Investment Corporation (日本ホテル&レジデンシャル投資法人) | 76 | ¥3,000m | ¥39.5m |
| 2016-03 | Nasu Town | Hotel Epinard Nasu (ホテルエピナール那須) | Invincible Investment Corporation (インヴィンシブル投資法人) | 310 | ¥21,002m | ¥67.7m |
| 2015-11 | Nikko City | Kai Kinugawa (界 鬼怒川) | Hoshino Resorts REIT (星野リゾート・リート投資法人) | 48 | ¥3,080m | ¥64.2m |
| 2014-05 | Fuefuki City | Comfort Inn Kofu Isawa (コンフォートイン 甲府石和) | Hoshino Resorts REIT (星野リゾート・リート投資法人) | 91 | ¥658m | ¥7.2m |
| 2014-05 | Karuizawa Town | Comfort Inn Karuizawa (コンフォートイン 軽井沢) | Hoshino Resorts REIT (星野リゾート・リート投資法人) | 89 | ¥812m | ¥9.1m |
| 2013-07 | Karuizawa Town | Hoshinoya Karuizawa (星のや軽井沢) | Hoshino Resorts REIT (星野リゾート・リート投資法人) | 77 | ¥7,600m | ¥98.7m |
| 2013-07 | Fujikawaguchiko Town | Hoshinoya Fuji (星のや富士) | Hoshino Resorts REIT (星野リゾート・リート投資法人) | 40 | ¥4,160m | ¥104.0m |
| 2013-07 | Matsumoto City | Kai Matsumoto (界 松本) | Hoshino Resorts REIT (星野リゾート・リート投資法人) | 26 | ¥615m | ¥23.7m |
| 2013-07 | Ito City | Kai Ito (界 伊東) | Hoshino Resorts REIT (星野リゾート・リート投資法人) | 30 | ¥670m | ¥22.3m |
| 2013-07 | Hakone Town | Kai Hakone (界 箱根) | Hoshino Resorts REIT (星野リゾート・リート投資法人) | 34 | ¥950m | ¥27.9m |
| 2013-07 | Atami City | Risonare Atami (リゾナーレ熱海) | Hoshino Resorts REIT (星野リゾート・リート投資法人) | 81 | ¥3,750m | ¥46.3m |
| 2006-10 | Hakone Town | Hakone Gora Onsen Kinoyu Setsugetsuka (箱根強羅温泉 季の湯 雪月花) | Japan Hotel REIT Investment Corporation (ジャパン・ホテル・リート投資法人) | 158 | ¥4,070m | ¥25.8m |
Source: prepared by MetroEngines Research & Consulting from an ownership master built on each REIT’s disclosures (snapshot as of August 31, 2026; 20 of N=302 properties matched)
Among recent acquisitions, Invincible Investment Corporation’s purchase of Kirishima Kokusai Hotel in August 2025 (165 rooms, ¥6,534m, ¥39.6m per room) and the same REIT’s purchase of Kamenoi Hotel Izu-Kogen in July 2024 (55 rooms, ¥5,563m, ¥101.1m per room) show capital moving toward mid-sized properties in resort locations. Per-room pricing varies widely with property grade and location: Kai Kirishima (49 rooms, ¥3,913m) comes to ¥79.9m and Hoshinoya Karuizawa (77 rooms, ¥7,600m) to ¥98.7m.
By owner, 12 of the 20 properties are held by the resort-focused Hoshino Resorts REIT, followed by Invincible Investment Corporation with 4, Japan Hotel & Residential Investment Corporation with 3, and Japan Hotel REIT Investment Corporation with 1. Acquisition prices total ¥91,279 million.
That said, this is 20 properties out of 302, and against 140,920 total rooms in the municipalities covered, REIT holdings are 2,037 rooms, or 1.45%. Most of the accommodation stock in park areas remains in the hands of individuals and local capital, and the listed-REIT ownership share is strikingly low compared with urban markets. The competitive bidding is happening in that thin top layer. Where the buyer is foreign capital, note that separately from the Natural Parks Act, foreign-investor rules on hotel acquisition and the notification duties in special watch zones land on the closing schedule.
Park areas and the supply-turnover map
The map below shows where the 33 municipalities sit and how room scale relates to new-supply ratio. Circle size is total rooms; color is the new-supply ratio since 2020.
Source: prepared by MetroEngines Research & Consulting
The Shikotsu-Toya, Daisetsuzan and Akan-Mashu areas in Hokkaido, the western side of Aso-Kuju in Kyushu (Kokonoe Town, Minamioguni Town) and Shiga Kogen (Yamanouchi Town) line up in dark blue — low turnover. In each case the park’s use base sits at the center of the accommodation cluster. Municipalities whose accommodation clusters sit outside or on the fringe of the park area — Kutchan Town, Furano City, Nasushiobara City, Takayama City, Beppu City — shift toward the lighter colors.
How far has the policy tailwind actually changed practice?
The Ministry of the Environment has run the National Park Enjoyment Project since 2016, and on March 31, 2026 it published its “Policy Direction from 2026 Onward.” The policy rests on three pillars: (1) delivering attractive stay experiences unique to National Parks, (2) strengthening brand power and promotion for both communities and visitors, and (3) contributing to local areas by realizing a virtuous cycle of protection and use. The first pillar explicitly states that the Ministry will “examine the operation of relevant systems and the revision of plans in light of private-sector proposals, in order to further promote private investment,” and adds that it will “also consider approaches to preventing new buildings from being abandoned.” It is positioned as the final push toward the 2031 centenary of Japan’s National Park system. How far the scope for accommodation businesses may open up varies park by park, and has to be read against each park’s own plan.
On the institutional side, the 2021 amendment to the Natural Parks Act is what bites in practice. Article 16-2 established councils involving municipalities and operators, and Article 16-3 introduced a framework for drawing up a “use-base development and improvement plan” and obtaining the Minister of the Environment’s certification for it. Such a plan records the development and improvement of facilities relating to park projects, and by incorporating the required items into the plan, projects that would need consultation and authorization under Article 10 can be processed through a single integrated procedure. Furthermore, under Articles 8-2 and 9-2, a council may propose to the Minister of the Environment a change to the park plan, or the decision or amendment of a park project itself.
The practical implication is clear. Where the old answer was “no accommodation business in the park plan, no deal,” there is now a legally provided route to work on the plan side through a council. There is no guarantee a proposal will pass, however, and it must satisfy the certification requirements: appropriate in light of the park plan, contributing to improving the quality of the use base, posing no risk of impeding protection of the park, and likely to be implemented smoothly and reliably. On timing, the process of forming a council, drawing up a plan, applying for certification and obtaining the Minister’s certification adds a lead time separate from ordinary building confirmation.
Visitor numbers have recovered too. According to the Ministry of the Environment’s survey of natural park visitors, National Parks drew 336.14 million visits in 2024, up 4.2% year on year, with natural parks overall at 808.69 million (up 2.5%). The most-visited is Fuji-Hakone-Izu National Park at 124.18 million, or 36.9% of all National Park visits. The volume of demand is extremely concentrated in parks close to the Tokyo metropolitan area, and that concentration maps onto the ADR gaps seen in the previous section.
A practical checklist — developers, funds, regional banks
The order of checks and the points at issue change with the reader’s position.
Developers (before site acquisition)
(1) Fix the land classification on the park-area map (new general buildings are in principle not permitted in Special Protection Zones and Class 1 Special Zones). (2) Confirm with the nearest Nature Conservation Office, through pre-application consultation, whether an accommodation business is designated in the park plan. If it is not, a plan-amendment proposal via a council is required, and that period has to be built into the schedule. (3) For Class 2 or Class 3, run a rough volume study against gross floor-area ratios of 40%/60%, height 13 m, footprint 2,000 sqm, setbacks of 20 m/5 m/5 m and ground slope 30%, and fix the room ceiling before building the financials.
Funds and PE (acquiring existing assets)
(1) Confirm whether the target property holds authorization to execute a park project, and check the holder, conditions and expiry in a form that can be transferred. Transfers, mergers, splits and inheritance are all procedures with prescribed forms and must be built into the closing design. (2) Value-add plans premised on extension or rebuilding should assume passing both the Article 10 amendment procedure (authorization for substantial changes, notification for minor ones) and the act permit, and Capex and schedule should be drawn accordingly. (3) Because non-conforming existing height and footprint may be permitted up to the existing scale on rebuilding, reflect in your valuation that current volume can become the future ceiling.
Regional banks and collateral valuation
(1) Where the collateral is a park-project facility, authorization to execute the project is tied to the operator, so whether it can be transferred on disposal drives the recovery scenario. (2) Volume on rebuilding is set by the permit criteria in force and may fall short of the existing scale. Do not apply zoning-based floor-area ratios to a vacant-land valuation. (3) Areas with closed supply carry low risk of competitive entry, but without demand-side support ADR will not grow (the 0.18 correlation in this article). Look at estimated occupancy and rate levels in the collateral’s area separately.
Conclusion
The Natural Parks Act sits on a different layer from the building-related rules covered in our earlier work. If an accommodation business is not designated in the park plan, the project cannot be executed whatever the land classification. Before confirming that a site is legally buildable, you have to confirm that the business can exist there at all.
On top of that, the permit criteria impose ceilings — a 60% gross floor-area ratio even in a Class 3 Special Zone, 13 m in height, a 2,000 sqm footprint — under which a model that recovers cost through room count is structurally unworkable. That constraint reliably closes the valve on supply: in the bottom five of the 33 municipalities covered, six years of new supply amounts to 1.6% of total rooms.
But fixed supply does not guarantee rate. The correlation between new-supply ratio and estimated transacted ADR is 0.18, close to none, and municipalities with frozen supply and low ADR (Kamikawa Town, Taketa City) coexist with municipalities where supply is moving and ADR is high (Karuizawa Town, Atami City, Kutchan Town). Scarcity turns into a premium only where the demand-side conditions are in place.
With the 2021 amendment and the 2026 policy direction for the Enjoyment Project, a route now exists in law to work on the park plan and the park project themselves through a council. Projects in park areas have entered a stage where the contest is decided not by “can it be built” but by “can it be designated as a project, and how much time can you put into that.”
⚠ A note on the data: the new-opening data in this article is based on confirmed OTA listings. Because listings appear several months before opening, figures for the most recent months and years may rise as further listings are confirmed. Estimated transacted ADR and estimated occupancy are estimates based on sales inventory publicly listed on OTAs at the time of the survey, and differ from actual transacted prices and actual occupancy. Laws and permit criteria are based on the provisions in force at the time of writing (September 2026); for any specific project, always confirm with the relevant Nature Conservation Office and prefectural department.
Related reading
- Governor’s permit above 1 m of fill — how the Embankment Regulation Act changed earthwork costs and opening timing for slope resorts in 2026
- Can hotels be built in Park-PFI’s 203 parks? A 20-year permit needs ¥11,300 ADR, and half the RC structure survives
- Building Standards Act exemption ordinances exist in 31 municipalities — the Article 3(3) route to converting historic buildings into lodging
- 61% of 2026 openings are outside urbanization promotion areas — how development permits and farmland conversion change time to opening
- Foreign-investor hotel acquisition rules 2026 — 165 municipalities in special watch zones and three notification duties
- The economics of building a hotel on leased land — supportable ground rent back-solved across 9 markets, reaching 1.38x the freehold land price
- Who owns the hot spring? How proprietary sources, piped supply and centralized management split ryokan acquisition valuations
- Is glamping depreciated over 4 years or 39? A 1.0-year payback gap by asset class, and the supply picture across 1,976 facilities nationwide
References and sources
■ Legislation (primary sources)
- Natural Parks Act (Act No. 161 of 1957) — e-Gov Japanese Law Search (Articles 2, 9, 10, 16-2 to 16-5, 20, 21 and 33)
- Enforcement Regulation of the Natural Parks Act (Ministry of Health and Welfare Ordinance No. 41 of 1957) — e-Gov Japanese Law Search (Article 11 permit criteria; Article 13-18 notification of acts within Ordinary Zones; Article 14 standards for structures)
- Ministry of the Environment, “Act Partially Amending the Natural Parks Act (Act No. 29 of 2021)”
■ Ministry of the Environment materials and statistics
- Ministry of the Environment, “Nature Conservation Data Index” — “Area by Land Classification, National Parks” (as of April 10, 2026), “Outline of National Parks,” “Survey of Natural Park Visitor Numbers”
- Ministry of the Environment, “Review Guidelines for Various Acts within National Parks (excluding Ordinary Zones)” (Kanjiki No. 570 of November 20, 1974; revised by Kanjiho No. 657 of November 14, 1990)
- Ministry of the Environment, “Outline of Permit Criteria for Various Acts within Special Zones of National and Quasi-National Parks”
- Ministry of the Environment, “National Parks: Notifications and Applications — For Park Project Operators” (procedures and forms for executing National Park projects)
- Ministry of the Environment, “Publication of the National Park Enjoyment Project Policy Direction from 2026 Onward” (March 31, 2026)
- Ministry of the Environment, Nature Conservation Bureau, National Park Division, “National Park Enjoyment Project: Policy Direction from 2026 Onward — Overview” (March 2026)
- Ministry of the Environment, Nature Conservation Bureau, National Park Division, “On the Future of Accommodation Businesses in National Parks”
■ Data sources
Supply data (total rooms and opening years) is an aggregation by MetroEngines Research & Consulting of properties whose OTA listings could be confirmed (33 municipalities, 140,920 rooms, of which 14,410 opened from 2020 onward). Estimated transacted ADR is for July 2026 and estimated occupancy for August 2026, both based on OTA listed inventory. Ownership is from an ownership master built on the disclosures of seven listed hotel REITs (snapshot as of August 31, 2026, N=302 properties). Area by land classification is from the Ministry of the Environment’s “Area by Land Classification, National Parks” (as of April 10, 2026), and visitor numbers from the “Survey of Natural Park Visitor Numbers” (2024). Legislation and permit criteria are from e-Gov Japanese Law Search and Ministry of the Environment publications.
■ Estimate assumptions
The rough room-count estimates apply the quantitative requirements of Article 11 of the Enforcement Regulation of the Natural Parks Act and the Ministry of the Environment’s “Review Guidelines for Various Acts within National Parks” (building coverage 20% or less; gross floor-area ratio 40% in Class 2 Special Zones and 60% in Class 3; building footprint 2,000 sqm or less; height 13 m or less) to a site area, then divide by 35 sqm per room including common areas (30 sqm and 45 sqm in the sensitivity analysis), discarding fractions. The correlation coefficient was computed as a simple correlation between new-supply ratio and estimated transacted ADR over the 25 municipalities with 20 or more properties covered (r=0.18). The population was split at the median new-supply ratio of 8.0% and the median ADR of each half compared.
■ Limitations and caveats
Ryokan, minshuku and simple lodging houses not listed on OTAs are excluded from the aggregation; this is not a complete census. Because municipal and park boundaries do not coincide and land classifications are mixed within a single municipality, this article does not divide municipalities into inside and outside the park. Estimated transacted ADR and estimated occupancy are estimates based on OTA listed inventory and differ from actual transacted prices and actual occupancy. The room-count estimates mechanically apply the upper limits of the permit criteria; individual projects may come in lower after review of the park plan, landscape, drainage, access, buried cultural property and other factors. The correlation indicates only the strength of the association at municipality level and does not indicate causation. Legislation and permit criteria are based on the provisions in force at the time of writing (September 2026).
■ Market data
- MetroEngines Research & Consulting — room counts and opening years for 33 municipalities and 140,920 rooms (based on confirmed OTA listings), estimated transacted ADR (July 2026), estimated occupancy (August 2026, based on OTA listed inventory)
- Ownership master built on the disclosures of seven listed hotel REITs (snapshot as of August 31, 2026, N=302 properties)