

When the industry talks about hotel location, the shared vocabulary has long been “distance from the station” and “use district.” But one step before that sits a coarser — and decisive — fork in the road: which category the site falls under in the City Planning Act. Urbanization promotion area, urbanization control area, a city planning area with no urbanization districting drawn at all (non-districted), or somewhere entirely outside city planning areas. That single distinction determines what permits are required to build, and how many years pass between acquisition and opening.
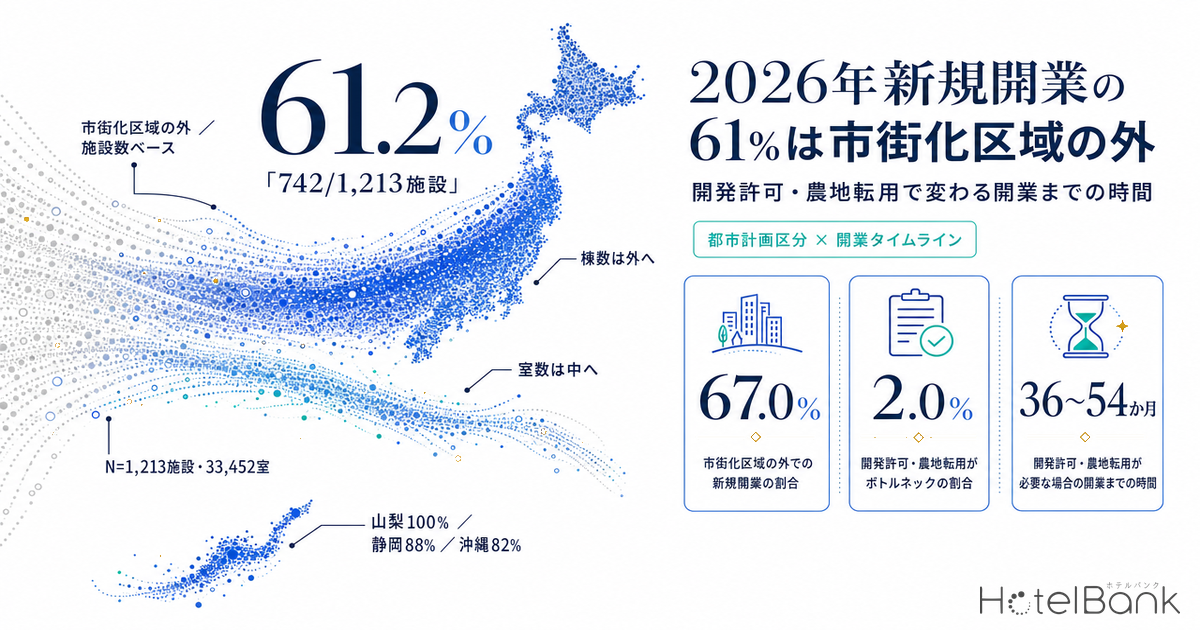
We overlaid the coordinates of the 1,213 lodging facilities that opened in Japan in 2026 onto the city planning decision data (city planning areas and urbanization districting) published by the Ministry of Land, Infrastructure, Transport and Tourism (MLIT). The result: 61.2% of facilities sit outside urbanization promotion areas. Yet measured in guest rooms, 67.0% sit inside them. Buildings drift to the regulatory periphery while rooms concentrate in the city — supply has split into two layers. This article translates that fork into the currency land acquisition teams and feasibility analysts actually use: time, and uncertainty.
Our earlier piece “Hotel Development Capacity 2026: Zoning, FAR & Land Price in 5 Markets” examined headroom in floor-area ratio within commercial districts inside urbanization promotion areas. Another, “Vacation Rentals Take 45% of Japan’s 2026 New Hotel Openings”, examined property types and business models. This article is neither: its subject is which city planning category a site sits in, and which regulatory route you must travel to build on it. It is the first time this publication has tackled urbanization control areas, development permits, and farmland conversion head-on.
Metric Definitions Used in This Article
- Planning-zone category (city planning area / urbanization districting): determined by overlaying each facility’s coordinates onto the city planning decision polygons (city planning areas and urbanization districting) provided by MLIT’s Real Estate Information Library. Four categories are used: “urbanization promotion area,” “urbanization control area,” “non-districted city planning area” (inside a city planning area but with no urbanization districting designated), and “outside city planning areas” (not contained in any such polygon).
- New openings: lodging facilities confirmed to have opened in 2026, to the extent captured by MetroEngines Research. The basis is confirmed OTA listing, so facilities not listed on OTAs are excluded. All N=1,213 facilities with verifiable coordinates were classified.
- Room count: the room count registered in the facility master. Whole-house vacation rental villas are frequently registered as “one building = one room,” so a room-count basis structurally under-weights small facilities. Readers should keep this in mind.
- Data sources: MetroEngines Research & Consulting (new-opening data) / MLIT Real Estate Information Library (city planning decision data) / MLIT “Statistical Survey on Building Construction Dynamics” (projects in planning)
- — Of the 1,213 facilities that opened in 2026, 61.2% (742) sit outside urbanization promotion areas. By room count, however, 67.0% (22,419 of 33,452 rooms) sit inside them — the conclusion flips depending on whether you count buildings or rooms.
- — The fork is driven by the site-area thresholds that trigger a development permit. Against 1,000 m² in promotion areas, 3,000 m² in non-districted areas and 1 ha outside planning areas, urbanization control areas alone have no lower threshold — every project needs a permit regardless of size, and openings in that category sink to 24 facilities (2.0%).
- — What consumes time is not the review, it is the calendar. Standard processing for a development permit runs 25–49 days and Article 5 farmland conversion 1.5–2 months, but exclusion from an agricultural land use zone is accepted only twice a year and takes about six months, stretching new-build-on-farmland projects to 36–54 months from acquisition to opening.
- — In an IRR model holding all else constant, each year of delay to opening costs roughly 0.5–0.6 points, and offsetting a two-year delay requires buying the land 19% cheaper. One year of delay trades against a 9–10% reduction in land cost.
- — Large pipeline projects are a separate cluster. Of 70 projects in planning, 63 have 100+ rooms and account for 97.3% of the rooms; 65.7% sit in designated major cities or Tokyo’s special wards and 40.0% are mixed-use. Their rate-limiting step differs entirely from small, non-urban supply.
Buildings go out, rooms stay in — the two-layer structure of supply
Start with the overall picture. Sorting the 1,213 facilities that opened in 2026 by planning-zone category gives 471 in urbanization promotion areas (38.8%), 459 in non-districted city planning areas (37.8%), 259 outside city planning areas (21.4%), and 24 in urbanization control areas (2.0%). Facilities outside urbanization promotion areas total 742, or 61.2% of the whole.
Recount the same population by guest rooms and the picture inverts. Of 33,452 total rooms, 22,419 (67.0%) are inside promotion areas, 8,361 (25.0%) in non-districted areas, 2,233 (6.7%) outside planning areas, and 439 (1.3%) in control areas. Six in ten buildings are outside, yet seven in ten rooms are inside. That is the mirror image of an obvious fact — you build big in the city and small everywhere else — but it means the conclusion about supply pressure reverses depending on which denominator you pick. The same inversion appears in our analysis of hotel supply pressure across Tokyo’s 23 wards, where Minato, first by room count, sinks to the bottom once measured against existing stock.
Slicing by size band sharpens the two-layer structure further. Of the 721 facilities with 1–4 rooms, only 30% sit inside urbanization promotion areas; non-districted areas (42%) and areas outside city planning (27%) account for the bulk. Among the 114 facilities with 100 rooms or more, by contrast, 71% are inside promotion areas and none at all are in urbanization control areas. The larger the property, the more reliably it moves toward the city — without exception.
| Size band | Facilities | Promotion area | Control area | Non-districted | Outside planning areas |
|---|---|---|---|---|---|
| 1–4 rooms | 721 | 213 (30%) | 10 (1%) | 303 (42%) | 195 (27%) |
| 5–19 rooms | 206 | 81 (39%) | 7 (3%) | 73 (35%) | 45 (22%) |
| 20–99 rooms | 172 | 96 (56%) | 7 (4%) | 57 (33%) | 12 (7%) |
| 100+ rooms | 114 | 81 (71%) | 0 (0%) | 26 (23%) | 7 (6%) |
1,213 facilities mapped nationwide, colored by planning-zone category
Plot the coordinates on a map and the planning categories trace the geography itself. Dark markers (urbanization promotion areas) cluster in the three major metropolitan regions and the regional hub cities, while pale markers (non-districted and outside planning areas) spread across the Izu Peninsula, the Fuji Five Lakes, the Yatsugatake foothills, Shinshu, the west coast of Okinawa’s main island, and inland Hokkaido. Urbanization districting is drawn over only part of Japan’s city planning areas, and most resort locations lie outside that line to begin with.
Classification is a point-in-polygon test against each facility’s registered coordinates. Where part of a site straddles a category boundary, or where coordinate precision is coarse, the result may differ from the actual category. The completeness and update cadence of city planning decision data also varies by municipality. In practice, always confirm with the competent local authority’s city planning information.
What it takes to build, category by category
Across the four categories, the procedures for building a lodging facility differ as follows. The strongest single driver is the site area at which a development permit (City Planning Act, Article 29) becomes mandatory, which varies widely by category: 1,000 m², 3,000 m², 1 ha — or no threshold at all.
| Planning-zone category | Size triggering a development permit | Additional location-based permit | Road-frontage requirement (Building Standards Act, Art. 43) |
|---|---|---|---|
| Urbanization promotion area | 1,000 m² or more (500 m² or more in designated zones of the three major metropolitan regions; municipalities may lower it to 300 m² by ordinance) | Generally none. If the project complies with the use restrictions of the use district, building confirmation is the main hurdle | Applies |
| Urbanization control area | Required regardless of size | Compliance with the location criteria for urbanization control areas (City Planning Act, Article 34) is mandatory. Changing the use of an existing building also requires a separate permit | Applies |
| Non-districted city planning area / quasi-city planning area |
3,000 m² or more (may be lowered to 300 m² by ordinance) | Generally none. Where a use district is designated, its use restrictions apply | Applies |
| Outside city planning areas | 1 ha (10,000 m²) or more | Generally none | Generally does not apply. Prefectural building standards ordinances may nonetheless impose separate restrictions |
Lay this table over the data and the reason urbanization control areas sink to 2.0% becomes clear. The sites small vacation rental villas and cottages typically need run from a few hundred to about 2,000 m² — small enough to fall below the development-permit threshold in urbanization promotion areas (1,000 m²), non-districted areas (3,000 m²) and areas outside city planning (1 ha) alike. Urbanization control areas alone have no lower bound: no matter how small the site, a permit is required. On top of that, obtaining one means clearing a second gate, compliance with the location criteria. The mere absence of a threshold is enough to push this category out of the choice set for small-scale development.
Outside city planning areas, the road-frontage requirement also generally does not apply. Even under the amended Building Standards Act that took effect in April 2025 (the narrowing of the so-called “Category 4 exemption”), the waiver of building-confirmation review outside city planning areas survives for single-story wooden buildings of 200 m² or less in total floor area (the new Category 3 buildings). Note, though, that lodging facilities are “special buildings” under the Building Standards Act, and compliance with that Act is checked during the process of obtaining a Hotel Business Act license — so “no confirmation application required” does not mean “nothing gets checked.”
By property type — the planning category is choosing the format
Planning category and property type are tightly linked. Ranking property types by the share sitting outside urbanization promotion areas (the “non-urban share”), pensions come first at 100%, followed by glamping at 90%, cottages at 86.4%, minshuku guesthouses at 80.0%, ryokan at 78.0%, resort hotels at 77.8% and vacation rental villas at 74.0%. At the other end, machiya townhouses (6.1%), city hotels (9.4%) and hostels (11.8%) are firmly anchored in urban areas.
Glamping is worth a closer look: three of its ten facilities sit in urbanization control areas, the highest share of any property type. Depending on how they are installed, tents and trailers may not qualify as “buildings” under the Building Standards Act, and their treatment under the City Planning Act can likewise differ property by property. That judgment turns on foundations, permanence and the configuration of ancillary facilities, and rests ultimately with the competent municipality. With N=10, generalization warrants caution — but as an illustration of how property formats mold themselves to the gaps in the regulations, it is suggestive.
The 577 vacation rental villas break down as 254 in non-districted areas, 164 outside city planning areas, 150 in promotion areas and 9 in control areas. In other words, three-quarters of the whole-house rental supply we previously called “the lead story of 2026 openings” was happening outside the urbanization line. That looks less like a fashion in property types than the natural result of capital gathering where sites fall below the development-permit threshold, road-frontage rules are lenient, and land is cheap to acquire.
By prefecture — Yamanashi 100%, Shizuoka 88%, Okinawa 82% outside the line
The non-urban share by prefecture reads almost as a direct description of how land is acquired in each region. In Yamanashi, all 45 facilities sit outside urbanization promotion areas (34 non-districted, 11 outside planning areas) — 100%. Nagano follows at 91%, Hyogo 91%, Shizuoka 88%, Okinawa 82% and Chiba 82%. Osaka sits at the opposite extreme: all 34 facilities are inside promotion areas, a share of 0%, with Kyoto at 3%, Tokyo at 9% and Fukuoka at 15%.
Hokkaido looks different again: of its 117 facilities, 50 are in urbanization promotion areas and 45 outside city planning areas — split between the two poles. Urban supply in central Sapporo and outside-the-line supply in the Niseko and Furano areas run in parallel within a single prefecture. It is a good example of how a supply-pressure argument framed at the prefecture level decomposes, in practice, into two entirely separate businesses. Keep that decomposition in mind when reading our supply-pressure ranking measured against existing stock.
The third route — relaxed treatment of change-of-use for existing buildings
Does that make urbanization control areas places where you simply cannot build? No. New construction faces a high bar, but for changing the use of something already standing, the national government has explicitly signaled a more flexible stance.
On December 27, 2016, MLIT amended part of its operational guidelines for the development permit system so that traditional houses and similar existing buildings in urbanization control areas could be used to promote tourism, migration and settlement. Two categories were identified: (1) facilities providing lodging, food and beverage and similar services necessary for tourism promotion, and (2) rental housing and similar uses necessary to sustain existing settlements. The background is the growth of vacant houses in urbanization control areas amid depopulation and aging, and the structure of the measure is to apply permit practice flexibly to regional revitalization efforts that reuse existing buildings.
That direction was reinforced later. On December 28, 2023, following the partial amendment of the Act on Special Measures concerning the Promotion of Vacant House Countermeasures, MLIT issued a notice on more flexible permitting of change-of-use for existing vacant buildings (Notice No. 133 of the City Bureau). Both are technical advice under the Local Autonomy Act, not obligations on municipalities to enact ordinances. How far the route is actually usable therefore depends on each municipality’s operational criteria.
One municipality in practice — Hamamatsu
Hamamatsu publishes its “Operational Criteria for the Development Permit System in Urbanization Control Areas,” designating location-guidance zones for factories, logistics, specified road corridors and tourism. The city revised the criteria as of October 2023 in response to the City Planning Act amendment that discourages new development in disaster hazard areas, and has announced a further partial revision taking effect April 1, 2026. Operational criteria move — the premises can change between the time a site is evaluated and the time a contract is signed, so checking even the scheduled revisions is standard practice.
The data also shows this route in operation. The 24 facilities in urbanization control areas break down as 9 vacation rental villas, 4 business hotels, 3 unclassified, 3 glamping sites, 2 resort hotels, 1 cottage, 1 ryokan and 1 minshuku guesthouse, averaging 18.3 rooms with a median of 6. These are small properties, not large new builds — consistent with a structure in which the rules squeeze new construction while leaving a path open for converting existing stock.
Choosing to build new on farmland, by contrast, layers on a separate body of law from the City Planning Act. Converting farmland to a lodging site requires a permit under Article 5 of the Agricultural Land Act (a notification, inside urbanization promotion areas). The standard timeline is roughly one to two weeks for a notification inside a promotion area and about 1.5 to 2 months for a permit in an urbanization control area. If the farmland also sits within an agricultural land use zone of an agricultural promotion area — so-called “blue-zone” land — exclusion from that zone must be completed first. Municipalities commonly accept applications for this exclusion only twice a year (Obuse and Annaka, for example, roughly in August and February), and about six months elapse between filing and public notice. Miss the window and half a year is added on the spot.
Translating into time — four regulatory routes and the acquisition-to-opening timeline
Now reorder everything above along a single axis. What matters to a land acquisition team and to feasibility analysis is not the number of statutory provisions but the number of months between securing the land and selling the first room night.
| Regulatory route | Main procedures | Indicative permit / procedure time | Indicative acquisition-to-opening |
|---|---|---|---|
| D. Non-districted / outside planning areas, small scale 718 facilities opened in 2026 fall in these categories |
Keep the site below the development-permit threshold and the process centers on building confirmation plus the Hotel Business Act license. Outside planning areas, the road-frontage requirement generally does not apply | 1–3 months | 9–18 months |
| A. Urbanization promotion area / commercial district 471 facilities opened in 2026 fall in this category |
If the project complies with the use district’s restrictions, building confirmation is the main step. A development permit applies at 1,000 m² or more | 3–6 months | 18–30 months |
| C. Control area / change of use of an existing building The route that rides on the relaxed operational guidelines |
Confirming compliance with the municipality’s operational criteria, the change-of-use permit, the building confirmation that accompanies it, and the Hotel Business Act license | 6–12 months | 12–24 months |
| B. Control area / new build on farmland 24 facilities opened in 2026 fall in this category |
(If blue-zone land) exclusion from the agricultural land use zone, about 6 months with intake twice a year → Article 5 farmland conversion permit, 1.5–2 months → preliminary consultation → development permit (standard processing 25–49 days, plus 30–60 days if referred to the development review board) → building confirmation → Hotel Business Act license | 12–24 months | 36–54 months |
The important point is that the standard processing periods themselves are surprisingly short. Development-permit review takes 25–49 days; a farmland conversion permit, only 1.5–2 months. What consumes time is not the review but the preliminary consultation, the procedures with intake windows only twice a year (the agricultural land use zone exclusion), and the meeting cycle of the review board. And the definition of a standard processing period excludes both the time needed to amend an application and the time spent consulting related agencies. Real-world schedules are set by the calendar, not the statute book. As for the back half of the timeline, which this article lumps together as “design, construction and pre-opening,” our measurement of actual construction periods in 67 planned projects, at a 2.80-year median from start to completion, shows single-use and mixed-use projects differing by nearly a factor of two.
Translating into IRR — offsetting a two-year delay means buying land 19% cheaper
Now convert the difference between regulatory routes into the language of investment decisions. We modeled the internal rate of return (IRR) for a project with an identical building, identical room count and identical operating plan, varying only the number of years between land acquisition and opening. Fixing everything but the regulations isolates what the permit route alone costs.
Model assumptions: land acquisition cost of 100, with building and pre-opening costs at 167% of land (=167); land paid in year one, building costs at opening. Land holding costs during the permitting and construction period (property tax, interest and the like) are set at 3% of land cost per year. Annual NOI after opening is fixed at 12% of building cost, with a sale after ten years of operation at a 5.5% cap rate. All figures are ratios, not actual amounts for any specific project or market. (MetroEngines Research & Consulting estimate)
The result is unambiguous. As time to opening stretches from one year to five, IRR falls from 9.16% to 7.04%. Each year of delay shaves roughly 0.5 to 0.6 points off IRR. Put the other way round, the difference between regulatory routes is something the market should be pricing in at around half a point a year. Sensitivities to the non-land levers that move the same IRR — key money, FF&E reserve and pre-opening costs — fall outside this article’s scope.
| Years to opening | IRR | vs. two-year case | Land cost matching that IRR | Required discount |
|---|---|---|---|---|
| 1 year (indicative range: outside planning areas, small scale) | 9.16% | +0.60pt | — | — |
| 2 years (promotion area, confirmation-led) | 8.56% | baseline | 100 | — |
| 3 years | 8.01% | −0.55pt | 90 | 10% |
| 4 years (control area, new build on farmland) | 7.50% | −1.06pt | 81 | 19% |
| 5 years | 7.04% | −1.52pt | 74 | 26% |
Three practical implications follow. First, the route of building new on farmland in an urbanization control area (36–54 months from acquisition to opening) only breaks even against a commercial site in an urbanization promotion area (18–30 months) if the land costs roughly 20% less. If acquisition cost differs by only about 20%, the time cost eats the entire gap.
Second, change of use of an existing building (12–24 months) lands, on this arithmetic, level with or faster than the promotion-area route. Whether you can find a property that qualifies under the relaxed guidelines translates directly into an IRR difference. Third, the model above assigns zero weight to the possibility that a permit is refused. Agricultural land use zone exclusion has two intake windows a year, and fails outright if the requirements are not met. Carrying variance, not just a longer expected duration, is the essential cost of this route.
This model fixes every other variable in order to compare regulatory routes; in reality ADR, occupancy, construction unit costs and cap rates all differ by market. What is shown here is the sensitivity to time alone, not the relative profitability of the routes.
Route width and land cost — reading both the duration range and the price level
The model above represented each route with a single number of years, but what bites in practice is not the midpoint — it is the range. Take the lower bound, midpoint and upper bound of the durations shown in the timeline above as optimistic, central and pessimistic cases, read them off the IRR curve in the text (9.16% at one year to 7.04% at five) by linear interpolation, and the variance each route carries lines up in numbers.
| Regulatory route | Optimistic (lower bound) | Central (midpoint) | Pessimistic (upper bound) | Optimistic − pessimistic spread |
|---|---|---|---|---|
| D. Non-districted / outside planning areas, small scale | 1.0 yr, 9.2% | 1.1 yr, 9.1% | 1.5 yr, 8.9% | 0.3pt |
| C. Control area / change of use of an existing building | 1.0 yr, 9.2% | 1.5 yr, 8.9% | 2.0 yr, 8.6% | 0.6pt |
| A. Urbanization promotion area / commercial district | 1.5 yr, 8.9% | 2.0 yr, 8.6% | 2.5 yr, 8.3% | 0.6pt |
| B. Control area / new build on farmland | 3.0 yr, 8.0% | 3.8 yr, 7.6% | 4.5 yr, 7.3% | 0.7pt |
There are two ways to read this. First, the spread itself characterizes the route. Route D’s optimistic-to-pessimistic spread is just 0.3pt, while Route B opens to 0.7pt, more than double. Longer routes not only lower the expected value, they widen the swing. Second, the ranking of routes changes depending on where in the range you draw the line. Route C’s pessimistic case (2.0 years, 8.6%) equals Route A’s central case and beats Route A’s pessimistic case (2.5 years, 8.3%). When weighing a change-of-use candidate against a commercial site in a promotion area, the right comparison is pessimistic against pessimistic, not midpoint against midpoint.
The other axis is land cost. The text derived land-cost levels of 100, 90, 81 and 74 as those matching the two-year case. Crossing those four levels with one to five years to opening and re-running the same model gives the following.
| Years to opening | Land cost 100 (baseline) | Land cost 90 (−10%) | Land cost 81 (−19%) | Land cost 74 (−26%) |
|---|---|---|---|---|
| 1 year (outside planning areas, small scale) | 9.2% | 9.7% | 10.3% | 10.7% |
| 2 years (promotion area) baseline | 8.6% | 9.1% | 9.7% | 10.1% |
| 3 years | 8.0% | 8.6% | 9.1% | 9.6% |
| 4 years (control area, new build on farmland) | 7.5% | 8.1% | 8.6% | 9.0% |
| 5 years | 7.0% | 7.6% | 8.1% | 8.6% |
The bold cells trace the iso-IRR line at 8.6%. It runs in a straight diagonal from upper left to lower right, showing that one additional year of delay trades against a land-cost reduction of roughly 9–10%. Conversely, a farmland project in a control area priced only 10% below market cannot reach parity unless it opens at least two years earlier than a promotion-area alternative. Note that this grid varies only time and price; it does not include the loss if a permit is refused. To account for variance, start from the pessimistic column of Table A.
The large pipeline is a separate cluster — 100+ room projects concentrate in urban mixed-use
The small, non-urban supply examined so far and the large development pipeline are, in practice, two different clusters filed under one phrase: “hotel supply.” Among the N=70 projects in planning (15,517 rooms in total) drawn from MLIT’s “Statistical Survey on Building Construction Dynamics,” 63 projects with 100 rooms or more account for 15,104 rooms, or 97.3% of the total, and the average project is 222 rooms. Forty-six (65.7%) sit in government-designated major cities or Tokyo’s special wards, and 28 (40.0%) are recorded as mixed-use, with a principal use described as, for example, “offices, retail and hotel.”
| Metric | 2026 openings (actuals) | Projects in planning (confirmation basis) |
|---|---|---|
| Number of projects | 1,213 facilities | 70 projects |
| Total rooms | 33,452 rooms | 15,517 rooms |
| Average rooms per project | 27.6 rooms | 221.7 rooms |
| Projects with 100+ rooms | 114 (9.4%) | 63 (90.0%) |
| Located in designated cities / special wards | — | 46 (65.7%) |
| Recorded as mixed-use | — | 28 (40.0%) |
Scheduled completion years for the pipeline run 22 projects in 2025, 21 in 2026, 17 in 2027, 8 in 2028, 1 in 2029 and 1 in 2031 — thinning as the horizon extends. That does not mean supply is drying up. Building confirmation is normally filed one to two years before opening, so projects that have not yet been filed will be added later. Read the figure as a floor for the confirmed pipeline as of today.
Put differently, large urban supply is governed by redevelopment associations and mixed-use schedules, while small non-urban supply is governed by development-permit thresholds and the farmland conversion calendar. They are summed together as “new openings” for the same year, yet their rate-limiting steps are completely different. Building an area supply forecast by stacking the two separately should improve its accuracy. The same root underlies the point that prefectural rankings reshuffle depending on the denominator you choose.
Three choices in site selection — which regulatory route to take
Regulation is not a constraint so much as a fork between options. For the same investment, the route you travel changes both the opening date and the amount of uncertainty carried. Here are the three questions worth settling during initial site screening.
Route 1 Urbanization promotion area — buying speed
If the project complies with the use district’s restrictions, building confirmation is the main step; a development permit applies from 1,000 m² (500 m² in designated zones of the three major metropolitan regions). Acquisition to opening runs 18–30 months. Land costs more, but schedule variance is small and lenders find the feasibility case easier to build. Seventy-one percent of supply with 100 rooms or more is here.
Route 2 Non-districted / outside planning areas — staying under the threshold
A development permit applies from 3,000 m² in non-districted areas and 1 ha outside planning areas. Keep the site inside that threshold and the process gets dramatically lighter; outside planning areas the road-frontage requirement generally does not apply either. The 718 facilities that opened in 2026 (59.2%) sit in these categories, led by vacation rental villas, cottages and pensions. Note, though, that some municipalities have lowered the area threshold to 300 m² by ordinance — always check case by case.
Route 3 Control area — find an existing building
New construction requires a development permit regardless of size and must satisfy the location criteria. For change of use of an existing building, however, the national government has signaled flexibility (the amendment of December 27, 2016 and the notice of December 28, 2023), with lodging and food-and-beverage uses for tourism promotion explicitly in scope. It is technical advice only, so what is actually possible depends on the municipality’s operational criteria. At 12–24 months from acquisition to opening, this route can be faster than a promotion area when it works.
Four checks apply across all three. (1) The site’s urbanization districting category, and whether the municipality has lowered the development-permit area threshold by ordinance. (2) For farmland, whether it lies within an agricultural land use zone of an agricultural promotion area (“blue-zone” land) and, if so, when the next intake window for exclusion opens. (3) In a control area, whether the municipality’s operational criteria include location-guidance zones for lodging or provisions on change of use of existing buildings — and whether a revision has been announced. (4) Outside planning areas, whether a prefectural building standards ordinance imposes separate road-frontage or similar restrictions. All four can be confirmed at the initial screening stage, before any acquisition decision.
Practice varies by municipality, and criteria are frequently inconsistent even within a single prefecture. What this article presents is the national distribution and indicative durations, nothing more. For any specific site, the starting point is a preliminary consultation with the competent local authority’s city planning division, agricultural committee and building guidance division.
Notes on reading the data
New-opening data (2026, N=1,213 facilities) is on a confirmed OTA listing basis. Because OTA listings often appear several months before opening, counts for the most recent months may rise as further listings appear. Ryokan, minshuku guesthouses and simple lodgings not listed on OTAs are excluded.
Projects in planning (N=70) are on a building-confirmation basis as of the survey date. Counts and room totals are expected to rise as further applications are filed; treat the figure as a floor for the confirmed pipeline as of today.
Planning-zone classification is a point-in-polygon test against each facility’s registered coordinates. Where part of a site straddles a category boundary, where coordinate precision is coarse, or where the completeness and update cadence of city planning decision data varies by municipality, the result may differ from the actual category. Confirm the category of any specific site with the competent local authority.
Frequently asked questions
Related reading
- Hotel Development Capacity 2026: Zoning, FAR & Land Price in 5 Markets
- Vacation Rentals Take 45% of Japan’s 2026 New Hotel Openings (247 Villas)
- Hotel Supply Pressure Ranking 2026-2027: Ozu Kumamoto Tops at 30.8%
- Lodging Supply Denominator: 44,901 Simple Lodgings Move Kyoto 21st→5th
- Tokyo 23 Wards Supply Pressure 2026: Arakawa 16.0%, Minato Just 4.5%
- Hotel Build Times: 2.80-Year Median, 1.96 Solo vs 4.00 Mixed-Use
- Hotel vs Condo Land Rivalry: ADR-Implied Feasible Land Price Map
References and sources
■ Data sources
The registered coordinates of 1,213 lodging facilities confirmed to have opened in 2026 (confirmed OTA listing basis, 33,452 rooms in total) were overlaid onto the city planning decision polygons (city planning areas and urbanization districting) published by MLIT’s Real Estate Information Library and classified into four categories: urbanization promotion area, urbanization control area, non-districted city planning area, and outside city planning areas. Projects in planning are N=70 and 15,517 rooms, based on MLIT’s “Statistical Survey on Building Construction Dynamics.” Procedure durations draw on published materials from individual municipalities and ministries, including the standard processing periods for development permits in Kobe, Nagano Prefecture, Osaka Prefecture and Chiba Prefecture, the agricultural land use zone exclusion procedures of Obuse, Annaka and Hiroshima, and the intake practice for Article 5 farmland conversion permits in Mito and elsewhere.
■ Model assumptions
The IRR model sets land acquisition cost at 100 and building plus pre-opening costs at 167% of that (=167), with land paid in year one and building costs at opening. Land holding costs during permitting and construction (property tax, interest and the like) are fixed at 3% of land cost per year, annual NOI after opening at 12% of building cost, and a sale after ten years of operation at a 5.5% cap rate. All figures are ratios, not actual amounts for any specific project or market. The three scenarios by regulatory route (Table A) linearly interpolate the duration ranges’ lower bounds, midpoints and upper bounds along the IRR curve in the text; the two-axis grid (Table B) varies only years to opening and land cost within the same model. Neither introduces any assumption beyond the figures already presented in the text.
■ Limitations and caveats
Planning-zone classification is a point-in-polygon test against registered facility coordinates and may differ from the actual category where part of a site straddles a boundary, where coordinate precision is coarse, or where the completeness and update cadence of city planning decision data varies by municipality. Development-permit area thresholds can be lowered to 300 m² by ordinance, and the operational criteria for urbanization control areas differ by municipality and are subject to scheduled revision. Standard processing periods exclude time spent amending applications or consulting related agencies. New-opening data is on a confirmed OTA listing basis, so unlisted facilities are omitted and recent months may rise. Projects in planning are a floor on a building-confirmation basis, and the IRR model assigns no weight to the possibility that a permit is refused. Any specific site requires preliminary consultation with the competent local authority.
■ Market data
- MetroEngines Research & Consulting — 2026 new-opening data (confirmed OTA listing basis, N=1,213 facilities / 33,452 rooms), aggregation by planning-zone category, IRR sensitivity model
■ Government statistics and public data
- MLIT Real Estate Information Library — City Planning Decision Data (City Planning Areas and Urbanization Districting / Use Districts)
- MLIT, “Statistical Survey on Building Construction Dynamics” (建築動態統計調査) (the statistical framework including the Survey on Building Construction Starts; source for the N=70 projects and 15,517 rooms in planning cited here)
- MLIT, “More flexible operation of the development permit system so that traditional houses and similar buildings in urbanization control areas can be used for tourism promotion and to encourage migration and settlement” (press release, December 27, 2016)
- MLIT, “On more flexible permitting of change of use for existing vacant buildings” (City Bureau Notice No. 133, December 28, 2023)
- MLIT, “Outline of the Development Permit System”
- Ministry of Agriculture, Forestry and Fisheries, “The farmland conversion permit system”
- Ministry of Agriculture, Forestry and Fisheries, “The agricultural promotion area system and the farmland conversion permit system”
■ Municipal operational criteria and standard processing periods
- Hamamatsu, “Building in an urbanization control area” (location-guidance zones for factories, logistics, specified road corridors and tourism; partial revision of the operational criteria scheduled for April 1, 2026)
- Hamamatsu, “Operational Criteria for the Development Permit System in Urbanization Control Areas” (April 2025)
- Kobe, “FAQ on development (building) permits in urbanization control areas” (standard processing periods)
- Nagano Prefecture, “Standard administrative processing periods for development permits”
- Osaka Prefecture, “Procedural flow: the development permit system”
- Obuse, “On the procedure for excluding farmland from an agricultural land use zone”
- Annaka, “On the procedure for excluding farmland included in an agricultural land use zone”
- Hiroshima, “Procedure for exclusion from an agricultural land use zone”
- Mito, “On farmland conversion (Agricultural Land Act, Articles 4 and 5)”
- Chiba Prefecture, “Commentary on development permits (Article 29 of the Act)”