

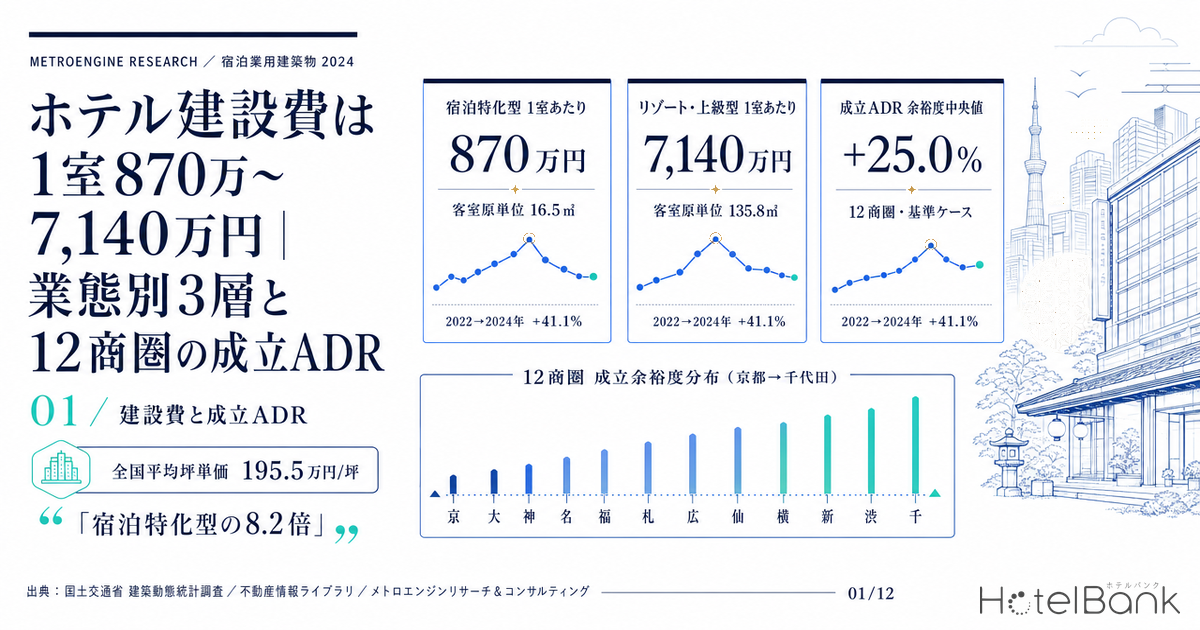
What does it actually cost to build a hotel, per room? Combining the lodging-use building data in Japan’s Ministry of Land, Infrastructure, Transport and Tourism (MLIT) “Statistical Survey on Building Construction Starts” with the gross floor area per room observed across 52 planned projects, the answer splits into three distinct levels by hotel format. Roughly ¥8.70 million per room for limited-service hotels, about ¥24.8 million for city / upper-midscale, and about ¥71.4 million for resort and upscale properties (all based on 2024 reinforced-concrete unit costs per square metre, covering the building itself and excluding land). Because gross floor area per room differs so widely — 16.5 m², 47.1 m² and 135.8 m² — the same cost per tsubo produces a more than eightfold spread in cost per room. This article lays out that three-tier structure, then works backwards from land prices, interest rates and occupancy to the ADR required to make each project pencil out across 12 markets nationwide.
Metric Definitions Used in This Article
- ADR (average daily rate): an estimated settled rate (tax-exclusive equivalent) derived by applying format-specific adjustment factors to the lowest publicly listed plan rate each property shows on online travel agency sites (double occupancy, per room, tax-inclusive). Cross-checked against property-level disclosures from listed hotel REITs (91 properties, most recent 3 months), the median error is approximately 7%. These are estimates and differ from each property’s actual transacted rates and accounting figures. Area-level ADR is the median of the properties covered (the level of a typical property in that area).
- Break-even ADR: the average daily rate required for the combined land, construction and soft costs to clear a target net operating income (NOI) yield. This is an estimate specific to this article and does not guarantee the viability of any particular project.
- NOI (net operating income): gross operating profit (GOP) less the FF&E (furniture, fixtures and equipment) reserve. Treated as a pre-depreciation, pre-interest figure.
- Occupancy: this article uses 82% as a modelling assumption (77–87% in the sensitivity analysis). It is not a measured figure.
- Gross floor area per room: the planned total floor area divided by the planned number of rooms. It is not the guestroom’s own area — it covers the entire building, including corridors, lobby and back-of-house.
- Data sources: MLIT “Statistical Survey on Building Construction Starts”, MLIT Real Estate Information Library (Official Land Price Survey), MetroEngines Research & Consulting
- — Construction cost per room falls into three tiers: about ¥8.70 million for limited-service, about ¥24.8 million for city / upper-midscale, and about ¥71.4 million for resort / upscale (2024 RC unit costs, building only, land excluded).
- — The gap is driven by floor area per room, not by cost per tsubo. The 8.2x spread between 16.5 m², 47.1 m² and 135.8 m² of gross floor area per room translates directly into the spread in cost per room.
- — The national rate is ¥1.955 million per tsubo (2024, 2,836 buildings), up 41% from 2022. By structure, the range runs from ¥1.234 million for timber to ¥3.251 million for steel-reinforced concrete — a 2.6x spread.
- — Break-even ADR across the 12 markets runs from ¥6,600 to ¥14,900. Headroom against prevailing ADR has a median of +25.0%, with Kyoto (+93.5%) and Sapporo (+77.2%) the most comfortable and Tokyo’s Chiyoda ward (+8.0%) the thinnest.
- — Construction cost dominates the sensitivity. A ±20% move in construction cost carries roughly 2.5 times the weight of a ±0.5 point move in interest rates; at construction cost +20% and a 2.75% rate, the number of viable markets drops from 12 to 7.
Conclusion — cost per room is set by floor area per room, not by cost per tsubo
The conclusion first. When people discuss hotel construction costs in practice, the figure they reach for is the cost per tsubo. But cost per tsubo is a price for one tsubo of building, whereas what a business plan needs is a figure per room. What connects the two is gross floor area per room, and because that value varies more than eightfold by format, the same cost per tsubo produces completely different construction costs per room.
Among the planned projects tracked by MetroEngines Research & Consulting, 52 are hotel-only in use with both room count and gross floor area confirmed. Aggregating those, floor area per room clusters into three groups: a median of 16.5 m² for urban limited-service (N=16), 47.1 m² for city / upper-midscale (N=18), and 135.8 m² for resort / upscale (N=18). Multiplying by the 2024 reinforced-concrete construction cost of ¥526,000 per square metre gives construction costs per room of roughly ¥8.70 million, ¥24.8 million and ¥71.4 million respectively.
Collapsing these three tiers into a single average produces a number that fits none of them. The median floor area per room across all 52 projects is 48.9 m², which works out to about ¥25.7 million per room — but that simply sits between the three peaks and does not describe a “typical hotel”. Our earlier estimate, which assumed 35.0 m² per room, also lands in a different place because the underlying project sample and format mix differ. The order of operations matters: decide which tier your own scheme belongs to first, then apply a unit cost.
1. Limited-service ¥8.70M / room
Floor area per room of 16.5 m² (range 13.1–22.1 m²), with a median planned room count of 234. The design squeezes corridors and lobby to stack up guestrooms. Excluding land, most of these projects are planned at under ¥10 million per room for the building itself.
2. City / upper-midscale ¥24.8M / room
Floor area per room of 47.1 m² (range 25.7–65.0 m²), with a median planned room count of 165. Banquet halls, restaurants and large communal baths add shared space, pushing floor area per room to roughly 2.9 times the limited-service level.
3. Resort / upscale ¥71.4M / room
Floor area per room of 135.8 m² (range 80.6–244.6 m²), with a median planned room count of 65. The guestrooms themselves are large, and spa, restaurant and public space account for a high share of the building. Per room, that is 8.2 times the limited-service figure.
The basics — a 2.6x spread by structure, and +41% in the two years from 2022
Start with the unit cost side. MLIT’s “Statistical Survey on Building Construction Starts” publishes the number of buildings, floor area and planned construction cost for building starts by use and by structure. Dividing planned construction cost by floor area for use category “52 lodging” yields a cost per square metre for hotel and ryokan buildings. The 2024 national figure was ¥591,000 per square metre, or ¥1.955 million per tsubo (2,836 buildings, approximately 1.76 million square metres of floor area).
Broken down by structure, that becomes ¥1.234 million per tsubo for timber, ¥1.650 million for steel-frame (S), ¥1.738 million for reinforced concrete (RC) and ¥3.251 million for steel-reinforced concrete (SRC) — a 2.6x spread between the cheapest and the most expensive. Steel-frame and reinforced concrete, the mainstream choices for new limited-service builds, sit within a ¥1.65–1.74 million per tsubo range. The all-structure average of ¥1.955 million per tsubo is a blended figure pulled upward by large SRC projects, which number only 17 buildings but are individually large; applying it directly to a limited-service scheme would overstate construction cost.
| Structure | 2024 per m² | 2024 per tsubo | 2023 per tsubo | Change vs. prior year | Buildings (2024) |
|---|---|---|---|---|---|
| Timber | ¥373k | ¥1.234M | ¥1.004M | +22.9% | 1,365 |
| Steel frame (S) | ¥499k | ¥1.650M | ¥1.339M | +23.2% | 1,088 |
| Reinforced concrete (RC) | ¥526k | ¥1.738M | ¥1.539M | +12.9% | 267 |
| Steel-reinforced concrete (SRC) | ¥983k | ¥3.251M | ¥1.353M | +140.3% | 17 |
| All structures | ¥591k | ¥1.955M | ¥1.377M | +42.0% | 2,836 |
Looking at the trend, the cost per tsubo for lodging-use buildings moved from ¥1.203 million in 2019 to ¥1.172 million in 2020, ¥1.248 million in 2021, ¥1.386 million in 2022, ¥1.377 million in 2023 and ¥1.955 million in 2024 — a rise of 41.1% over the two years from 2022. It did not climb in a straight line: 2022 to 2023 was essentially flat, and the level stepped up sharply in 2024. We cover how this feeds through to the supply side in Construction +41% and a Labor Crunch Erase Japan’s 2027-2029 Hotel Supply.
Cost per room — the three tiers of 16.5 m², 47.1 m² and 135.8 m²
Next, translate that into a per-room figure. Construction cost per room is unit cost per square metre multiplied by gross floor area per room. Of the planned projects tracked by MetroEngines Research & Consulting, 52 have hotel as their sole principal use with both room count and gross floor area stated. The distribution is not continuous — it splits into three groups.
| Format tier | Floor area per room, median | Range | Projects N | Planned rooms median | Cost per room RC | Same, S frame |
|---|---|---|---|---|---|---|
| 1. Limited-service | 16.5 m² | 13.1–22.1 m² | 16 | 234 | approx. ¥8.70M | approx. ¥8.20M |
| 2. City / upper-midscale | 47.1 m² | 25.7–65.0 m² | 18 | 165 | approx. ¥24.8M | approx. ¥23.5M |
| 3. Resort / upscale | 135.8 m² | 80.6–244.6 m² | 18 | 65 | approx. ¥71.4M | approx. ¥67.8M |
| All projects (reference) | 48.9 m² | 13.1–244.6 m² | 52 | 168 | approx. ¥25.7M | approx. ¥24.4M |
A few concrete cases. A project in Ikegami-cho, Utsunomiya is planned at 300 rooms with 13,000 m² of floor area — 43.3 m² per room (scheduled for completion in October 2028, as a rebuild), placing it in tier 2. A project in Minokamo, Gifu prefecture is planned at 120 rooms across eight storeys (scheduled for December 2028), but the currently available plan data does not state floor area. A 300-room, 40,400 m² project in Nodaya-cho, Kita ward, Okayama (scheduled for December 2028) is mixed-use with residential and retail, so its floor area includes non-hotel components and it is excluded from this aggregation. For mixed-use schemes, dividing the published floor area by room count inflates the floor area per room, so care is needed.
One further caveat. The 13.1–22.1 m² range in tier 1 is not the area of the guestrooms themselves; it divides the whole building — corridors, lobby and back-of-house included — by room count. Central-city limited-service hotels stack 11–13 m² class guestrooms at high density, and this is the level observed in actual planning figures. In tier 3, by contrast, the guestrooms are large and restaurant, spa and public floor area is heavy relative to room count, which pushes floor area per room into three digits.
Regional variation — prefecture-level costs per tsubo span 4.5x, from ¥600k to ¥2.6M
Unit costs also move by region. Restricting the sample to steel-frame and reinforced concrete — the mainstream for limited-service — and pooling three years from 2022 to 2024 to avoid thin samples, the 37 prefectures with at least 20 building starts range from ¥603,000 per tsubo in Miyazaki to ¥2.687 million in Kanagawa, a 4.46x spread. The median is ¥1.337 million per tsubo across a combined 2,903 buildings.
It would be premature, however, to read this as “building in that prefecture is always expensive or always cheap”. The building-starts statistics aggregate on a per-building basis, so the level moves with the scale and grade of whatever happened to break ground that year. Kanagawa (57 buildings) and Kagawa (68 buildings) rank near the top largely because large, high-grade projects fell within the period. A structural analysis of regional differences by construction method is available in our earlier coverage of construction costs by build method. In practice, the sensible approach is to take the prefectural average as a starting point and then adjust using recent comparables of similar scale and grade.
It is also worth looking ahead. The Construction Research Institute’s building cost index (Tokyo, 2015 average = 100) stood at 143.3 for apartment buildings (RC) in March 2026, up 5.5% year on year, and 141.2 for offices (S frame), up 3.4% — the climb is continuing. Turner & Townsend likewise forecasts Japanese construction inflation of +5.6% in 2025, +5.3% in 2026 and +5.0% in 2027. For development projects that take several years from groundbreaking to opening, using 2024 actual unit costs as-is misses the increase that accrues during construction. The estimates below assume a 2029 opening (with the midpoint of the construction period in 2028) and build in a 22.0% increase over 2024.
Working backwards — break-even ADR across 12 markets runs from ¥6,600 to ¥14,900
Now to the main question. The reason to know construction costs is to judge whether they can be recovered. So, assuming a new limited-service build, we work backwards from land, construction and financing to the ADR required.
The assumptions are as follows. Gross floor area per room is set at 25.0 m² — a conservative setting, thicker than the 16.5 m² median observed for limited-service. Construction cost applies 22.0% of construction inflation to the 2024 RC figure of ¥526,000 per square metre, giving ¥641,000 per square metre, or ¥16.03 million per room. Design and supervision fees, FF&E and pre-opening costs are added at 20% of construction cost (¥3.21 million per room). For land, we take the median published land price for commercial sites within roughly a 1.2 km radius of each market’s centre (as of 1 January 2025) and divide it by the median designated floor area ratio over the same area to derive the land burden per room.
On the financing side, we assume a floating rate of 2.25% linked to the Bank of Japan’s 1.00% policy rate, LTV of 60% and a DSCR of 1.3x. The loan constant on a 25-year equal-payment amortisation works out to 5.23%, giving a required NOI yield of 4.08%. Reading this alongside Policy Rate 1.00%: Break-Even ADR Across Japan’s 8 Hotel Markets, which tests the same framework under three interest-rate cases, gives a clearer sense of how much the swing in rate assumptions matters. On the operating side we assume a GOP margin of 45%, an FF&E reserve of 3% of revenue and occupancy of 82% (a modelling assumption in this article, used to work backwards from prevailing ADR for September 2025 through August 2026; it is not a measured figure, and the sensitivity analysis tests 77–87%). The GOP margin is set below the 50–60% industry benchmark for limited-service.
| Market | Published commercial land price, median (¥/m²) | YoY | Floor area ratio median | Land cost ¥M/room | Total investment ¥M/room | Break-even ADR | Prevailing ADR | Headroom |
|---|---|---|---|---|---|---|---|---|
| Tokyo, Chiyoda (Tokyo Station area) | 8,510,000 | +8.2% | 800% | 26.59 | 45.83 | ¥14,900 | ¥16,100 | +8.0% |
| Utsunomiya, Utsunomiya Station | 153,000 | +0.9% | 400% | 0.96 | 20.20 | ¥6,600 | ¥7,200 | +9.8% |
| Okayama, Okayama Station (Kita ward) | 295,000 | +6.1% | 500% | 1.48 | 20.72 | ¥6,700 | ¥7,800 | +15.6% |
| Osaka, Umeda (Kita ward) | 2,045,000 | +15.3% | 600% | 8.52 | 27.76 | ¥9,000 | ¥10,600 | +17.3% |
| Sendai, Sendai Station (Aoba ward) | 884,000 | +8.3% | 500% | 4.42 | 23.66 | ¥7,700 | ¥9,000 | +17.7% |
| Hiroshima, Kamiyacho (Naka ward) | 885,000 | +5.1% | 500% | 4.42 | 23.67 | ¥7,700 | ¥9,600 | +24.6% |
| Nagoya, Meieki (Nakamura ward) | 1,310,000 | +5.6% | 600% | 5.46 | 24.70 | ¥8,000 | ¥10,100 | +25.5% |
| Naha, Kencho-mae | 579,500 | +6.2% | 400% | 3.62 | 22.86 | ¥7,400 | ¥9,400 | +26.8% |
| Kanazawa, Kanazawa Station | 277,000 | +3.6% | 400% | 1.73 | 20.97 | ¥6,800 | ¥8,800 | +28.9% |
| Fukuoka, Hakata Station (Hakata ward) | 1,790,000 | +12.6% | 500% | 8.95 | 28.19 | ¥9,200 | ¥14,000 | +52.6% |
| Sapporo, Odori (Chuo ward) | 1,050,000 | +10.4% | 600% | 4.38 | 23.62 | ¥7,700 | ¥13,600 | +77.2% |
| Kyoto, Kyoto Station (Shimogyo ward) | 959,500 | +11.8% | 600% | 4.00 | 23.24 | ¥7,500 | ¥14,600 | +93.5% |
In all 12 markets, prevailing ADR exceeded break-even ADR. But headroom ranges from +8.0% to +93.5% — roughly a twelvefold spread. Kyoto’s Kyoto Station area (+93.5%), Sapporo’s Odori (+77.2%) and Fukuoka’s Hakata Station (+52.6%) still carry low construction and land costs relative to current rate levels, leaving a thick cushion. At the other end, Tokyo’s Chiyoda (+8.0%) and Utsunomiya Station (+9.8%) sit around 10% above the break-even line, close enough that a small shift in assumptions changes the arithmetic.
Chiyoda’s thin headroom is not a matter of weak rates. Its prevailing ADR of ¥16,100 is the highest of the 12 markets. What stands out instead is the median published commercial land price of ¥8.51 million per square metre; even with an 800% floor area ratio, land costs ¥26.59 million per room, exceeding the ¥16.03 million of construction cost. In central Tokyo, viability is decided less by which district you choose than by which site you choose within the same district. Utsunomiya is the mirror image: land is extremely light at ¥0.96 million per room, but the gap between construction cost and prevailing ADR is narrow. Both clear the bar, but the headroom is built in entirely different ways.
Sensitivity — construction cost ±20% carries roughly 2.5x the weight of ±0.5 points on rates
To test robustness, we move the assumptions. Flexing construction cost by ±20% and the borrowing rate by ±0.5 points (1.75% / 2.25% / 2.75%), the table below shows on two axes how many of the 12 markets remain viable and how the median headroom shifts.
| Construction cost \ Borrowing rate | 1.75% Required NOI yield 3.85% | 2.25% (base) 4.08% | 2.75% 4.32% |
|---|---|---|---|
| Construction cost −20% | 12 markets viable Median headroom +57.5% | 12 markets viable +48.7% | 12 markets viable +40.6% |
| Construction cost, base | 12 markets viable +32.4% | 12 markets viable +25.0% | 12 markets viable +18.2% |
| Construction cost +20% | 11 markets viable +14.2% | 9 markets viable +7.8% | 7 markets viable +1.9% |
The reading is clear. Raising the rate by 0.5 points from the base case lowers median headroom from +25.0% to +18.2%, a fall of 6.8 points, whereas raising construction cost by 20% takes it from +25.0% to +7.8%, a fall of 17.2 points. A swing in construction cost carries roughly 2.5 times the weight of 0.5 points on interest rates. In a phase where construction inflation continues at around 5% a year, how firmly you lock down build pricing matters more to viability than your view on rates.
Under the harshest combination — construction cost +20% and a 2.75% rate — 7 markets stay viable and 5 fall below the break-even line. Those five are Tokyo Chiyoda (−5.8%), Osaka Umeda (−2.6%), Sendai Station (−4.3%), Okayama Station (−7.8%) and Utsunomiya Station (−12.8%). In each case the shortfall is around 10% or less, within range of the levers discussed below.
| Construction cost \ Occupancy assumption | 77% | 82% (base) | 87% |
|---|---|---|---|
| Construction cost −20% | 12 markets viable | 12 markets viable | 12 markets viable |
| Construction cost, base | 12 markets viable | 12 markets viable | 12 markets viable |
| Construction cost +20% | 7 markets viable | 9 markets viable | 11 markets viable |
A three-scenario run-through
Construction cost, interest rates and occupancy do not move independently of one another. Running all three to the same extreme through the same model gives the break-even ADR and viable-market counts below. In the pessimistic case the number of viable markets falls from 12 to 3, and median break-even ADR rises about 31%, from the base case’s ¥7,700 to ¥10,100. In the optimistic case the median falls to ¥5,700, and prevailing ADR exceeds break-even ADR in all 12 markets.
| Scenario | Assumptions | Required NOI yield | Median total investment (¥M/room) | Break-even ADR median | Range across 12 markets | Viable markets |
|---|---|---|---|---|---|---|
| Pessimistic | Construction cost +20% / rate 2.75% / occupancy 77% (modelling assumptions as of 2026) | 4.32% | ¥27.49M | ¥10,100 | ¥8,800–¥18,200 | 3/12 |
| Mid (base) | Construction cost ±0 / rate 2.25% / occupancy 82% (modelling assumptions as of 2026) | 4.08% | ¥23.64M | ¥7,700 | ¥6,600–¥14,900 | 12/12 |
| Optimistic | Construction cost −20% / rate 1.75% / occupancy 87% (modelling assumptions as of 2026) | 3.85% | ¥19.79M | ¥5,700 | ¥4,700–¥12,100 | 12/12 |
The practical implication is that whether a scheme survives the pessimistic case is what narrows down the site search. Kyoto, Sapporo and Fukuoka, with headroom above +50%, stay on the viable side even in the pessimistic case, while Tokyo Chiyoda, with single-digit headroom, only just clears the bar in the mid case — the moment either construction cost or rates move, the plan has to be reworked.
Occupancy matters too. Even with construction cost 20% higher, lifting the occupancy assumption from 82% to 87% — five points — brings viable markets back from 9 to 11. In terms of median break-even ADR, 77% occupancy gives ¥8,175, 82% gives ¥7,676 and 87% gives ¥7,235 (all at base-case construction cost and a 2.25% borrowing rate, compared against prevailing ADR from September 2025 to August 2026; all three occupancy levels are modelling assumptions) — a difference of roughly ¥450–500 per five points. Even once construction cost is locked in, accelerating the ramp-up in the opening period remains a lever, and our own measurement of 182 newly opened hotels puts the median recovery in rate at about two months.
Market map — where headroom is thick, and where site selection decides the outcome
Three levers for closing the distance to break-even ADR
For markets with thin headroom, waiting for rates to rise is not the only available direction. Three levers follow directly from the structure of the model.
1. Site selection within the same market
In Tokyo’s Chiyoda, land accounts for 58% of total investment. Against a market median of ¥8.51 million per square metre, a site closer to the lower band within the same market (the lowest survey point in the same area is ¥1.72 million per square metre) would bring land cost well below ¥26.59 million per room. In central Tokyo, the choice of site moves the numbers more than the choice of market.
2. Designing floor area per room
Tightening floor area per room from 25.0 m² to 20.0 m² cuts construction cost and soft costs by 20%, and — via the floor area ratio — land cost by the same proportion. Given that the observed median for limited-service is 16.5 m², there is still room to adjust at the design stage. If the aim is to move upscale instead, verify first that the added floor area per room can be recovered in rate.
3. Renovation and conversion as an alternative
With new-build construction cost up to ¥1.95 million per tsubo, the relative appeal of working with an existing building has increased. The 300-room, 13,000 m² project in Ikegami-cho, Utsunomiya was itself filed as a rebuild. Where the frame can be reused, the construction cost burden lightens and break-even ADR falls substantially.
We have compared investment cost per room for renovation against new build elsewhere, examining where the dividing line falls. Beyond that, rising construction cost is both a burden on business plans and a brake on new entry. Seen from the perspective of existing stock, a higher cost of entry reads as an upside factor that tightens supply and demand over the medium term.
Summary — four numbers to take away
| Topic | Figures |
|---|---|
| Construction cost per room | Limited-service approx. ¥8.70M / city and upper-midscale approx. ¥24.8M / resort and upscale approx. ¥71.4M (2024 RC unit costs, building only, land excluded) |
| Cost per tsubo | 2024 national, all structures: ¥1.955M per tsubo (2,836 buildings). Timber ¥1.234M / steel frame ¥1.650M / RC ¥1.738M / SRC ¥3.251M. Up 41.1% from 2022 |
| Floor area per room | Limited-service 16.5 m² (N=16) / city 47.1 m² (N=18) / resort 135.8 m² (N=18). Median across all 52 projects: 48.9 m² |
| Break-even ADR | ¥6,600–14,900 across 12 markets. Median headroom against prevailing ADR is +25.0%. At construction cost +20% and a 2.75% rate, 7 markets remain viable |
Any attempt to reduce hotel construction cost to a single number will part company with reality somewhere. Cost per tsubo varies 2.6x by structure and 4.5x by region, and once converted to a per-room figure it varies 8.2x by format. When translating this into a business plan, settle three things in order — which format (floor area per room), which structure (cost per square metre), and which region and which site (land price and floor area ratio) — and only then run the sensitivity on interest rates and occupancy. Follow that sequence and the question “what does it cost per room?” has an answer of sufficient precision.
On the nature of these estimates: the break-even ADR figures in this article are simplified estimates derived by applying a set of assumptions to published statistics and publicly listed price data. An actual investment decision requires a detailed feasibility study reflecting the specific conditions of the site in question. Construction costs, land prices and interest rates are all values as at the time of research and will change.
Related Reading
- Construction +41% & Labor Crunch Erase Japan’s 2027-2029 Hotel Supply
- Policy Rate 1.00%: Break-Even ADR Across Japan’s 8 Hotel Markets
- Hotel Development Capacity 2026: Zoning, FAR & Land Price in 5 Markets
- Hotel Build Times: 2.80-Year Median, 1.96 Solo vs 4.00 Mixed-Use
- Hotel vs Condo Land Rivalry: ADR-Implied Feasible Land Price Map
- What Is Hotel ADR? Settled Rates 34-57% of Listed Prices, 2026
- What Is RevPAR? ADR x Occupancy, and Why GOP Splits 1.81x in 2026
References and Sources
■ Data sources
MLIT “Statistical Survey on Building Construction Starts”, statistics ID 0003114547 (use category “52 lodging”; 2019–2024; national, by prefecture and by structure; 2,836 buildings in 2024). Planned-project data covering 52 projects (limited to schemes with hotel as the sole principal use where both planned room count and gross floor area are known). Estimated settled ADR for business hotels across 12 markets (12-month average from September 2025 to August 2026, N=41–134 properties). MLIT Real Estate Information Library, Official Land Price Survey (as of 1 January 2025, commercial sites within roughly a 1.2 km radius of each market centre, 8–61 survey points).
■ Modelling assumptions
Gross floor area per room 25.0 m²; construction unit cost is the 2024 RC cost per square metre uplifted by an assumed 22% of construction inflation; soft costs (design and supervision, pre-opening and similar) at 20% of construction cost. On the operating side, a GOP margin of 45%, an FF&E reserve of 3% of revenue and occupancy of 82% (a modelling assumption as of 2026; 77–87% in the sensitivity analysis). Financing assumes a borrowing rate of 2.25% (1.75–2.75% in the sensitivity analysis), 25-year equal-payment amortisation, LTV 60% and DSCR 1.3. Required NOI yield = loan constant x DSCR x LTV, giving 4.08% in the base case (3.85% at a 1.75% rate, 4.32% at 2.75%). Break-even ADR = total investment x required NOI yield / (occupancy x 365 days x 0.42). Headroom = prevailing ADR / break-even ADR − 1.
■ Limitations and caveats
Construction costs are based on planned construction cost in the building-starts statistics and differ from actual contract amounts or final settlement at completion. Gross floor area per room is planned floor area divided by planned room count; it is not the guestroom’s own area and includes corridors, lobby and back-of-house. Occupancy, GOP margin and interest rates are all modelling assumptions in this article rather than measured figures, and do not guarantee the viability of any individual project. Prevailing ADR is an estimated settled rate derived by applying format-specific adjustments to publicly listed online travel agency prices (median error of approximately 7% when cross-checked against property-level disclosures from listed hotel REITs) and differs from ADR as reported in financial accounts. Land prices are published survey prices rather than actual acquisition prices, and will move with site scarcity and competitive conditions.
■ Government statistics and public data
- e-Stat “Statistical Survey on Building Construction Starts” (statistics ID 0003114547, “Number of buildings, floor area and planned construction cost by use and by structure”, use category “52 lodging”)
- MLIT “Statistical Survey on Building Construction Starts”
- MLIT Real Estate Information Library — Official Land Price Survey and Prefectural Land Price Survey (as of 1 January 2025), zoning
■ Market data
- MetroEngines Research & Consulting — estimated settled ADR (12 markets, business hotels, September 2025 to August 2026) and planned-project data (N=52)
■ Construction cost and market reports