

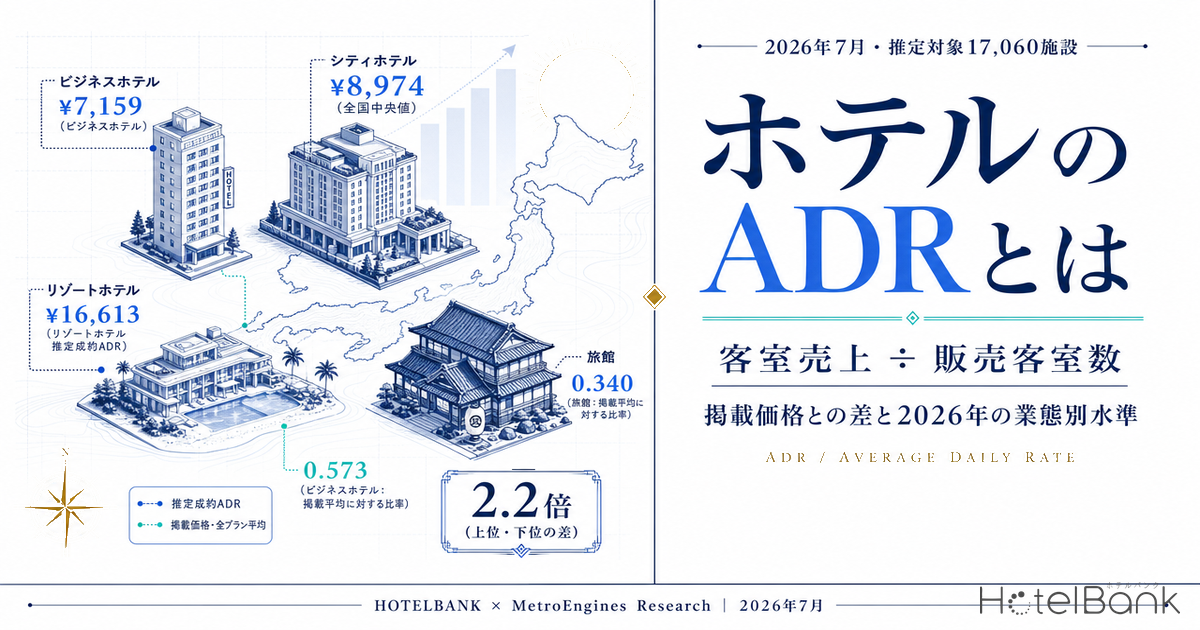
ADR (Average Daily Rate) is the number that carries the “price” side of the three headline metrics used to measure hotel revenue. The formula itself is simple — room revenue ÷ rooms sold — but in practice three questions trip people up: what belongs in the numerator, how many rooms count in the denominator, and whether the price shown on an OTA can be called ADR at all. This article sets out the definition and worked examples, then uses MetroEngines Research’s estimated settled ADR to show actual market levels by hotel category and prefecture as of July 2026, quantifying exactly how far listed prices sit from settled rates.
- — ADR = room revenue ÷ rooms sold. Per room, excluding tax, and only rooms actually sold go in the denominator — never divide by the number of guests.
- — A listed price is not ADR. Using property-level medians for July 2026, estimated settled ADR as a ratio of the all-plan average listed price is 0.573 for business hotels and 0.340 for ryokan.
- — The national median estimated settled ADR for July 2026 was ¥8,974 (17,060 properties in scope). By category: business ¥7,159 / city ¥9,131 / ryokan ¥12,105 / resort ¥14,180.
- — The median error of estimated settled ADR is 7.5% (184 property-months, April–May 2026). Business and city hotels come in at 6.0% against 15.8% for resorts and ryokan, so the estimate cannot pin down the rate of any individual property.
- — RevPAR = ADR × OCC. Whether a rate increase worked is judged on RevPAR, not ADR alone. The accommodation CPI (+3% to +6% YoY) and estimated settled ADR (+15.6% to −5.6%) do not move together.
Metric Definitions Used in This Article
- ADR (average daily rate): An estimated settled rate (tax-excluded equivalent) calculated by applying a category-specific adjustment factor to the lowest published plan rate each property lists on OTAs (double occupancy, per room, tax included). Cross-checked against per-property results disclosed by listed hotel REITs, the median error is 7.5%. These are estimates and differ from each property’s actual transacted rates and accounting figures. Area-level ADR is the median across properties in scope (the level of a typical property in that area).
- Listed price (all-plan average): The average price across every plan a property publishes on OTAs, from room-only to meal-inclusive (double occupancy, per room, tax included). Because it rests on a different basis from estimated settled ADR, this article keeps the two under separate names.
- OCC (occupancy rate): Rooms sold as a share of total rooms in the area (an estimate based on OTA sales inventory).
- Data sources: MetroEngines Research / Ministry of Internal Affairs and Communications, “Consumer Price Index” / monthly disclosures from individual REITs
Defining ADR — Room Revenue on Top, Rooms Actually Sold on the Bottom
ADR is room revenue over a given period divided by the number of rooms actually sold in that period. Framed against USALI (Uniform System of Accounts for the Lodging Industry), the international accounting standard, both the numerator and the denominator have clear boundaries.
| Component | Included | Excluded |
|---|---|---|
| Numerator: room revenue | Revenue from the room itself (excluding tax). Some operators also book the room-equivalent portion of cancellation fees as room revenue | Consumption tax, accommodation tax, bathing tax and other amounts held on behalf of authorities; the meal-equivalent portion of breakfast and dinner (allocated to F&B); parking, retail and other ancillary revenue |
| Denominator: rooms sold | Rooms occupied on a paid basis (room-nights). How many guests stayed in the room is irrelevant | Vacant rooms, complimentary rooms, house use, and rooms taken out of sale for maintenance or other reasons |
Source: Compiled by the HotelBank Editorial Team based on standard USALI-aligned treatment
In practice, the largest source of error here is how breakfast-inclusive plans are handled. A property that books the whole sale into the rooms department and a property that transfers the breakfast-equivalent amount to F&B will report different ADRs at the same selling price. Before comparing your ADR against another property or a REIT disclosure, confirm that the allocation rules match. Likewise, accommodation tax and bathing tax are amounts held on behalf of local authorities and never belong in room revenue.
Per-Room vs Per-Person — Why Japanese OTA Displays Cause Confusion
ADR is strictly a per-room rate. Yet listed prices on Japanese OTAs are usually shown as “double occupancy, per room, tax included,” and search screens sometimes divide that figure down to a per-person amount. Once a discussion proceeds with the units misaligned, ADR can easily end up off by a factor of two in either direction.
| Reading | Amount | Valid as ADR? |
|---|---|---|
| OTA listed price (double occupancy, per room, tax included) | ¥18,000 | Right unit, but tax inclusive. Accounting ADR is tax exclusive |
| The same display divided down to a per-person amount | ¥9,000 | Wrong. ADR is a per-room rate and is never divided by headcount |
| Converted to tax-exclusive (10% consumption tax) | ¥16,364 | Close to the accounting ADR unit |
| The same room occupied by a single guest | Actual transacted amount | Counts once as one room. Headcount does not affect ADR |
Source: Compiled by the HotelBank Editorial Team
Whether one guest or two stays, ADR sees “one room,” and the difference in headcount is captured not by ADR but by a separate metric — guests per room (double occupancy). The familiar argument that a rising inbound share lifts double occupancy and therefore lets the same room command a higher rate only holds once ADR and double occupancy are looked at separately.
Worked Examples — One Night and One Month
Take a 100-room hotel and run the calculation both for a single day and for a full month. Because ADR covers only what was sold, the key point is that ADR itself does not fall when occupancy does.
| Item | One day | 30 days (monthly) |
|---|---|---|
| Total rooms | 100 rooms | 100 rooms |
| Available rooms (room-nights) | 100 rooms | 3,000 rooms |
| Rooms sold (room-nights) | 60 rooms | 1,800 rooms |
| Room revenue (excluding tax) | ¥900,000 | ¥28,800,000 |
| ADR = room revenue ÷ rooms sold | ¥15,000 | ¥16,000 |
| OCC = rooms sold ÷ available rooms | 60.0% | 60.0% |
| RevPAR = ADR × OCC | ¥9,000 | ¥9,600 |
Source: Compiled by the HotelBank Editorial Team (model case)
The monthly ADR (¥16,000) does not match the single-day figure (¥15,000) because rates and rooms sold vary day by day within the month. Monthly ADR is not “the average of daily ADRs” but “monthly room revenue ÷ monthly rooms sold” — in other words, an average weighted by rooms sold. A month in which high-rate weekend dates sold heavily pushes ADR up; a month that sold mostly on weekdays pulls it down. Reporting a simple average of daily ADRs as the monthly ADR is a common mix-up in the field.
A Listed Price Is Not ADR — Settled Rates Run 34–57% of the Listed Average
The single most common misuse in market analysis is substituting “the price shown on an OTA” for ADR. Listed prices keep unsold high-rate plans on screen indefinitely, are quoted on a double-occupancy, tax-inclusive basis, and for meal-inclusive plans also carry the meal-equivalent amount. The all-plan average of listed prices therefore sits structurally above the settled rate.
MetroEngines Research multiplies each property’s lowest published OTA plan rate by a category-specific adjustment factor, calibrated against the per-property settled ADR that listed hotel REITs disclose, to produce an estimated settled ADR. The table below covers July 2026, taking properties with 30 rooms or more by category and lining up three stages: (1) the all-plan average listed price, (2) the lowest listed plan, and (3) estimated settled ADR.
Source: Compiled from MetroEngines Research by the HotelBank Editorial Team (July 2026, properties with 30+ rooms / business N=131, city N=127, resort N=118, ryokan N=120 properties)
| Category | N | 1. Listed, all-plan average (tax incl.) | 2. Listed, lowest plan (tax incl.) | 3. Estimated settled ADR (tax-excl. equivalent) | 3 ÷ 1 median of per-property ratios |
|---|---|---|---|---|---|
| Business hotel | 131 | ¥16,588 | ¥10,732 | ¥9,438 | 0.573 |
| City hotel | 127 | ¥31,111 | ¥14,742 | ¥14,182 | 0.492 |
| Resort hotel | 118 | ¥45,718 | ¥25,692 | ¥16,613 | 0.362 |
| Ryokan (traditional inn) | 120 | ¥45,732 | ¥24,048 | ¥16,474 | 0.340 |
Source: Compiled from MetroEngines Research by the HotelBank Editorial Team (July 2026). Columns 1, 2 and 3 are medians of each property’s monthly value. The rightmost column takes 3 ÷ 1 for each property and then the median of those ratios; it does not equal one median divided by another
For business hotels, the all-plan average listed price has a median of ¥16,600 against an estimated settled ADR of ¥9,400 — a per-property ratio with a median of 0.573. Treating the average listed price as ADR therefore overstates the level by more than 70%. City hotels come in at 0.492, resort hotels at 0.362 and ryokan at 0.340: the higher the category, the wider the gap.
That gap breaks into three stages. First, the drop from the all-plan average to the lowest plan: a per-property median of 0.645 for business hotels, falling to 0.524 for ryokan. A figure that averages everything from room-only to a two-meal suite does not represent the price band where volume actually sells. Second, the correction from the lowest plan to the settled rate: the category adjustment factor is 0.897 for business and city hotels and 0.607 for resorts and ryokan, and this single step absorbs both the consumption-tax basis difference and the real sales mix across higher-tier plans. Third, resorts and ryokan carry meal-equivalent amounts inside their listed prices far more often, so restating to a room-revenue ADR pulls the figure down further.
The practical implication is clear. Listed-price trends are useful for reading pricing behaviour, but carrying them straight into a revenue simulation or a comparison with REIT disclosures will put you an order of magnitude off. You need to switch explicitly between listed price and settled rate depending on the question. Where in Japan this gap is widest is mapped prefecture by prefecture in Listed vs Settled ADR Gap: Japan’s 46-Prefecture Upside Map 2026.
Market Levels in July 2026 — By Category and by Prefecture
Next, the actual level of estimated settled ADR. For the single month of July 2026, the table below takes the category median for each of the 47 prefectures and summarises the distribution. Prefecture counts and property counts are the actual numbers in scope for estimation that month.
| Category | Prefectures in scope | Properties | Listed price all-plan average (tax incl.) | Estimated settled ADR (tax-excl. equivalent) | Highest / lowest prefecture |
|---|---|---|---|---|---|
| Business hotel | 47 | 7,398 | ¥14,115 | ¥7,159 | Tokyo ¥12,306 / Tokushima ¥5,450 |
| City hotel | 46 | 1,114 | ¥21,732 | ¥9,131 | Tokyo ¥22,434 / Yamaguchi ¥6,520 |
| Resort hotel | 47 | 1,613 | ¥43,156 | ¥14,180 | Ehime ¥25,185 (N=8) / Ibaraki ¥7,930 (N=16) |
| Ryokan (traditional inn) | 47 | 6,814 | ¥34,007 | ¥12,105 | Kanagawa ¥19,307 / Ibaraki ¥6,913 |
| Capsule hotel | 7 | 76 | ¥12,374 | ¥4,589 | Hokkaido ¥6,003 (N=5) / Chiba ¥2,846 (N=5) |
Source: Compiled from MetroEngines Research by the HotelBank Editorial Team (July 2026). Both listed price and estimated settled ADR are medians of prefecture medians. Prefectures with fewer than five properties in scope are excluded from the aggregation
Capsule hotels have a thin base — 76 properties nationwide in scope, spread across just seven prefectures. The ¥4,589 median should be treated as indicative and not used for prefecture-level comparison. The resort high (Ehime) also rests on eight properties and needs the same margin of interpretation.
Aggregating by prefecture across all categories, the national median estimated settled ADR for July 2026 was ¥8,974 (17,060 of 36,282 properties had an estimated settled ADR that could be calculated). The chart below shows the top 20 prefectures.
Source: Compiled from MetroEngines Research by the HotelBank Editorial Team (July 2026, 47 prefectures / N=17,060 properties in scope for estimated settled ADR)
| Rank | Prefecture | Estimated settled ADR | Listed price all-plan average | Properties in scope |
|---|---|---|---|---|
| 1 | Okinawa | ¥13,722 | ¥29,766 | 508 |
| 2 | Kanagawa | ¥12,784 | ¥31,908 | 576 |
| 3 | Shizuoka | ¥12,687 | ¥31,632 | 861 |
| 4 | Tokyo | ¥12,642 | ¥22,650 | 1,136 |
| 5 | Oita | ¥12,606 | ¥30,908 | 466 |
| 6 | Kyoto | ¥12,161 | ¥28,689 | 604 |
| 7 | Hokkaido | ¥12,156 | ¥28,693 | 952 |
| 8 | Hyogo | ¥12,027 | ¥34,879 | 545 |
| … | (national median) Niigata | ¥8,974 | ¥22,851 | 421 |
| 45 | Kagoshima | ¥6,522 | ¥16,940 | 317 |
| 46 | Miyazaki | ¥6,498 | ¥15,737 | 166 |
| 47 | Tokushima | ¥6,346 | ¥15,370 | 141 |
Source: Compiled from MetroEngines Research by the HotelBank Editorial Team (July 2026)
Top to bottom, the spread is roughly 2.2x. The point worth holding on to is that a higher rank does not imply a higher listed price. Tokyo ranks fourth on estimated settled ADR at ¥12,642, yet its all-plan average listed price of ¥22,650 is low among the leading prefectures. Hyogo runs the other way: a listed price of ¥34,879, among the highest in the country, against an estimated settled ADR of ¥12,027. The ratios are 0.558 for Tokyo and 0.345 for Hyogo — once the property mix differs, specifically the share of two-meal ryokan and resorts, the relationship between listed price and settled rate changes with it. A cross-prefecture comparison of listed prices cannot be restated as “ADR is higher in that prefecture.” Rates also diverge sharply between municipalities within a single prefecture, a distribution set out in Intra-Prefecture ADR Gaps 2026: Median 2.74x, Okinawa Widest at 5.86x.
How Far Can You Trust Estimated Settled ADR?
If you are going to use an estimate, you owe the reader an upfront statement of how far it can drift. The estimated settled ADR here sets its adjustment factors by matching against the actual per-property ADR that listed hotel REITs publish, and the residuals are then validated. Results by category segment are as follows.
| Segment | Adjustment factor | Validation sample | Median error |
|---|---|---|---|
| Business and city hotels | 0.897 | 132 property-months | 6.0% |
| Resort hotels and ryokan | 0.607 | 34 property-months | 15.8% |
| Overall | — | 184 property-months | 7.5% |
Source: MetroEngines Research (validation period April–May 2026; matched against per-property published ADR from Invincible Investment Corporation; five-fold cross-validation repeated 20 times)
Note the unit carefully. 184 refers to property-months — property × month observations — not to a number of properties. The validation period covers just two months, April and May 2026, so the correct reading is roughly 90-odd properties matched across two months each. Restating this as “validated on 184 properties” would double the apparent coverage.
One more point: accuracy varies sharply by category. Business and city hotels show a median error of 6.0%, but resorts and ryokan sit at 15.8% on a thin validation sample of 34 property-months. This is because listed hotel REITs hold portfolios skewed toward limited-service properties — a constraint that comes from the composition of the matching set rather than from any limit of the estimation method. Estimated settled ADR for ryokan and resorts is therefore usable for relative comparison at prefecture or category level, but not for pinning down an individual property’s rate to a single digit of precision.
For a reference point on the actuals side: Invincible Investment Corporation reported monthly operating results for June 2026 across 103 domestic hotels showing occupancy of 82.2%, ADR of ¥12,306 and RevPAR of ¥10,118, with ADR down 5.0% and RevPAR down 6.0% year on year. That REIT’s holdings are concentrated in business and city hotels, and the reason it sits above this article’s national business-hotel median (estimated ¥7,159) is portfolio skew toward large urban assets. The national median describes the level of a “typical single property,” small regional operators included, and rests on a different population from a REIT portfolio average.
Screening Out Thin-Sample Months — The Case of Hyogo, November 2025
What gets overlooked most often when tracking ADR over time is month-to-month variation in the observation base. In a month where the number of properties in scope drops sharply, the mix of remaining properties skews, and the rate can spike away from reality.
Reviewing monthly series across 47 prefectures × 32 months from January 2024 to August 2026, exactly one month fell below 60% of that prefecture’s monthly median property count: Hyogo in November 2025.
| Month | Properties in scope | Estimated settled ADR | Treatment |
|---|---|---|---|
| October 2025 | 539 | ¥13,326 | Included |
| November 2025 | 34 | ¥17,611 | Excluded |
| December 2025 | 540 | ¥15,145 | Included |
Source: Compiled from MetroEngines Research by the HotelBank Editorial Team. Hyogo’s monthly median over the same period is 560 properties in scope
November 2025 had 34 properties in scope, just 6% of a normal month. That month’s estimated settled ADR of ¥17,611 sits ¥2,500–¥4,300 above the months either side, and the direction of the overshoot lines up with the collapse in the base. This article’s national series recalculates the median with that single point excluded. When working with a monthly ADR series, the safe practice is to check how many properties were observable that month before looking at the value itself.
Connecting ADR, OCC, RevPAR and GOP in a Single Chain
ADR on its own cannot describe revenue, because a rate increase that sacrifices occupancy still raises ADR. Linking ADR through to profit in one chain of equations makes clear which metric answers which layer of the question.
From room rate to gross operating profit (figures from the 30-day model case above)
RevPAR (revenue per available room) bundles price and occupancy into one metric. Track ADR alone and the occupancy loss caused by a rate increase disappears from view.
Multiplying RevPAR by supply (rooms × days) gives rooms-department revenue. Everything to this point is a rooms-department conversation.
GOP is profit after consolidating every department. Whether the breakfast-equivalent amount is allocated to room revenue or to F&B leaves GOP unchanged — but it changes ADR. That is precisely why the allocation rule has to be checked.
Source: Compiled by the HotelBank Editorial Team (amounts from the model case above)
Three working rules follow from this structure. First, whenever you discuss ADR month on month or year on year, always show OCC for the same period alongside it. If ADR is up while RevPAR is down, the story is demand, not pricing. Second, ADR carries no information about supply, so comparing properties with different room counts tells you nothing about the scale of revenue; to compare scale, work on a revenue basis by multiplying RevPAR by room count. Third, ADR is a rooms-department metric, and at ryokan and resorts with a high F&B share, optimising ADR alone may leave GOP unmoved.
Accommodation CPI Is Not ADR — Why a Statistical Index Cannot Set Your Rate Target
You sometimes hear the argument that “the accommodation price index is up X% year on year, so our ADR should be able to rise by the same amount.” But the accommodation component of the Consumer Price Index (CPI) published by the Ministry of Internal Affairs and Communications is built differently from ADR. The CPI is a fixed-basket price index covering accommodation charges nationwide, tax inclusive, not seasonally adjusted, and aggregated across hotels, ryokan and simple lodging alike. ADR, by contrast, is an actual result at the individual property level, tax exclusive, dividing that property’s room revenue by the rooms it actually sold.
Source: Compiled by the HotelBank Editorial Team from the Ministry of Internal Affairs and Communications, “Consumer Price Index” (nationwide, accommodation charges, 2020=100; e-Stat table ID 0003427113)
Source: Compiled from MetroEngines Research by the HotelBank Editorial Team (median estimated settled ADR across 47 prefectures. Months in which properties in scope fell below 60% of that prefecture’s monthly median are excluded — one instance, Hyogo in November 2025)
Overlay the two charts and the seasonal peak in August is common to both. The amplitude is not. The CPI moved from 150.2 in January 2025 to 181.4 in August, +20.8%, while the national median estimated settled ADR moved from ¥8,960 to ¥11,407 over the same span, +27.3%. Because the index is designed to hold the base-year basket constant, it does not pick up the mix shift toward higher-rate categories during peak season nearly as fully as operators experience it.
On a year-on-year basis the difference is wider still. The accommodation CPI rose 5.9% in January 2026, 5.0% in March and 3.1% in June — broadly within a +3% to +6% band. The national median estimated settled ADR, meanwhile, was up 15.6% year on year in January 2026, up 9.5% in March, down 2.9% in June and down 5.6% in July: within a single year it swings from double-digit gains to outright declines.
| 2026 | Accommodation CPI YoY | National median estimated settled ADR YoY | Difference |
|---|---|---|---|
| January | +5.9% | +15.6% | +9.7pt |
| February | +6.0% | +1.4% | −4.6pt |
| March | +5.0% | +9.5% | +4.5pt |
| April | +4.6% | +3.8% | −0.8pt |
| May | +4.8% | +4.1% | −0.7pt |
| June | +3.1% | −2.9% | −6.0pt |
Source: Ministry of Internal Affairs and Communications, “Consumer Price Index” (e-Stat table ID 0003427113) / compiled from MetroEngines Research by the HotelBank Editorial Team. June 2026 is the latest published month for the CPI
Three factors drive the divergence. First, coverage: the CPI takes in accommodation charges nationwide including simple lodging and guesthouses, whereas the estimated settled ADR here has as its population those properties whose prices are observable on OTAs. Second, tax treatment: the CPI is tax inclusive, ADR is tax exclusive as a rule. Third, aggregation method: the CPI is an index using base-period weights, while ADR here is a median of prefecture medians, so shifts in property mix pass straight through.
The conclusion is that the accommodation CPI is a macro thermometer for which way accommodation prices are moving nationwide, not a metric from which to derive an individual property’s pricing target. To build your own ADR target, look at market levels in the same catchment and category and at your own demand curve. Conversely, when you need a medium-term price-growth assumption for a business plan, a broad index like the CPI swings less and is easier to work with. Use each for what it answers.
Frequently Asked Questions
Q. How does ADR differ from RevPAR?
A. ADR is the rate per room actually sold (room revenue ÷ rooms sold), while RevPAR is revenue per available room, with unsold rooms in the denominator (room revenue ÷ available rooms). They are linked by RevPAR = ADR × OCC, so if ADR alone rises while occupancy falls, RevPAR declines. Whether a rate increase worked is judged on RevPAR, not ADR.
Q. Do breakfast charges or bathing tax count toward ADR?
A. Consumption tax, accommodation tax and bathing tax are amounts held on behalf of local authorities and are not included in room revenue. Under USALI principles, breakfast charges should be allocated to the food and beverage department, though in practice some properties book the entire revenue from breakfast-inclusive plans to the rooms department. Before comparing your ADR with another property or a REIT disclosure, confirm first that the allocation rules match.
Q. Can an OTA listed price be used as ADR directly?
A. No. Listed prices are shown on a double-occupancy, per-room, tax-inclusive basis and represent an all-plan average that includes unsold high-rate plans. Measured for July 2026, estimated settled ADR as a ratio of the all-plan average listed price had a property-level median of 0.573 for business hotels, 0.492 for city hotels, 0.362 for resort hotels and 0.340 for ryokan. Treating a listed price as ADR substantially overstates the level.
Q. How does a single-guest booking show up in ADR?
A. It counts once as one room, and that booking’s room revenue goes straight into the numerator. The number of guests does not affect ADR. Guests per room is managed through a separate metric, double occupancy. A figure obtained by dividing a listed price by headcount to get a per-person rate is not ADR.
Q. Isn’t monthly ADR the average of daily ADRs?
A. No. Monthly ADR is monthly room revenue divided by monthly rooms sold, which makes it an average weighted by rooms sold. Taking a simple average of daily ADRs gives equal weight to days with few rooms sold and days with many, and the result diverges from the actual figure.
Q. How accurate is the estimated settled ADR?
A. Matched against per-property published ADR from listed hotel REITs (184 property-months, April–May 2026, five-fold cross-validation repeated 20 times), the median error is 7.5%. By category, business and city hotels come in at 6.0% (132 property-months) and resort hotels and ryokan at 15.8% (34 property-months), the latter being less accurate on a thin validation sample. Note that 184 is a count of property × month observations, not a count of properties.
Conclusion
ADR is room revenue divided by rooms sold — per room, excluding tax, covering only what was sold. The definition itself is simple, but because Japanese OTA displays are quoted on a “double occupancy, per room, tax included” basis, per-room and per-person rates are easily confused, and reading a listed price directly as ADR is a widespread misuse. Measured for July 2026, estimated settled ADR as a ratio of the all-plan average listed price had a property-level median of 0.573 for business hotels and 0.340 for ryokan — close to a twofold spread across categories.
On levels, the national median estimated settled ADR for July 2026 was ¥8,974; by category, ¥7,159 for business hotels, ¥9,131 for city hotels, ¥12,105 for ryokan and ¥14,180 for resort hotels. Across prefectures, the range runs about 2.2x from Okinawa at the top (¥13,722) to Tokushima at the bottom (¥6,346). All of these are estimates, however, and should be read with the median error of 7.5% — 15.8% for resorts and ryokan — in mind.
And ADR alone cannot describe revenue. Keep RevPAR = ADR × OCC always at hand: judge a rate increase on RevPAR, compare scale on room revenue, and judge profit on GOP. A statistical index like the accommodation CPI is useful for reading the direction of the overall market, but in the first half of 2026 the CPI ran at +3% to +6% year on year while the national median estimated settled ADR swung from +15.6% to −5.6% — the index cannot be restated as your own rate target. Every metric answers a different question, and using ADR correctly comes down to holding that line.
Related Reading
- Listed vs Settled ADR Gap: Japan’s 46-Prefecture Upside Map 2026
- H1 2026 ADR YoY: 16 Prefectures Aligned, 31 Split Across 4 Categories
- Intra-Prefecture ADR Gaps 2026: Median 2.74x, Okinawa Widest at 5.86x
- Japan Hotel ADR Polarization 2026: 57.6pt Prefecture×Category Gap
References and Sources
■ Data sources
MetroEngines Research monthly area aggregates (January 2024 – August 2026, 47 prefectures × 32 months) and property-level listed prices and estimated settled ADR. Government statistics are from the Ministry of Internal Affairs and Communications, “Consumer Price Index” (2020 base, accommodation charges, nationwide, monthly / table ID 0003427113). The actuals used for cross-checking are Invincible Investment Corporation’s monthly operating results (June 2026, 103 domestic hotels).
■ Calculation assumptions
Estimated settled ADR is a tax-exclusive-equivalent estimate derived by applying category adjustment factors (0.897 for business and city hotels / 0.607 for resorts and ryokan) to each property’s lowest published OTA plan rate (double occupancy, per room, tax included). Area-level values are medians across properties in scope. Category aggregates exclude prefectures with fewer than five properties in scope. Monthly series exclude any month in which properties in scope fell below 60% of that prefecture’s monthly median (one instance between January 2024 and August 2026: Hyogo, November 2025). The ¥16,000 and 60.0% OCC in the worked example are a model case used in the text, not measured values.
■ Limitations and caveats
Accuracy validation covers 184 property-months (April–May 2026, five-fold cross-validation repeated 20 times) with a median error of 7.5%. “Property-months” counts property × month observations, not properties. The variation by category is large — 6.0% for business and city hotels (132 property-months) against 15.8% for resorts and ryokan (34 property-months) — and the latter cannot be used to judge an individual property’s rate. Because listed prices and estimated settled ADR differ in tax basis, plan coverage and occupancy assumption, the gap between them is a guide to relative levels and not a measure of discounting headroom in itself. The accommodation CPI differs from ADR in coverage, tax basis and basket composition, so growth in the index cannot be restated as a rate target for an individual property.
■ Market data
- MetroEngines Research — estimated settled ADR (July 2026, 47 prefectures, 17,060 properties in scope), all-plan average and lowest-plan listed price levels, category adjustment factors and validation results
■ Government statistics
- e-Stat, Ministry of Internal Affairs and Communications, “Consumer Price Index” 2020 base, price indices by item (table ID: 0003427113, accommodation charges, nationwide, monthly)
- Statistics Bureau of Japan, “Consumer Price Index (CPI)”
■ REIT disclosures
- Invincible Investment Corporation, “Monthly Operating Status for June 2026” (103 domestic hotels)
- Invincible Investment Corporation official site
■ Metric definition references
- Standard treatment of rooms-department metrics under USALI (Uniform System of Accounts for the Lodging Industry)
- Japan Tourism Agency, “Overnight Travel Statistics Survey”