

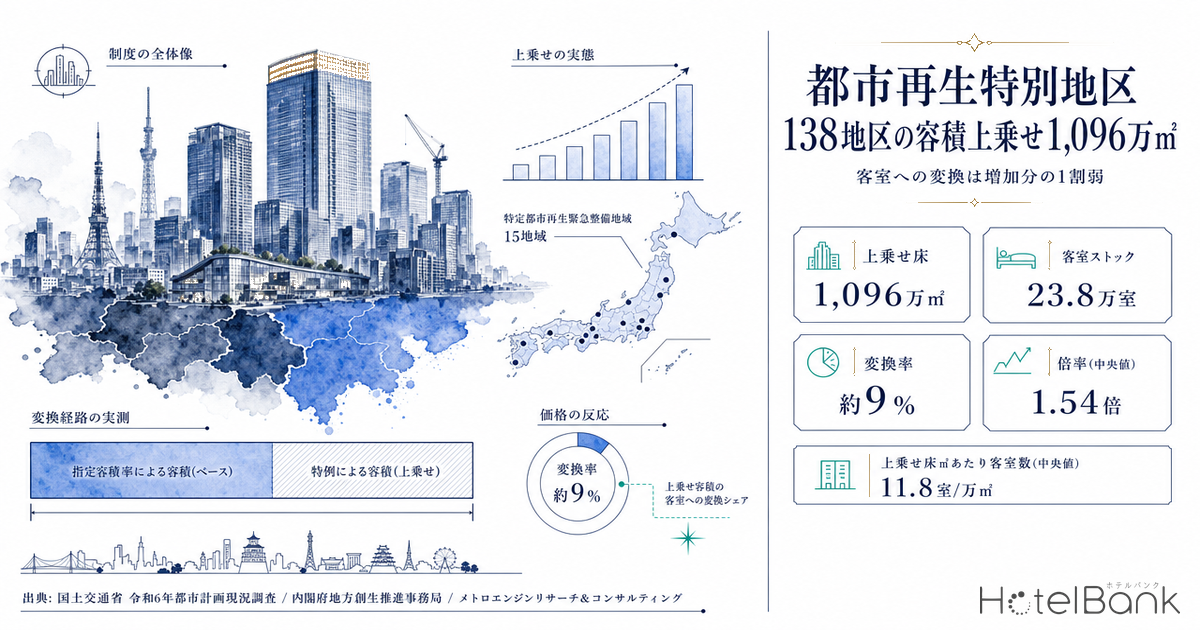
Under Japan’s Act on Special Measures Concerning Urban Renaissance, an Urban Renaissance Special District grants an individual development plan floor area ratio (FAR) above the base FAR set by city planning. According to the Cabinet Office’s Regional Revitalization Promotion Office, 138 districts nationwide had been designated as of April 1, 2026, sitting inside Urban Renaissance Emergency Development Areas that now cover 55 areas and roughly 9,811 hectares (as of July 2, 2025). This article breaks down, across every designated area in Japan, how much floor area the FAR bonus has actually created — and how much of it has been converted into hotel rooms.
How this differs from our earlier coverage
This article covers the discretionary FAR bonus granted through Urban Renaissance Special Districts. Our earlier piece “Hotel Development Capacity 2026: Zoning, FAR & Land Price in 5 Markets” dealt with the base FAR ceiling set under the City Planning Act in five major commercial markets — a different instrument, different data sources and a different scope (5 markets versus 55 areas nationwide). Earlier pieces such as our analysis of the ¥900 billion Tsukiji market site redevelopment examined single projects; this one is a cross-sectional breakdown of 55 areas and 131 districts, not a restatement of individual deals.
Metric Definitions Used in This Article
- Urban Renaissance Emergency Development Area: an area designated by cabinet order under the Act on Special Measures Concerning Urban Renaissance as one where urban development should be advanced on an urgent and priority basis. A Specified Urban Renaissance Emergency Development Area is a subset designated by cabinet order as particularly effective for strengthening a city’s international competitiveness, and receives heavier support measures. The two are nested, not separate sets.
- Urban Renaissance Special District: a district inside an Urban Renaissance Emergency Development Area where the existing zoning restrictions (FAR, height, permitted uses) are set aside and a maximum FAR is instead fixed as city planning for a specific development proposal. “Bonus floor area” in this article is the theoretical floor area calculated as (post-bonus FAR cap − base FAR) × district area.
- ADR (average daily rate): an estimated settled rate (tax-exclusive equivalent) derived by applying a segment-specific adjustment factor to the lowest published plan rate each property lists on OTAs and other channels (double occupancy, per-room, tax-inclusive). Cross-checked against property-level disclosures by listed hotel REITs (91 properties, most recent three months), the median error is about 7%. It is an estimate and differs from each property’s actual transacted rates and accounting figures. Area-level ADR is the median of the properties covered (the level of a typical property in that area). Where listed prices are cited, they are per-room rates at double occupancy (tax-inclusive), averaged across all plans.
- Room stock: the number of rooms in operation at each year-end, reconstructed from the opening and closing years of properties tracked by MetroEngines Research & Consulting. Properties not listed on OTAs are excluded.
- — A 10.96 million sqm bonus (+59.3%). Across the 128 districts where both the base FAR and the post-bonus cap can be read, 18.49 million sqm on a base-FAR basis becomes 29.46 million sqm after the bonus. The median multiple is 1.54x.
- — Under 10% of the increment becomes rooms. Converting the roughly 10 million sqm of bonus floor area in the 15 Specified Area zones at the measured mixed-use density of 11.8 rooms per 10,000 sqm gives about 11,800 rooms — 9.1% (a theoretical ceiling) of the 129,598 rooms those zones actually added from 2003 onward.
- — A 10.5x density gap. Rooms per 10,000 sqm of gross floor area run 11.8 across 23 mixed-use projects versus 123.6 across 53 hotel-only projects. Most bonus FAR is consumed as office and retail floor area.
- — Leverage peaks on low-FAR land. Against a median multiple of 1.52x across the 122 districts starting from commercial zoning, districts starting from quasi-industrial zoning run 2.62x (N=5, reference value). The instrument does the most work when port and former factory land is converted.
- — Concentration and price growth do not move together. Estimated settled ADR in the 18 core wards is up 7-18% year on year, but the two core wards of Osaka — second only to Tokyo in bonus floor area — came in at -0.7% and +2.7%. A high count of special districts reads less as “tight supply and demand” and more as “supply building up over the medium term.”
The framework — 15 of 55 areas are “Specified,” and the FAR bonus is concentrated in 138 districts
Start with the structure of the system. Urban Renaissance Emergency Development Areas have expanded gradually since the framework was created in 2002. The Cabinet Office’s Regional Revitalization Promotion Office reports 55 areas covering roughly 9,811 hectares as of July 2, 2025. In December 2024 the Sanjo Station area in Kyoto and the Matsuyama Castle area moved from candidate status to full designation, followed by the Kanazawa Station East area on July 2, 2025.
Within that, the Specified Urban Renaissance Emergency Development Areas — designated as particularly effective for strengthening international competitiveness — number 15 areas covering roughly 4,339 hectares (as of September 1, 2023). These are not a parallel category but a nested subset: on top of the standard tax and financing support, Specified Areas qualify for priority subsidies such as the International Competitiveness Hub City Development Program. By area, 44% of the 9,811 hectares across the 55 areas falls inside a Specified Area.
The node that connects an area designation to an individual development is the Urban Renaissance Special District. Designation alone adds not one square meter of floor area. Only when a developer submits a concrete plan and it is fixed as city planning, together with the public contributions attached to it, is FAR granted above the base level. As of April 1, 2026 there were 138 such districts, alongside 176 certified private urban renaissance project plans and 47 International Competitiveness Hub City Development Program projects.
The quantitative work in this article uses MLIT’s “FY2024 City Planning Status Survey” (as of March 31, 2024; 131 districts, 268.8 ha, 16 cities), which records area, zoning, base FAR, post-bonus FAR cap and decision date for every district. Those 131 districts are the population for everything that follows; the seven-district gap versus the Cabinet Office’s 138 (as of April 1, 2026) consists of districts approved after the survey’s reference date.
The size of the bonus — a median 1.54x, and 10.96 million sqm added across 128 districts
Of the 131 districts, we calculated the bonus for the 128 districts (247.1 ha in total) where both the base FAR and the post-bonus FAR cap are stated as figures. Applying the base FAR alone yields roughly 18.49 million sqm of floor area; the post-bonus cap allows roughly 29.46 million sqm. The difference — roughly 10.96 million sqm (+59.3%) — is floor area created by the instrument.
Expressed as a multiple, the median is 1.54x, with a first quartile of 1.33x and a third quartile of 1.86x. The largest is the Shinjuku Station Southwest Exit District at 3.33x (600% to 2,000%). Seventy-six districts received a bonus of 1.5x or more and 24 received 2.0x or more, while 28 came in below 1.3x — the bonus is far from uniformly generous.
The distribution skews heavily to Tokyo. Sixty of the 131 districts, covering 143.0 ha, are in Tokyo, and their bonus floor area of roughly 6.26 million sqm is 57% of the national total. Osaka follows with 24 districts, 60.4 ha and roughly 2.84 million sqm (26%). Those two prefectures account for 64% of the districts and 83% of the bonus floor area, leaving the remaining 13 prefectures with just 17% combined. The framework is national in name, but the allocation of floor area is bipolar.
What stands out among the districts with the largest multiples is their original zoning. Four of the top 10 by multiple — Shibaura 1-chome, Takeshiba, Osaki Station West Exit E-East and Kita-Shinagawa 5-chome No. 1 — start from quasi-industrial zoning, lifted from a low base FAR of 300-400% to 750-1,120%. Against a median multiple of 1.52x for the 122 districts starting from commercial zoning, the five starting from quasi-industrial zoning run 2.62x (N=5, a reference value given the small sample). The instrument delivers its greatest leverage exactly where low-FAR land such as port and former factory sites is converted to dense central-city use.
Top 10 districts by bonus floor area
| District | Location | Area (ha) | Base FAR | Post-bonus cap | Multiple | Bonus floor area (sqm) | Decision |
|---|---|---|---|---|---|---|---|
| Umekita Phase 2 Central District | Osaka City, Osaka | 12.0 | 600% | 1100% | 1.83x | 600,000 | R2.4.17 |
| Osaka Station North District | Osaka City, Osaka | 5.5 | 800% | 1600% | 2.0x | 440,000 | H20.2.22 |
| Umeda 1-chome District | Osaka City, Osaka | 3.8 | 1000% | 2000% | 2.0x | 380,000 | H25.4.19 |
| Shibaura 1-chome District | Minato, Tokyo | 4.7 | 400% | 1120% | 2.8x | 338,400 | H30.3.16 |
| Toranomon-Azabudai District | Minato, Tokyo | 8.1 | 600% | 990% | 1.65x | 315,900 | H29.9.12 |
| Nihonbashi 1-chome Central District | Chuo, Tokyo | 3.9 | 800% | 1600% | 2.0x | 312,000 | H30.3.16 |
| Shinagawa Station North Area District | Minato, Tokyo | 9.5 | 600% | 910% | 1.52x | 294,500 | H31.4.26 |
| Nihonbashi 2-chome District | Chuo, Tokyo | 4.8 | 800% | 1400% | 1.75x | 288,000 | H23.12.19 |
| Shinjuku Station Southwest Exit District | Shibuya, Tokyo | 1.9 | 600% | 2000% | 3.33x | 266,000 | R4.11.9 |
| Nihonbashi 1-chome East District | Chuo, Tokyo | 3.6 | 800% | 1530% | 1.91x | 262,800 | R4.3.24 |
The rhythm of approvals — 46% of the total accumulated in the six years from 2018
Reconstructing the time series from decision dates shows an unbroken run of Urban Renaissance Special District approvals since 2003, but a clear wave in the floor area itself. The decade from 2003 to 2012 produced 59 districts and roughly 3.59 million sqm of bonus floor area. The six years from 2018 to 2023 produced 47 districts and roughly 5.03 million sqm — fewer districts, more floor area. Individual projects have grown larger.
2022 was the single biggest year, with 12 districts and roughly 1.45 million sqm. Several large schemes at multiples near 2x were fixed as city planning in that year, including the Shinjuku Station Southwest Exit District (600% to 2,000%), the Nihonbashi 1-chome East District (800% to 1,530%) and the Odori Nishi 4 South District (800% to 1,650%).
Overlaying the framework on the market — 19% of Japan’s rooms sit in the 15 Specified Area zones
From here we connect the framework to market data. For each of the 15 Specified Urban Renaissance Emergency Development Areas we cut a 1.5 km radius from the area’s center point and reconstructed the operating hotel room stock inside it at each year-end. Circular buffers do not align with district boundaries, so this is not a strict zonal tally, but the granularity is sufficient to compare supply trends across the central cores where the FAR bonus is concentrated.
Across the 15 zones, total rooms grew from 108,500 in 2003 to 238,098 in 2026 — an increase of 129,598 rooms, or 2.19x. As of 2026 those zones hold 1,863 properties. Against the roughly 27,000 properties and 1.26 million rooms MetroEngines Research & Consulting tracks nationwide, these 15 zones alone account for 18.9% of rooms. Roughly a fifth of Japan’s accommodation supply is packed into an area that is negligible as a share of the national land mass.
| Rooms, 2003 | 108,500 rooms |
| Rooms, 2019 | 208,610 rooms |
| Rooms, 2026 | 238,098 rooms |
| Growth (2003 to 2026) | +129,598 rooms |
| Properties (2026) | 1,863 properties |
Three of the 15 Specified Areas — Fukuoka City Center, Haneda Airport South / Kawasaki Tonomachi / Daishigawara, and the Osaka Cosmosquare Station area — had no Urban Renaissance Special District approved as of March 31, 2024. Fukuoka City Center has instead used certified private urban renaissance project plans and the International Competitiveness Hub City Development Program, steering development without relying on the FAR bonus. Area designation and special district approval do not move in lockstep.
The 15 Specified Areas: framework side and market side
| Area | Area (ha) | of which Specified (ha) | Special districts | Bonus floor area (10k sqm) | Rooms 2003 | Rooms 2026 | Change |
|---|---|---|---|---|---|---|---|
| Central Tokyo | 2,043 | 2,043 | 39 | 434.6 | 7,936 | 26,411 | +18,475 |
| Osaka Umeda | 490 | 209 | 20 | 255.3 | 10,398 | 27,133 | +16,735 |
| Sapporo | 225 | 145 | 7 | 61.9 | 11,314 | 21,245 | +9,931 |
| Shinjuku | 221 | 221 | 5 | 49.9 | 11,837 | 26,847 | +15,010 |
| Shibuya | 139 | 139 | 7 | 49.7 | 2,620 | 5,557 | +2,937 |
| Nagoya | 401 | 303 | 9 | 49.0 | 9,271 | 20,244 | +10,973 |
| Shinagawa | 184 | 184 | 1 | 29.4 | 15,237 | 24,348 | +9,111 |
| Sendai | 186 | 73 | 5 | 21.8 | 7,389 | 14,554 | +7,165 |
| Yokohama Minato Mirai | 524 | 331 | 4 | 19.4 | 4,766 | 13,953 | +9,187 |
| Kobe Sannomiya | 215 | 45 | 5 | 19.2 | 4,896 | 9,165 | +4,269 |
| Ikebukuro | 143 | 143 | 1 | 6.0 | 5,018 | 9,010 | +3,992 |
| Hiroshima Kamiyacho | 234 | 153 | 5 | 3.5 | 6,304 | 12,123 | +5,819 |
| Kawasaki Tonomachi | 339 | 66 | 0 | 0.0 | 137 | 543 | +406 |
| Cosmosquare | 154 | 53 | 0 | 0.0 | 800 | 1,939 | +1,139 |
| Fukuoka Tenjin | 455 | 231 | 0 | 0.0 | 10,577 | 25,026 | +14,449 |
What the scatter shows is that bonus floor area and room growth are not simply proportional. The Central Tokyo zone pairs 4.346 million sqm of bonus floor area with +18,475 rooms; Osaka Umeda pairs 2.553 million sqm with +16,735. Meanwhile the Fukuoka Tenjin zone has zero approved special districts yet added 14,449 rooms, close to Tokyo and Osaka. The FAR bonus is one route that supports room supply in central cores — but not the only one.
Measuring the conversion — 11.8 rooms per 10,000 sqm in mixed use, under a tenth of hotel-only projects
So at what density does the added floor area actually turn into rooms? From MLIT’s “Construction Dynamics Statistics Survey” we took 84 building plans that include accommodation (15,664 rooms in total) and split the 76 whose use mix could be identified into mixed-use and hotel-only projects.
The 23 mixed-use projects — combining offices, retail or housing — deliver 4,326 rooms across roughly 3.66 million sqm of gross floor area, or 11.8 rooms per 10,000 sqm. The 53 hotel-only projects (including ancillary dining and bathing facilities) deliver 9,715 rooms across roughly 790,000 sqm, or 123.6 rooms per 10,000 sqm. The density gap is 10.5x.
That density gap governs the relationship between the FAR bonus and room supply. Most buildings realized in an Urban Renaissance Special District are large mixed-use towers whose primary uses are office and retail, with the hotel placed on the upper floors as a minor component. The bulk of the added FAR is consumed as office and retail floor area, and only a limited share surfaces as guest rooms.
Put that into numbers. Urban Renaissance Special Districts inside the 15 Specified Area zones carry roughly 10 million sqm of bonus floor area in total. If all of it were converted at the measured mixed-use density of 11.8 rooms per 10,000 sqm, it would yield about 11,800 rooms. Since those same 15 zones actually added 129,598 rooms from 2003 onward, the bonus FAR can account for at most 9.1% of that growth (a theoretical ceiling). In practice not all bonus floor area goes into buildings containing a hotel, so the true contribution is lower still.
The Shibaura 1-chome Urban Renaissance Special District covers 4.7 ha and starts from quasi-industrial zoning with a base FAR of 400%; a maximum FAR of 1,120% was fixed as city planning on March 16, 2018. The bonus floor area comes to roughly 338,400 sqm. The building plan filed at the same address covers roughly 551,000 sqm of gross floor area across 43 above-ground floors, with uses listed as “offices, retail, hotel, parking” and 217 guest rooms, completed in July 2025 (MLIT, “Construction Dynamics Statistics Survey”). That works out to 6.4 rooms per 10,000 sqm of bonus floor area — below even the 11.8-room mixed-use average. Most of the FAR won through the bonus went to offices and retail, with the rooms confined to a limited slice of floor area at the top. This is the standard conversion path from FAR bonus to hotel. A luxury hotel opened within the scheme in July 2025, and the rooms that did reach the market sit at the very top of the central Tokyo price band.
The price response — core wards up 7-18% year on year, with only Osaka flat
Finally, how have prices responded in these areas? For the 18 core wards where Urban Renaissance Special Districts cluster, we compared the trailing 12-month average estimated settled ADR (August 2025 to July 2026) against the same period a year earlier (August 2024 to July 2025).
The highest is Shibuya, Tokyo at ¥25,100 (+11.8% year on year), followed by Chuo, Tokyo at ¥19,300 (+11.9%) and Minato, Tokyo at ¥17,800 (+8.2%). Among regional hubs, Chuo in Fukuoka reaches ¥16,100 (+10.8%), close behind Chiyoda, Tokyo (¥16,400), while Chuo in Sapporo runs ¥14,600 with growth of +14.9%, near the top of the field. Chuo in Kobe posted the strongest growth of all 18 wards at +17.9%.
Chuo in Osaka, by contrast, sits at ¥12,800, down 0.7% year on year, and Kita in Osaka at ¥11,900 is up only 2.7% — flat territory while nearly every other core ward gains 7% or more. Osaka City’s two zones have accumulated 2.553 million sqm of bonus floor area, second only to Central Tokyo, and rooms are up 16,735 versus 2003. Depth of supply is holding price growth down, and this is the asymmetry that is easiest to miss in an investment case: the areas where the FAR bonus worked hardest are the ones where price growth is most restrained. Osaka’s softness also reflects the post-Expo payback rather than supply alone; we separate the two month by month in Osaka Settled ADR June 2026: City -26.3%, Business -32.8% Post-Expo.
Estimated settled ADR and listed price by core ward
| Core ward | Estimated settled ADR Aug 2025 – Jul 2026 | Prior-year period | YoY | Listed price (all-plan avg, tax incl.) | Properties |
|---|---|---|---|---|---|
| Shibuya, Tokyo | ¥25,100 | ¥22,500 | +11.8% | ¥45,400 | 32 |
| Chuo, Tokyo | ¥19,300 | ¥17,200 | +11.9% | ¥32,900 | 150 |
| Minato, Tokyo | ¥17,800 | ¥16,400 | +8.2% | ¥30,800 | 129 |
| Chiyoda, Tokyo | ¥16,400 | ¥15,200 | +7.8% | ¥28,000 | 81 |
| Shinjuku, Tokyo | ¥16,100 | ¥14,800 | +9.3% | ¥29,100 | 95 |
| Chuo, Fukuoka | ¥16,100 | ¥14,500 | +10.8% | ¥26,000 | 81 |
| Chuo, Sapporo | ¥14,600 | ¥12,700 | +14.9% | ¥23,500 | 134 |
| Hakata, Fukuoka | ¥14,300 | ¥12,800 | +11.1% | ¥25,500 | 145 |
| Koto, Tokyo | ¥14,200 | ¥13,000 | +9.0% | ¥24,300 | 41 |
| Shinagawa, Tokyo | ¥13,000 | ¥12,400 | +5.2% | ¥24,200 | 36 |
| Chuo, Osaka | ¥12,800 | ¥12,900 | -0.7% | ¥21,800 | 191 |
| Toshima, Tokyo | ¥12,500 | ¥11,700 | +7.1% | ¥19,800 | 61 |
| Chuo, Kobe | ¥12,200 | ¥10,300 | +17.9% | ¥20,300 | 61 |
| Kita, Osaka | ¥11,900 | ¥11,600 | +2.7% | ¥21,500 | 73 |
| Nakamura, Nagoya | ¥10,400 | ¥9,600 | +8.8% | ¥20,900 | 72 |
| Naka, Hiroshima | ¥10,100 | ¥9,400 | +7.4% | ¥16,500 | 60 |
| Naka, Nagoya | ¥9,700 | ¥8,900 | +8.5% | ¥17,800 | 88 |
| Aoba, Sendai | ¥9,600 | ¥8,700 | +11.0% | ¥17,400 | 71 |
What it means for investment and development — the bonus adds mixed-use floor area, not guest rooms
Three points connect this breakdown to practice.
First, treating the FAR bonus as a way to improve the economics of a standalone hotel is the wrong frame. Every 10,000 sqm of bonus floor area yields 11.8 rooms in mixed use, and only 6.4 in the Shibaura 1-chome case; most of the bonus FAR goes to office and retail. Put the other way round, a hotel’s reason to join a mixed-use scheme is not “gaining FAR” but getting to occupy part of the FAR that the office and retail components won — floor area high in a prime central tower that would otherwise be impossible to secure. Entering a location and an elevation that a standalone project could never support, as a partner in a mixed-use development: that is what hotel participation under the FAR bonus actually looks like.
Second, the leverage of the bonus multiple is maximized on low-FAR zoning. Against a median multiple of 1.52x for the 122 districts starting from commercial zoning, the five starting from quasi-industrial zoning run 2.62x (N=5, a reference value). Areas that still hold low-density land with a base FAR of 300-400% near the city center — ports, former factory sites, railway-related land — offer the greatest upside from the instrument. The lineage running through Shinagawa, Shibaura, Osaki and Kita-Shinagawa in southern central Tokyo is exactly this, and land with the same structure remains in other cities, Yokohama among them (the Kaigan-dori District went from 400% to 1,250%). For a view of development capacity that starts from replacing existing buildings, Japan’s Pre-1981 Hotel Stock: 236k Rooms, 19.1% — Retrofit or Rebuild approaches the question from another angle.
Third, a concentration of FAR bonuses does not necessarily come with faster price growth. Osaka City’s two core wards, second only to Central Tokyo in bonus floor area, sit at -0.7% and +2.7% year on year over the trailing 12 months. Floor area added by the instrument means more supply, which can itself be a headwind on price for incumbent operators. In an investment case, “many special districts” reads less as “demand and supply will tighten” and more as “supply will build up over the medium term.” Which wards carry the heaviest new supply relative to existing stock is quantified ward by ward in Tokyo 23 Wards Supply Pressure 2026: Arakawa 16.0%, Minato Just 4.5%, and reading the two together sharpens site selection.
Sensitivity: converting bonus FAR into rooms (10 million sqm across the 15 Specified Area zones)
| Scenario | Assumed conversion density | Implied rooms | Share of room growth in the 15 zones (2003 to 2026) | Basis |
|---|---|---|---|---|
| Bear | 6.4 rooms per 10k sqm (Shibaura 1-chome actual) | approx. 6,400 rooms | 4.9% | Measured on one large mixed-use scheme |
| Base | 11.8 rooms per 10k sqm (average of 23 mixed-use projects) | approx. 11,800 rooms | 9.1% | Construction Dynamics Statistics Survey, N=23 |
| Bull | 20.0 rooms per 10k sqm (1.7x the mixed-use average) | approx. 20,000 rooms | 15.4% | Upside case assuming a high accommodation share in mixed use |
| Reference | 123.6 rooms per 10k sqm (average of 53 hotel-only projects) | approx. 123,600 rooms | 95.4% | Reference only. Assuming all bonus floor area goes into hotel-only projects is not realistic |
Two-axis sensitivity: conversion density x share allocated to hotel use
The sensitivity table above assumes an upper bound in which all of the bonus floor area across the 15 Specified Area zones goes into buildings that contain a hotel. Because that assumption does not hold in practice, we add the allocation share as a second axis to bracket the range. Each cell is simply 10 million sqm of bonus floor area x allocation share x conversion density, introducing no assumptions beyond those already used above. The upper figure in each cell is the implied room count; the lower figure is its share of the 129,598 rooms added across the 15 zones.
| Density \ Allocation | 20% | 40% | 60% | 80% | 100% |
|---|---|---|---|---|---|
| 6.4 (Shibaura 1-chome actual) | 1,280 rooms 1.0% | 2,560 rooms 2.0% | 3,840 rooms 3.0% | 5,120 rooms 4.0% | 6,400 rooms 4.9% |
| 9.0 | 1,800 rooms 1.4% | 3,600 rooms 2.8% | 5,400 rooms 4.2% | 7,200 rooms 5.6% | 9,000 rooms 6.9% |
| 11.8 (average of 23 mixed-use projects) | 2,360 rooms 1.8% | 4,720 rooms 3.6% | 7,080 rooms 5.5% | 9,440 rooms 7.3% | 11,800 rooms 9.1% |
| 15.0 | 3,000 rooms 2.3% | 6,000 rooms 4.6% | 9,000 rooms 6.9% | 12,000 rooms 9.3% | 15,000 rooms 11.6% |
| 20.0 (upside case) | 4,000 rooms 3.1% | 8,000 rooms 6.2% | 12,000 rooms 9.3% | 16,000 rooms 12.3% | 20,000 rooms 15.4% |
The realistic range lies between the second and third rows — roughly 12,000 to 20,000 rooms, or 9-15% of the 129,598 rooms added across the 15 zones. The instrument’s role in central-city supply is not negligible, but neither is it dominant. Most of the room growth in these cores has come from standalone hotel development built under ordinary building confirmation, without any FAR bonus at all.
Frequently asked questions
Q. What is the difference between an Urban Renaissance Emergency Development Area and a Specified one?
A. A Specified Urban Renaissance Emergency Development Area is a subset of the Emergency Development Areas, designated by cabinet order as particularly effective for strengthening a city’s international competitiveness. The two are nested: as of July 2, 2025 there were 55 Emergency Development Areas covering roughly 9,811 ha, of which 15 Specified Areas covering roughly 4,339 ha (as of September 1, 2023). Specified Areas qualify for priority subsidies such as the International Competitiveness Hub City Development Program on top of the standard tax and financing support (Source: Cabinet Office Regional Revitalization Promotion Office).
Q. Does designation as an Urban Renaissance Emergency Development Area automatically relax the FAR?
A. No. Designation is only a precondition for using the framework; a FAR bonus arises only once an Urban Renaissance Special District is fixed as city planning for a specific development plan. As of April 1, 2026 there were 138 approved districts nationwide, and three of the 15 Specified Urban Renaissance Emergency Development Areas — Fukuoka City Center, Haneda Airport South / Kawasaki Tonomachi / Daishigawara, and the Osaka Cosmosquare Station area — had no approvals as of March 31, 2024.
Q. How large is a typical FAR bonus?
A. Across the 128 districts where both the base FAR and the post-bonus cap can be read, the median multiple is 1.54x (first quartile 1.33x, third quartile 1.86x). The largest is the Shinjuku Station Southwest Exit District at 3.33x (600% to 2,000%). That said, 28 districts came in below 1.3x — the size of the bonus varies widely with the public contributions offered and with site conditions (Source: MLIT, “FY2024 City Planning Status Survey”).
Q. How much of the bonus FAR ends up as guest rooms?
A. Across the 76 building plans containing accommodation whose use mix could be identified, the 23 mixed-use projects delivered 11.8 rooms per 10,000 sqm of gross floor area and the 53 hotel-only projects delivered 123.6. Because what gets built in an Urban Renaissance Special District is mostly large mixed-use towers, the density at which bonus FAR converts into rooms is low. Converting the roughly 10 million sqm of bonus floor area across the 15 Specified Area zones at the mixed-use density gives about 11,800 rooms — 9.1% of the 129,598 rooms those zones actually added from 2003 onward.
Q. Do areas with a concentration of FAR bonuses have higher ADR?
A. The levels are high, but the growth rates are not necessarily. Over the trailing 12 months (August 2025 to July 2026), estimated settled ADR was led by Shibuya at ¥25,100 (+11.8% year on year) and Chuo, Tokyo at ¥19,300 (+11.9%), with central Tokyo occupying the top of the table — yet Osaka City’s two core wards, second only to Tokyo in bonus floor area, sat at -0.7% and +2.7%. Areas where supply is thickening tend to show slower price growth.
A note on the data: The framework-side tallies are based on MLIT’s “FY2024 City Planning Status Survey” (as of March 31, 2024) and therefore exclude Urban Renaissance Special Districts approved from April 2024 onward; this is the source of the gap versus the Cabinet Office’s 138 districts (as of April 1, 2026). The pipeline drawn from the Construction Dynamics Statistics Survey is on a building-confirmation basis, and project and room counts are expected to rise as further applications are filed, so treat them as a floor for the confirmed pipeline at this point in time. Room stock is an estimate reconstructed from the opening and closing years of properties and excludes properties not listed on OTAs. Bonus floor area is a theoretical value based on maximum FAR and does not match the FAR actually used in any given building plan.
Related reading
- Hotel Development Capacity 2026: Zoning, FAR & Land Price in 5 Markets
- Construction +41% & Labor Crunch Erase Japan’s 2027-2029 Hotel Supply
- Tokyo Station Supertall Luxury Hotel Pipeline: Tokyo-Shinagawa-Nagoya Tri-Pole (2027-2028)
- Nagoya Pipeline 2026-2033: Conrad, Andaz & ¥32,628/¥34,115 ADR Flattening
- Tokyo 23 Wards Supply Pressure 2026: Arakawa 16.0%, Minato Just 4.5%
- Japan’s Pre-1981 Hotel Stock: 236k Rooms, 19.1% — Retrofit or Rebuild
- Osaka Settled ADR June 2026: City -26.3%, Business -32.8% Post-Expo
- Hotel Supply Pressure Ranking 2026-2027: Ozu Kumamoto Tops at 30.8%
References and sources
Data sources
Framework-side data come from the Cabinet Office Regional Revitalization Promotion Office, “List of Urban Renaissance Emergency Development Areas and Specified Urban Renaissance Emergency Development Areas” (55 Emergency Development Areas / approx. 9,811 ha as of July 2, 2025; 15 Specified Areas / approx. 4,339 ha as of September 1, 2023; 138 Urban Renaissance Special Districts as of April 1, 2026), and MLIT, “FY2024 City Planning Status Survey (9) Urban Renaissance Special Districts” (as of March 31, 2024; 131 districts, 268.8 ha, 16 cities). Building plans come from MLIT, “Construction Dynamics Statistics Survey” (84 plans containing accommodation, 15,664 rooms, of which 76 had an identifiable use mix). Market-side room stock, estimated settled ADR and listed prices come from MetroEngines Research & Consulting (room stock within a 1.5 km radius of each of the 15 area center points, N=1,863 properties; ADR across the 18 core wards, N=32-191 properties per ward).
Calculation assumptions
Bonus floor area = (post-bonus FAR cap − base FAR) × district area. Only the 128 districts (247.1 ha in total) where both figures can be read are included. Conversion densities are measured from the “Construction Dynamics Statistics Survey”: 11.8 rooms per 10,000 sqm of gross floor area for the 23 mixed-use projects (4,326 rooms across approx. 3.66 million sqm) and 123.6 for the 53 hotel-only projects (9,715 rooms across approx. 790,000 sqm). The formula behind the sensitivity table and the two-axis grid is implied rooms = 10 million sqm of bonus floor area × share allocated to hotel use × conversion density, with the density floor of 6.4 rooms per 10,000 sqm (the Shibaura 1-chome actual) and ceiling of 20.0 (1.7x the mixed-use average) both kept inside the range presented in the text, with no extrapolation. The 129,598-room benchmark is the room growth across the 15 Specified Area zones from 2003 to 2026. ADR figures are averages of the monthly values over the trailing 12 months (August 2025 to July 2026) and the prior-year period (August 2024 to July 2025).
Limitations
The framework-side reference date is March 31, 2024, and the seven-district gap versus the Cabinet Office’s 138 districts (as of April 1, 2026) consists of later approvals. Bonus floor area is a theoretical value based on maximum FAR and does not match the FAR actually used in any given building plan. On the market side, the 1.5 km radius is a circular buffer that does not align with district boundaries, and framework-side bonus floor area is compiled for the whole Emergency Development Area rather than as a subset of that radius — so the two are separately compiled figures placed side by side, and represent neither a conversion rate nor a causal relationship. Room stock is an estimate reconstructed from opening and closing years and excludes properties not listed on OTAs. ADR is an estimate and differs from each property’s actual transacted rates and accounting figures. The sensitivity analysis and two-axis grid are both simplified estimates; an individual investment decision requires a detailed feasibility study.
Regulatory and government data
- Cabinet Office Regional Revitalization Promotion Office, “List of Urban Renaissance Emergency Development Areas and Specified Urban Renaissance Emergency Development Areas” (55 Emergency Development Areas / approx. 9,811 ha; 15 Specified Areas / approx. 4,339 ha; 138 Urban Renaissance Special Districts; 176 certified private urban renaissance project plans; 47 International Competitiveness Hub City Development Program projects)
- MLIT, “FY2024 City Planning Status Survey” (9) Urban Renaissance Special Districts (as of March 31, 2024; 131 districts, 268.8 ha, 16 cities)
- MLIT, “Measures in Urban Renaissance Emergency Development Areas”
- MLIT, “Support Measures for Certified Private Urban Renaissance Project Plans”
- MLIT, “Construction Dynamics Statistics Survey” (84 building plans containing accommodation, 15,664 rooms)
Market data
- MetroEngines Research & Consulting — estimated settled ADR (N=32-191 properties per ward), room stock reconstruction (15 zones, N=1,863 properties), nationwide tracking of approx. 27,000 properties and approx. 1.26 million rooms