

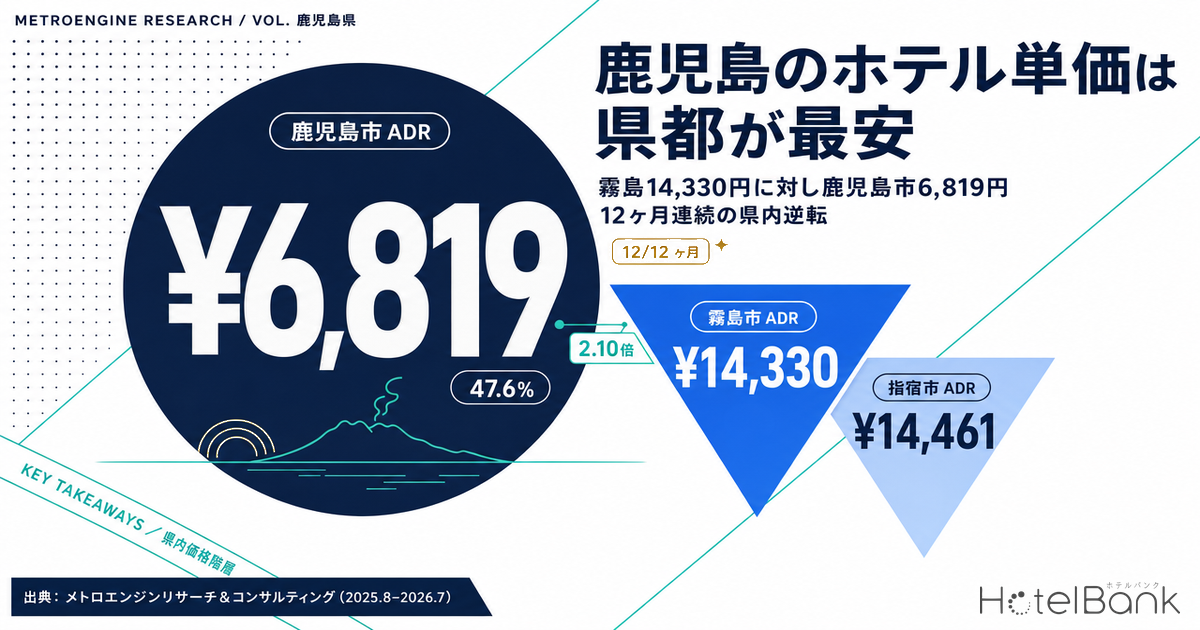
In Kagoshima Prefecture, the cheapest place to stay is the prefectural capital. Over the most recent 12 months (August 2025 – July 2026), estimated settled ADR compiled by MetroEngines Research runs to ¥14,330 in Kirishima City and ¥14,461 in Ibusuki City, against just ¥6,819 in Kagoshima City — the capital sits at 47.6% of the onsen (hot spring) towns. And this is not an inversion that happened to occur in one particular month: it holds in all 12. This article decomposes the explanatory variables behind that intra-prefecture price hierarchy — trade area (employment and resident population), land prices, the rate-band composition of room stock, and the prices J-REITs have actually paid to acquire assets in the prefecture.
Metric Definitions Used in This Article
- ADR (average daily rate): an estimated settled rate (tax-exclusive equivalent), derived by applying a category-specific adjustment factor to the lowest plan rate each property publishes on OTAs (two guests per room, per-room rate, tax-inclusive). Cross-checked against per-property disclosures from listed hotel REITs, the median error is about 7%. These are estimates and differ from each property’s actual transacted rates and accounting figures. Area-level ADR is the median across the properties covered (the level of a typical property in that area).
- Listed price: the per-room rate averaged across all plans (room-only through meals-included), tax-inclusive. Because it rests on a different basis from ADR, the two are never placed in the same table.
- OCC (occupancy): rooms sold as a share of total rooms in the area (estimated from OTA sales inventory).
- LT (lead time): days remaining until check-in. LT0 = the day itself. Early sell-out LT = the lead time at which remaining rooms first reached zero (a larger value means it sold out earlier).
- Data source: MetroEngines Research & Consulting
- — The capital is the cheapest place in the prefecture — estimated settled ADR is ¥6,819 in Kagoshima City against ¥14,330 in Kirishima and ¥14,461 in Ibusuki. The capital sits at 47.6% of the onsen towns, and the inversion holds in all 12 of the most recent months (N=317 properties).
- — ADR and land prices run in opposite directions — commercial land in Tenmonkan is ¥1,180,000/sqm against ¥78,400/sqm in Kokubu, Kirishima: 15.1x. In the capital, where room rates are half as high, land costs 15 times as much.
- — The gap is in stock composition, not in averages — rooms above ¥15,000 number 1,144 of 8,724 in Kagoshima City (13.1%), versus 50.5% in Ibusuki and 40.8% in Kirishima.
- — J-REITs already hold 8 properties in the prefecture — acquisition price per room runs ¥34.8mn–79.9mn in Kirishima against ¥9.2mn–17.6mn in Kagoshima City. A 2.1x gap in ADR widens to 2.0–3.8x in asset prices.
- — New-build ¥52mn–62mn per room vs ¥9mn–35mn actually paid — with construction costs staying high, the near-term battleground is not new development but the acquisition and repositioning of existing stock.
An intra-prefecture price hierarchy that inverts in all 12 months — the capital’s best month never reaches the onsen towns’ worst
Start by nailing down the facts. The chart below plots monthly estimated settled ADR for Kagoshima City, Kirishima City and Ibusuki City. The Kagoshima City line never crosses the other two at any point in the 12 months (Kirishima and Ibusuki do trade places from month to month). Even Kagoshima City’s best month — ¥8,042 in August 2025 — sits 29% below Kirishima’s worst month of ¥11,296 in June 2026, and 38% below Ibusuki’s worst month of ¥12,945. Between the capital and the onsen towns lies a level difference that seasonal swings do not close.
Expressed as a ratio, Kagoshima City over Kirishima City stays within a monthly range of 38.2%–54.8%, averaging 47.6% across the 12 months. The gap is widest at the start of the year (January 2026: 38.2%), a month when onsen demand concentrates while business demand in the capital thins out. It is narrowest in August 2025 and June 2026 — and even then the capital only reaches about 55% of the onsen towns.
For the prefecture as a whole, estimated settled ADR is ¥6,848 (12-month average, N=317 properties), up 2.9% from ¥6,655 a year earlier. The prefectural average sits close to the capital’s level because room stock within the prefecture is concentrated in Kagoshima City. Broken out by municipality, it looks like this.
| Municipality | Estimated settled ADR 12-month avg. | vs Kagoshima City | Listed properties (monthly avg.) | Properties used for ADR, N | Room stock |
|---|---|---|---|---|---|
| Kagoshima City | ¥6,819 | — | 101.2 | 72.6 | 11,488 rooms / 182 properties |
| Kirishima City | ¥14,330 | 2.10x | 85.8 | 56.7 | 3,686 rooms / 158 properties |
| Ibusuki City | ¥14,461 | 2.12x | 35.5 | 19.8 | 1,802 rooms / 64 properties |
| Satsumasendai City | ¥6,099 | 0.89x | 25.5 | 20.2 | 1,898 rooms / 112 properties |
| Kanoya City | ¥5,643 | 0.83x | 22.3 | 12.0 | 1,256 rooms / 48 properties |
| Satsuma Town | ¥13,590 | 1.99x | 9.0 | 8.0 | — |
Satsumasendai at ¥6,099 and Kanoya at ¥5,643 sit in essentially the same band as Kagoshima City. The prefecture is therefore split cleanly in two: an approximately ¥6,000 band covering the capital plus the industrial and administrative cities, and an approximately ¥14,000 band covering Kirishima, Ibusuki and Satsuma. What distinguishes Kagoshima is that almost no municipality represents the intermediate ¥8,000–12,000 band.
The rate-band structure of central Kagoshima City itself — the gap in the upper-midscale band and the premium attached to Sakurajima views — is a separate subject, so this article keeps to what is needed to explain the intra-prefecture hierarchy. On how booking timing differs by property category, see Kagoshima Summer Booking Curves: 23.2pt Gap by Type at 45 Days Out.
Variable 1: the trade area — the capital has many people and low rates; the onsen towns have few people and high rates
The first variable behind the inversion is the nature of demand itself. Economic Census aggregates within a 1 km radius of Kagoshima-Chuo Station show 3,335 establishments and 34,417 workers; around Tenmonkan the figures are 4,585 establishments and 42,094 workers. Office-type workers account for 19.2% and 19.9% respectively, so lodging demand centres on business travel. Business demand books frequently and is highly price-elastic, which pulls rates toward the business-hotel band.
Within a 1 km radius of Ibusuki Station, by contrast, there are only 185 establishments and 1,776 workers, with an office-type share of 3.7%. For the 1 km radius around the Kirishima Onsen district (near Kirishima Jingu shrine), the Economic Census contains no small-area unit in scope, so no figures are returned. This does not mean employment is zero; it means the mesh is simply not recorded in the data. Kirishima’s demand structure therefore cannot be argued from employment data, and this article reads it instead from resident population and lodging inventory.
| Location (1 km / 1.5 km radius) | Establishments | Workers | Office-type share | Resident pop. 2025 estimate | 2040 change | Senior share 2025 |
|---|---|---|---|---|---|---|
| Kagoshima-Chuo Station | 3,335 | 34,417 | 19.2% | 62,068 | -4.4% | 25.7% |
| Tenmonkan | 4,585 | 42,094 | 19.9% | 46,240 | -8.0% | 29.1% |
| Ibusuki Station | 185 | 1,776 | 3.7% | 5,532 | -24.3% | 38.2% |
| Kirishima Onsen district | Not recorded | Not recorded | — | 706 | -19.8% | 44.9% |
What the numbers show is that the people generating demand are fundamentally different. The capital runs on high-volume, low-margin traffic sustained by routine business travel; the onsen towns run on a smaller number of visitors who each pay a high price per night. That is precisely why rates and trade-area size line up in opposite directions.
Just 706 people live within 1.5 km of the Kirishima Onsen district, 44.9% of them seniors, and the figure is projected to fall to 586 by 2040. That may constrain the local labour supply, but lodging demand itself arrives from outside the area. Investment here is therefore not about capturing a trade-area population; it is about owning a vehicle that receives out-of-area demand at a high rate.
Variable 2: land prices — in the capital, where rates are half as high, land costs 15 times as much
The second variable is land cost. According to the 2026 Official Land Price Survey (valuation date January 1, 2026), the highest commercial point in Tenmonkan (Higashisengoku-cho) stands at ¥1,180,000/sqm, up 1.7% year on year, while the area in front of Kagoshima-Chuo Station (Chuo-cho) is ¥936,000/sqm, up 1.4%. Commercial land in Kokubu-Chuo, Kirishima City, by contrast, is ¥78,400/sqm, flat year on year, and Minato in Ibusuki City is ¥42,200/sqm, down 1.6%.
In other words, against a Kirishima whose ADR is 2.1x higher, Kagoshima City’s land is 15.1x more expensive. This structure — ADR and land prices running in opposite directions — is the single biggest factor separating investment decisions within the prefecture.
| Location (standard site no.) | 2026 official land price | YoY | Zoning | FAR | City ADR |
|---|---|---|---|---|---|
| Kagoshima City, Higashisengoku-cho (Kagoshima 5-16) | ¥1,180,000/㎡ | +1.7% | Commercial zone | 700% | ¥6,819 |
| Kagoshima City, Chuo-cho (Kagoshima 5-25) | ¥936,000/㎡ | +1.4% | Commercial zone | 600% | ¥6,819 |
| Kirishima City, Kokubu-Chuo 3-chome (Kirishima 5-1) | ¥78,400/㎡ | ±0.0% | Commercial zone | 400% | ¥14,330 |
| Ibusuki City, Minato 1-chome (Ibusuki 5-1) | ¥42,200/㎡ | -1.6% | Commercial zone | 400% | ¥14,461 |
| Satsumasendai City, Nishimukada-cho (Satsumasendai 5-1) | ¥82,300/㎡ | -1.8% | Commercial zone | 400% | ¥6,099 |
| Kanoya City, Otemachi (Kanoya 5-2) | ¥41,600/㎡ | -0.7% | Commercial zone | 400% | ¥5,643 |
Look at the zoning and the picture sharpens. Around Tenmonkan, commercial zones with a floor area ratio of 400–600% dominate, suiting tower-format development that consumes the full permitted FAR. Around Kokubu in Kirishima City there are two commercial-zone parcels at 400%, with the surroundings mostly Category 1 Mid/High-rise Exclusive Residential and Category 1 Residential zones at 200% — a fit for low-rise, dispersed lodging formats. Around Ibusuki Station, zoning within a 1 km radius consists of Category 1 Mid/High-rise Exclusive Residential and Category 2 Residential zones (both 200%), so density-stacking development is not contemplated at all. Cheap land does not automatically mean you can build densely.
Note that no Official Land Price Survey standard site is set within 1 km of the Kirishima Onsen district (an onsen area at 600–850 m elevation), so land values there cannot be read directly from the survey. This article uses commercial land prices in Kirishima City’s urban areas (Kokubu and Hayato) as the city’s representative value.
Rate-band composition of room stock — only 1,144 of the capital’s 8,724 rooms clear ¥15,000
Next, is the rate gap a case of a handful of luxury properties pulling up the average, or is the composition of the whole stock genuinely different? For every listed property in each city we computed a property-level estimated settled ADR (12-month average) and then aggregated rooms by rate band.
| City | Properties | Rooms | Rooms at ¥15,000+ | Share | Rooms under ¥10,000 | Share |
|---|---|---|---|---|---|---|
| Kagoshima City | 68 | 8,724 | 1,144 | 13.1% | 6,667 | 76.4% |
| Kirishima City | 44 | 2,382 | 972 | 40.8% | 789 | 33.1% |
| Ibusuki City | 17 | 1,106 | 559 | 50.5% | 214 | 19.3% |
In the capital, 1,144 of 8,724 rooms clear ¥15,000 — a 13.1% share. In Ibusuki half the stock (50.5%) sits in that band, and in Kirishima four in ten (40.8%). This is not a difference in averages; it is a difference in how the stock itself has accumulated.
The combination with scale matters just as much. Kagoshima City has 56 properties of 50 rooms or more, but only 6 of them sit above ¥15,000. Kirishima has 13 properties of 50 rooms or more, 6 of them above ¥15,000; Ibusuki has 4 out of 9. The capital is locked into large-but-cheap, the onsen towns into expensive-but-small (or few in number).
Crowded The occupied territory
¥5,000–10,000 × 50–250 rooms
The workhorse of Kagoshima City lodging. 76.4% of its 8,724 rooms are stacked in this band, which makes differentiation hard for a same-format new entrant.
WS① Mid-scale, high-rate onsen properties
¥15,000–30,000 × 50–120 rooms
Only 6 properties in Kirishima and 4 in Ibusuki. This band has the strongest track record as a vehicle for out-of-area demand, and room remains to add to it.
WS② The capital’s mid-rate band
¥10,000–15,000 × 50–150 rooms
Across all sizes, only 7 properties and 913 rooms in Kagoshima City sit in this band, and just 2 of them are mid-scale at 50–150 rooms. Whether the capital’s rates improve turns on whether this band can be thickened.
Supply pipeline and measured demand — only two openings above 20 rooms in the prefecture in 2026
On the supply side, 32 new openings totalling 350 rooms were confirmed in listings across Kagoshima Prefecture in 2026. The great majority, however, are small properties of 1–7 rooms such as rental villas and guesthouses; only two exceed 20 rooms. They are Hotel Gran Cereso Kagoshima Tenmonkan (ホテルグランセレッソ鹿児島天文館; 151 rooms, city hotel, March 2026) and Super Hotel Kirishima Natural Hot Spring (スーパーホテル霧島天然温泉; 150 rooms, August 2026).
| Opening | Property | Rooms | Location | Share of that city’s room stock |
|---|---|---|---|---|
| March 2026 | Hotel Gran Cereso Kagoshima Tenmonkan | 151 | Kagoshima City | 1.3% |
| August 2026 | Super Hotel Kirishima Natural Hot Spring | 150 | Kirishima City | 4.1% |
Measured against existing stock, supply pressure is 4.1% in Kirishima City versus 1.3% in Kagoshima City — three times stronger on the Kirishima side. But the new Kirishima property sits in a business-leaning rate band, which places it where it is unlikely to compete directly with WS1 above (¥15,000–30,000 × 50–120 rooms). It is supply aimed closer to Kirishima’s sub-¥10,000 band (19 properties, 789 rooms), meaning the same competitive environment as the capital’s low-rate segment is now spreading to the doorstep of the onsen towns. Municipalities across Japan ranked side by side on this existing-stock yardstick are collected in Hotel Supply Pressure Ranking 2026-2027: Ozu Kumamoto Tops at 30.8%.
In planning data based on MLIT’s Building Dynamics Statistics Survey, no building-confirmation application of 50 rooms or more is currently extracted for Kagoshima Prefecture. This is data whose counts grow as further applications are filed, so treat it as a floor on the confirmed pipeline as of today.
A measurement from the demand side is worth adding. Taking the 2026 Obon peak date (August 14) and aggregating remaining-room trajectories only for properties that release at least 30% of total rooms to OTAs, observation data was available for 286 of 800 properties in the prefecture, leaving 140 after filtering. Among the top 100 properties by early sell-out LT, Kirishima City accounts for the largest share at 21, ahead of Kagoshima City’s 16. Given that Kirishima’s room stock is only 32% of Kagoshima City’s, the difference in demand density is unmistakable.
| City | Count in the top 100 | Room stock | Density per unit of stock |
|---|---|---|---|
| Kirishima City | 21 | 3,686 rooms | 5.7 properties per 1,000 rooms |
| Kagoshima City | 16 | 11,488 rooms | 1.4 properties per 1,000 rooms |
| Satsumasendai City | 7 | 1,898 rooms | 3.7 properties per 1,000 rooms |
Among the early sell-outs, a 20-room inn in Kirishima City hit zero remaining rooms as early as LT90 and was observed sold out on 57 days in total. A 12-room onsen inn in the same city also reached zero at LT90, with 7 sold-out days in total once inventory that came back is counted. Small, high-rate vehicles fill three months ahead of the peak date.
J-REITs already hold 8 properties in the prefecture — ¥34.8mn per room in Kirishima against ¥16mn–18mn in the capital
This price hierarchy shows up in actual transaction prices too. Cross-checking the ownership master for the seven hotel-focused J-REITs exhaustively — not only on prefecture name but on municipality names, onsen district names and brand names — turns up 8 properties in Kagoshima Prefecture. Note that some properties carry the string “Kagoshima” in neither the property name nor the location field, so a partial match on prefecture name alone will miss them.
| Location | Property | Holding REIT | Rooms | Acquisition price | Price per room | Acquired |
|---|---|---|---|---|---|---|
| Kirishima City | KAI Kirishima | Hoshino Resorts REIT | 49 | ¥3,913mn | ¥79.9mn | December 2021 |
| Kirishima City | Kirishima Kokusai Hotel | Invincible Investment Corp. | 188 | ¥6,534mn | ¥34.8mn | August 2025 |
| Kagoshima City | Hotel MyStays Kagoshima Tenmonkan | Invincible Investment Corp. | 196 | ¥3,445mn | ¥17.6mn | July 2019 |
| Kagoshima City | Hotel MyStays Kagoshima Tenmonkan Annex | Invincible Investment Corp. | 73 | ¥1,168mn | ¥16.0mn | July 2019 |
| Kagoshima City | Art Hotel Kagoshima | Invincible Investment Corp. | 208 | ¥3,395mn | ¥16.3mn | July 2024 |
| Kagoshima City | Comfort Inn Kagoshima Taniyama | Hoshino Resorts REIT | 217 | ¥1,995mn | ¥9.2mn | August 2015 |
| Kagoshima City | fav Kagoshima Chuo | Kasumigaseki Hotel REIT | 51 | — | — | — |
| Kagoshima City | FAV LUX Kagoshima Tenmonkan | Kasumigaseki Hotel REIT | 63 | — | — | — |
Acquisition price per room runs ¥34.8mn–79.9mn in Kirishima City against ¥9.2mn–17.6mn in Kagoshima City. Against a 2.1x gap in ADR, transaction prices differ by 2.0–3.8x. The reading is that higher rates are priced straight into asset values.
Most recently, Invincible Investment Corporation acquired Kirishima Kokusai Hotel (188 rooms) for ¥6,534mn in August 2025. The average assumed NOI yield disclosed for the 10 domestic hotels it acquired at the same time (¥34,284mn in total) was 6.6% — meaning a listed REIT is buying mid-scale full-service assets in the prefecture’s onsen towns at that yield level.
The investment call — new-build costs ¥52mn–62mn per room; actual acquisitions ran ¥9mn–35mn
Finally, we model whether this hierarchy favours new development or the acquisition of existing assets. The assumption is an upper-midscale property of 50 rooms, average room size 35 sqm, guestroom-area ratio 60% (gross floor area 2,917 sqm = 882 tsubo).
Construction cost is set in two stages. Stage one is on a 2025 actuals basis: ¥2.5mn per tsubo, the benchmark for the upper-midscale band derived from MLIT’s Construction Starts Statistics. Stage two assumes completion in 2028 and builds in inflation over the construction period. Chaining Turner & Townsend’s construction cost forecasts (+5.3% in 2026, +5.0% in 2027) to this article’s own assumption for 2028 (+4.5%), which reflects the firm’s view that the pace of increase moderates from 2027 onward, gives a mid-construction unit cost of ¥2.889mn per tsubo and a construction cost of ¥2,549mn.
| Item | A. Kirishima City (Kokubu, commercial zone 400%) | B. Kagoshima City (Tenmonkan, commercial zone 600%) |
|---|---|---|
| Rooms / gross floor area | 50 rooms / 2,917 sqm | 50 rooms / 2,917 sqm |
| Site area required (assuming full FAR use) | 729㎡ | 486㎡ |
| Land acquisition (at 2026 official land prices) | ¥57mn | ¥574mn |
| Construction cost (2025 actuals, ¥2.5mn/tsubo) | ¥2,206mn | ¥2,206mn |
| Construction cost (built 2028, ¥2.889mn/tsubo) | ¥2,549mn | ¥2,549mn |
| Total investment (after inflation) | ¥2,606mn | ¥3,122mn |
| Total investment per room | ¥52.1mn | ¥62.4mn |
| Assumed ADR / assumed occupancy Full-year assumptions (completion assumed in 2028). These are not observed occupancy rates. | ¥20,000 / 70% | ¥12,000 / 72% |
| Annual room revenue | ¥256mn | ¥158mn |
| GOP (30% margin) | ¥76.6mn | ¥47.3mn |
| GOP yield on total investment | 2.9% | 1.5% |
| Sensitivity analysis (Kirishima City scenario) | Base | ADR -10% | OCC -5pt | Both |
|---|---|---|---|---|
| Annual room revenue | ¥256mn | ¥230mn | ¥237mn | ¥214mn |
| GOP | ¥76.6mn | ¥69.0mn | ¥71.2mn | ¥64.1mn |
| GOP yield on total investment | 2.9% | 2.6% | 2.7% | 2.5% |
| Assumed ADR \ assumed occupancy (full-year assumptions, completion assumed in 2028) | 60% | 65% | 70% | 75% | 80% |
|---|---|---|---|---|---|
| ¥16,000 | 2.0% | 2.2% | 2.4% | 2.5% | 2.7% |
| ¥18,000 | 2.3% | 2.5% | 2.6% | 2.8% | 3.0% |
| ¥20,000 | 2.5% | 2.7% | 2.9% | 3.2% | 3.4% |
| ¥22,000 | 2.8% | 3.0% | 3.2% | 3.5% | 3.7% |
| ¥24,000 | 3.0% | 3.3% | 3.5% | 3.8% | 4.0% |
The conclusion is simple. At today’s construction costs, total investment per room for a new build comes to ¥52mn–62mn in either part of the prefecture. Against that, the prices J-REITs actually paid in Kagoshima were ¥34.8mn per room in Kirishima City and ¥16.3mn–17.6mn in Kagoshima City. Even in Kirishima, building new requires roughly 1.5x the capital of buying; in Kagoshima City it takes more than 3.5x. The gap between those two numbers is enough on its own to explain why the near-term battleground in this prefecture is not new development but the acquisition and repositioning of existing stock.
Kirishima and Ibusuki — markets where the rate comes first
ADR has held in the ¥14,000s for 12 straight months, and 40–50% of rooms clear ¥15,000. Land costs one-fifteenth of the capital’s. Acquiring an existing mid-scale property and shifting its room mix toward the upper band is the highest-efficiency move per unit of capital deployed.
Kagoshima City — a market with rate headroom left
76.4% of its 8,724 rooms sit under ¥10,000. On top of a stable floor of business demand, only 7 properties and 913 rooms serve the ¥10,000–15,000 band. Thicken that band and the capital’s ADR level can be pushed up.
Common to both — acquire rather than build
Total investment per room for a new build is ¥52mn–62mn; REITs actually paid ¥9mn–35mn. While construction costs stay elevated, acquiring and renovating existing stock has the advantage on the recoverability of deployed capital.
Related Reading
- Kagoshima Summer Booking Curves: 23.2pt Gap by Type at 45 Days Out
- Intra-Prefecture ADR Gaps 2026: Median 2.74x, Okinawa Widest at 5.86x
- Miyazaki & Saga Hotel Investment Whitespace: Zero Hotels at ¥18-25k
- Obon T-7: Kyushu’s 31.7pt Gap — Fukuoka 73.0%, Kagoshima 41.3%
- Autumn on Japan’s Islands: 2.37x ADR Gap Across 10 Municipalities
- Tottori’s 3-Tier Hotel Market: Onsen ADR 2.16x the City Average
- Hotel Supply Pressure Ranking 2026-2027: Ozu Kumamoto Tops at 30.8%
References and Sources
■ Data sources
Estimated settled ADR, listed property counts, room stock, new openings and remaining-room trajectories (early sell-out LT) are aggregated by MetroEngines Research & Consulting. The period covered is the 12 months from August 2025 to July 2026, Kagoshima Prefecture N=317 properties (by municipality: Kagoshima City N=72.6 / Kirishima City N=56.7 / Ibusuki City N=19.8). Land prices and zoning come from MLIT’s Real Estate Information Library (Official Land Price Survey, valuation date January 1, 2026); employment from the Ministry of Internal Affairs and Communications / Ministry of Economy, Trade and Industry Economic Census for Business Activity (boundaries = 2020 Population Census small areas); resident population from MLIT’s National Land Numerical Information (projected population by 250 m mesh, 2024 National Spatial Planning Bureau projection). J-REIT holdings come from the ownership master covering seven hotel-focused REITs and 302 properties (as of August 17, 2026).
■ Calculation assumptions
Estimated settled ADR is an estimate (tax-exclusive equivalent) obtained by applying a category-specific adjustment factor to the lowest plan rate each property publishes on OTAs (two guests per room, per room, tax-inclusive); area values are the median across the properties covered. All 12 months are aligned on a settled-month (actuals) basis, with no listing-snapshot months mixed in. The development estimate assumes 50 rooms, average room size 35 sqm, a guestroom-area ratio of 60% (gross floor area 2,917 sqm = 882 tsubo) and full use of the designated floor area ratio. Construction cost takes the 2025 actual of ¥2.5mn per tsubo and applies Turner & Townsend’s Japan market forecasts (+5.3% for 2026, +5.0% for 2027) plus this article’s own 2028 assumption (+4.5%) through to the mid-construction point, giving ¥2.889mn per tsubo; the GOP margin is set at a conservative 30% for rooms-focused properties. Annual room revenue = assumed ADR × 50 rooms × 365 days × assumed OCC.
■ Limitations and caveats
ADR figures are estimates and differ from each property’s actual transacted rates and accounting figures (cross-checked against per-property disclosures from listed hotel REITs, the median error is about 7%). Because no Economic Census small-area unit is recorded in scope for the 1 km radius around the Kirishima Onsen district, that area’s demand structure cannot be argued from employment data. No Official Land Price Survey standard site is set there either, so commercial land prices in the urban areas (Kokubu and Hayato) stand in as the city’s representative value. The ownership master covers the seven hotel-focused REITs and excludes holdings by diversified REITs, private funds and operating companies. For the two Kasumigaseki Hotel REIT properties, we refrain from quoting acquisition price and room counts because they are recorded in a different format from the other REITs. The development estimate is a simplified model; an actual investment decision requires a detailed feasibility study.
■ Market data
- MetroEngines Research & Consulting — estimated settled ADR (by municipality and by property), room stock, new openings based on confirmed OTA listings, and remaining-room trajectories (early sell-out LT)
■ Government statistics and public data
- MLIT, Real Estate Information Library — Official Land Price Survey (valuation date January 1, 2026) and city-planning determination data (zoning)
- MLIT, National Land Numerical Information — projected population by 250 m mesh (2024 National Spatial Planning Bureau projection)
- Ministry of Internal Affairs and Communications / Ministry of Economy, Trade and Industry, Economic Census for Business Activity — establishment and worker counts (boundaries = 2020 Population Census small areas)
- MLIT, Construction Starts Statistics Survey — reference for construction cost per tsubo
■ REIT and industry reports
- Invincible Investment Corporation, “Notice Concerning Completion of Acquisition of Domestic Real Estate Trust Beneficiary Interests” (August 27, 2025) — Kirishima Kokusai Hotel ¥6,534mn; 10 properties totalling ¥34,284mn
- Invincible Investment Corporation — portfolio list
- Hoshino Resorts REIT — portfolio list
- Kasumigaseki Hotel REIT — portfolio list
- Turner & Townsend「Trends shaping Japan’s construction market in 2026」 — forecast construction cost inflation for Japan (5.6% in 2025 / 5.3% in 2026 / 5.0% in 2027)