

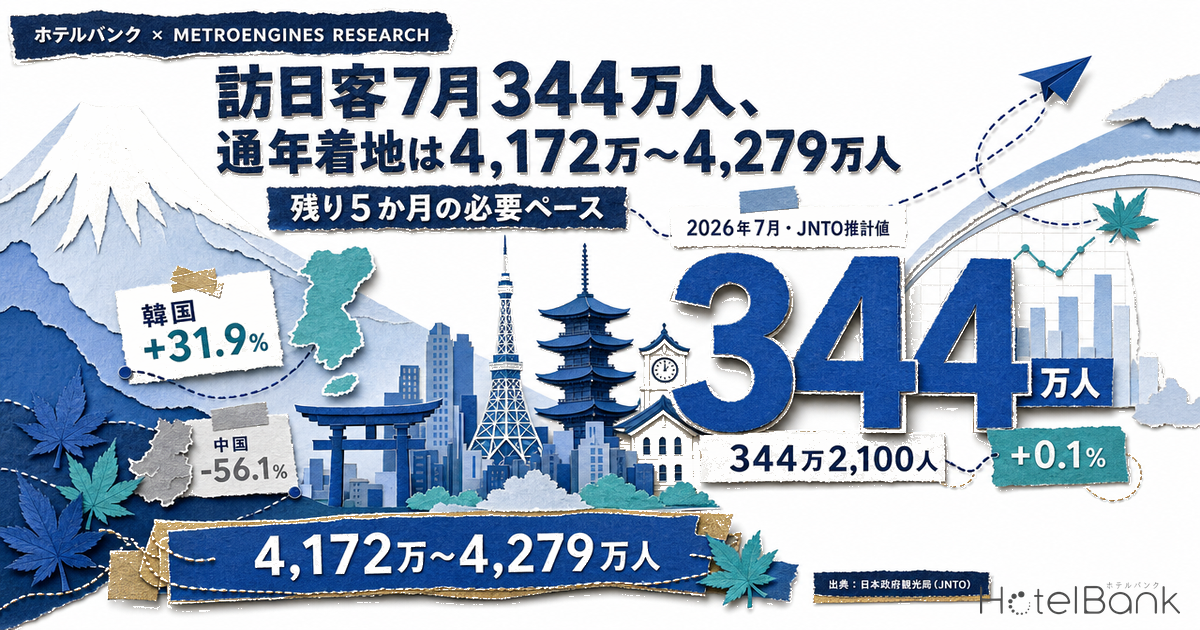
According to visitor arrival figures published by the Japan National Tourism Organization (JNTO) on 19 August 2026, Japan received 3,442,100 international visitors in July 2026, up 0.1% year on year and a record high for the month of July. It was the first monthly increase in four months. The January–July cumulative total, however, stands at 24,527,200 visitors, down 1.7% year on year and still below the prior year. This article models the monthly pace required over the remaining five months under three scenarios, breaks down the gap against guest-night trends shown in the Japan Tourism Agency’s Overnight Travel Statistics Survey across several factors, and then tests the revenue-management questions lodging operators should be asking from October onwards against the real data we are able to observe.
Metric Definitions Used in This Article
- ADR (average daily rate): An estimated settled rate (tax-exclusive equivalent) derived by applying a facility-type correction coefficient to the lowest published plan level each property lists on OTAs (double occupancy, per-room rate, tax-inclusive). Cross-checked against property-level results disclosed by listed hotel REITs (91 properties, most recent three months), the median error is approximately 7%. These are estimates and differ from each property’s actual transacted rates and accounting figures. Area-level ADR is the median across the properties covered (the level of a typical property in that area).
- OCC (occupancy rate): The share of sold rooms against total room supply within an area (an estimate based on OTA sales inventory). Because it is estimated from how OTA-listed inventory is being taken up, it differs from a property’s actual overall occupancy. By definition it runs higher than the room occupancy rate published in the Japan Tourism Agency’s Overnight Travel Statistics Survey, so the two cannot be compared as the same metric.
- LT (lead time): Days remaining until the check-in date. LT0 = same day.
- Remaining-room rate: The number of rooms still listed on OTAs at the time of observation, divided by total room supply in the target area.
- Data sources: MetroEngines Research (visitor arrivals and guest-night figures are official statistics; sources are noted on each chart and table)
- — 3,442,100 visitors — July 2026 arrivals rose 0.1% year on year, a record high for July. The flat headline is the net result of Korea +31.9% and Taiwan +26.4% offsetting China -56.1%; the market mix has been reshuffled from a year earlier.
- — 41.72–42.79 million — The full-year 2026 landing range, placing August–December at prior-year levels and ±3%. Matching the 2025 record (42,683,301) would require +2.4% year on year across August–December.
- — Reversal in December — China’s prior-year comparison base gets rapidly lighter from October onwards; simply holding the July level (428,200 per month) puts December above the prior year arithmetically.
- — -5.1 points — The gap in June 2026 between visitor arrivals (-6.8%) and foreign guest nights (-11.9%). It is the combined result of nights per visitor, dispersion of stay locations and differences in the statistical populations, and cannot be explained by any single cause.
- — 5 of 6 areas — Estimated settled ADR for October–December 2026 exceeds the prior year. The 2026 side is on a listed-snapshot basis, however, so year-on-year figures need to be read with an allowance for upward bias.
Inside July’s 3.44 Million — Korea 894k and Taiwan 764k Lift the Total, China Down 56%
Start with the primary source. JNTO’s published release (19 August 2026) puts July 2026 arrivals at 3,442,100, against 3,437,118 a year earlier, up 0.1% and a record high for the month of July. The growth rate itself is near zero, but that is the result of markets moving in sharply different directions cancelling each other out; the market mix has been reshuffled considerably from a year earlier.
By market, Korea led the month with 894,700 visitors (+31.9% year on year), while Taiwan reached 763,800 (+26.4%), clearing 700,000 in a single month for the first time. Hong Kong also grew strongly at 272,500 (+54.8%). For Taiwan, JNTO notes that increased air seat supply and cruise ship calls lifted the figure despite typhoon-related cancellations; 17 markets set July records.
China, meanwhile, remains at 428,200 (-56.1%), less than half its prior-year level. China’s share of July arrivals was 12.4%, down 16.0 points from 28.4% a year earlier. On this point alone, lodging operators should treat their demand mix as a different animal from last year.
Source: Compiled by the HotelBank Editorial Team from Japan National Tourism Organization (JNTO), “Visitor Arrivals to Japan (July 2026 estimates)” (published 19 August 2026)
Source: Compiled by the HotelBank Editorial Team from Japan National Tourism Organization (JNTO), “Visitor Arrivals to Japan (July 2026 estimates)” (published 19 August 2026)
On a January–July cumulative basis, Korea contributes 6,569,800 (+20.3% year on year), Taiwan 4,736,000 (+21.8%) and the United States 2,107,900 (+6.5%), while China sits at just 2,486,500 (-56.3%). The total is contained at -1.7% only because double-digit growth outside China is absorbing China’s decline.
| Market | Jul 2026 | YoY | Jan–Jul cumulative | YoY |
|---|---|---|---|---|
| Korea | 894,700 | +31.9% | 6,569,800 | +20.3% |
| Taiwan | 763,800 | +26.4% | 4,736,000 | +21.8% |
| China | 428,200 | -56.1% | 2,486,500 | -56.3% |
| United States | 286,200 | +3.3% | 2,107,900 | +6.5% |
| Hong Kong | 272,500 | +54.8% | 1,571,000 | +8.6% |
| Thailand | 53,800 | +10.8% | 758,300 | +4.0% |
| Australia | 49,800 | -0.7% | 643,100 | +4.2% |
| United Kingdom | 41,500 | +11.9% | 328,200 | +6.5% |
| Total | 3,442,100 | +0.1% | 24,527,200 | -1.7% |
Source: Compiled by the HotelBank Editorial Team from Japan National Tourism Organization (JNTO), “Visitor Arrivals to Japan (July 2026 estimates)” (published 19 August 2026). July 2026 figures are estimates.
The Pace Needed Over the Final Five Months — A Full-Year Landing Range of 41.72–42.79 Million
Japan received 42,683,301 international visitors in 2025 (confirmed figures), an all-time high. 2026 has reached the halfway mark with 24,527,200 over January–July. From here we ran a mechanical calculation, on a simple year-on-year basis, of where the full year lands depending on how August–December moves.
■ Calculation assumptions
- Prior-year monthly baselines: August 2025 3,428,406 / September 3,267,228 / October 3,896,524 / November 3,517,659 / December 3,617,791 (August–December total 17,727,608). All are JNTO-published confirmed 2025 figures.
- January–July cumulative: We use JNTO’s published January–July 2026 cumulative total of 24,527,200 (estimates) as is.
- How the scenarios are built: Each 2025 monthly actual is multiplied uniformly across August–December by ×1.00 (prior-year level), ×1.03 (+3%) and ×0.97 (-3%). No month-specific coefficients are applied.
- Rounding: Calculations are performed at the individual-visitor level; body text and charts display figures rounded to the nearest 10,000. Year-on-year figures are shown to one decimal place, so recalculating from displayed values may produce small rounding differences.
- Exclusions: Changes in travel policy toward specific markets, exchange rates, increases or decreases in air seat supply, natural disasters and the individual effects of major events are all excluded. This is an arithmetic sensitivity analysis that moves only the year-on-year rate, not a forecast.
- Nature of the data: July 2026 figures are estimates and may be revised when confirmed figures are released. August–December 2025 figures are confirmed.
| Month | 2025 actual | Prior-year level | +3% | -3% |
|---|---|---|---|---|
| Aug | 3,428,406 | 3,428,406 | 3,531,258 | 3,325,554 |
| Sep | 3,267,228 | 3,267,228 | 3,365,245 | 3,169,211 |
| Oct | 3,896,524 | 3,896,524 | 4,013,420 | 3,779,628 |
| Nov | 3,517,659 | 3,517,659 | 3,623,189 | 3,412,129 |
| Dec | 3,617,791 | 3,617,791 | 3,726,325 | 3,509,257 |
| Aug–Dec total | 17,727,608 | 17,727,608 | 18,259,436 | 17,195,780 |
| Full-year landing | 42,683,301 | 42,254,808 | 42,786,636 | 41,722,980 |
| vs 2025 | — | -1.0% | +0.2% | -2.2% |
Source: Compiled by the HotelBank Editorial Team from Japan National Tourism Organization (JNTO), “Visitor Arrivals to Japan (July 2026 estimates)” (published 19 August 2026)
Source: Compiled by the HotelBank Editorial Team from Japan National Tourism Organization (JNTO), “Visitor Arrivals to Japan (July 2026 estimates)” (published 19 August 2026)
The three scenarios span 41.72 million to 42.79 million, or -2.2% to +0.2% against 2025. Even delivering August–December at prior-year levels leaves the full year at -1.0%: the 428,000-visitor shortfall accumulated over January–July does not get filled. Matching the 2025 record (42,683,301) would require 18,156,101 visitors across August–December, a monthly average of 3,631,220, equivalent to +2.4% year on year. Per month that is an additional 86,000 visitors — not out of reach, but on July’s +0.1% result it implies a distinct change of gear.
Note that August–December contains October, the largest month of the year (3,896,524 in 2025). Anything left on the table there has the biggest effect on the full-year landing; put the other way, whether operators can fully capture October and the November foliage season effectively determines where in the range the year settles.
Decomposing the China Factor — The Prior-Year Base Gets Rapidly Lighter from October and Flips Positive in December
Any assessment of how achievable these scenarios are has to address the China market. The key point is that China’s decline is not about to “narrow” of its own accord: it narrows arithmetically because the prior-year comparison level itself falls.
Chinese arrivals to Japan in 2025 ran at 1,018,747 in August, 775,657 in September and 715,804 in October, before dropping sharply to 562,184 in November and 330,435 in December. This reflects the impact of Chinese authorities urging travellers to refrain from visiting Japan, which showed up from November onwards.Nikkei reportingindicates that Chinese authorities asked travel agencies to cut Japan visa applications to around 60% of prior levels.
If China were to run at the same 428,200 per month as July throughout August–December 2026, the differences against the prior-year months would be as follows.
| Month | China, 2025 actual | 2026 assumption (July level) | Difference vs prior year |
|---|---|---|---|
| Aug | 1,018,747 | 428,200 | -590,547 |
| Sep | 775,657 | 428,200 | -347,457 |
| Oct | 715,804 | 428,200 | -287,604 |
| Nov | 562,184 | 428,200 | -133,984 |
| Dec | 330,435 | 428,200 | +97,765 |
| Aug–Dec total | 3,402,827 | 2,141,000 | -1,261,827 |
Source: Compiled by the HotelBank Editorial Team from Japan National Tourism Organization (JNTO), “Visitor Arrivals to Japan (July 2026 estimates)” (published 19 August 2026). August–December 2026 are assumed values holding the July 2026 actual flat.
Source: Compiled by the HotelBank Editorial Team from Japan National Tourism Organization (JNTO), “Visitor Arrivals to Japan (July 2026 estimates)” (published 19 August 2026)
Under this assumption, the negative contribution from China narrows from -590,000 in August to -134,000 in November, and turns positive in December. In other words, the growth rate required of non-China markets to deliver the “prior-year level” scenario is +8.8% across August–December combined (15,586,608 needed against the 14,324,781 actual for non-China markets in August–December 2025). For reference, the non-China total for January–July 2026 was 22,040,700, up 14.4% against 19,262,589 in the same period a year earlier.
Extrapolating that +14.4% pace forward, however, calls for caution, for two reasons. First, arrivals from Korea and Hong Kong were depressed in July–September 2025 by rumours relating to an earthquake, so the same months in 2026 have their growth rates flattered by the rebound (Korea recorded 678,566 in July 2025, 660,917 in August and 670,563 in September). Second, Korea’s October–December 2025 figures had returned to high levels of 867,261, 824,567 and 974,239, so the comparison base gets abruptly heavier from October onwards. Extrapolating the full year from market-level growth rates alone misses this shift in the baseline.
Two-axis sensitivity: China’s monthly level × growth outside China
The three scenarios above applied a uniform coefficient to the total. In practice the full-year landing is determined by two things — the level at which China returns, and how much everything outside China grows — and these move independently. The table below therefore sets out the full-year landing for August–December across five levels of Chinese monthly arrivals and five levels of year-on-year growth outside China.
| China, monthly level \ Non-China, YoY | +0% | +3% | +6% | +9% | +12% |
|---|---|---|---|---|---|
| 428k / month | 40.99M (-4.0%) | 41.42M (-3.0%) | 41.85M (-1.9%) | 42.28M (-0.9%) | 42.71M (+0.1%) |
| 500k / month | 41.35M (-3.1%) | 41.78M (-2.1%) | 42.21M (-1.1%) | 42.64M (-0.1%) | 43.07M (+0.9%) |
| 600k / month | 41.85M (-1.9%) | 42.28M (-0.9%) | 42.71M (+0.1%) | 43.14M (+1.1%) | 43.57M (+2.1%) |
| 700k / month | 42.35M (-0.8%) | 42.78M (+0.2%) | 43.21M (+1.2%) | 43.64M (+2.2%) | 44.07M (+3.3%) |
| 800k / month | 42.85M (+0.4%) | 43.28M (+1.4%) | 43.71M (+2.4%) | 44.14M (+3.4%) | 44.57M (+4.4%) |
Source: Compiled by the HotelBank Editorial Team from Japan National Tourism Organization (JNTO), “Visitor Arrivals to Japan”. An arithmetic calculation adding, to the January–July 2026 cumulative total of 24,527,200, each growth rate applied to the non-China August–December 2025 actual of 14,324,781, plus China’s assumed monthly level × five months.
The shaded cell (China 428k per month × non-China +9%) corresponds roughly to the “prior-year level” scenario in the body text. What the table shows is that if China does not move from its July level, matching 2025 requires +12% from everything else. If China recovers to 600,000 a month, +6% outside China is enough; at 800,000 a month, 2025 is exceeded even with non-China markets flat. Given that the non-China January–July result was +14.4%, the former is within range — but as noted above, the prior-year comparison gets heavier from October, led by Korea, so that growth rate cannot simply be extended.
This table is an arithmetic sensitivity analysis that moves only the year-on-year rate; exchange rates, air seat supply and changes in travel policy are not factored in.
The Gap Between Arrivals and Lodging Statistics — No Single Cause Explains It
It is worth setting out here that visitor arrivals and lodging demand are not moving in the same direction or by the same magnitude. According to the Overnight Travel Statistics Survey published by the Japan Tourism Agency on 31 July 2026, total guest nights in June 2026 were 46.78 million (-6.5% year on year), of which foreign guest nights were 12.51 million (-11.9%), with a room occupancy rate of 56.2% overall. JNTO arrivals for the same June were 3,148,600 (-6.8%). Against -6.8% in arrivals, foreign guest nights were -11.9% — a gap of 5.1 points.
| Metric | May 2026 | Jun 2026 |
|---|---|---|
| Visitor arrivals (JNTO), YoY | -3.6% | -6.8% |
| Foreign guest nights (Japan Tourism Agency), YoY | -9.0% 2nd preliminary | -11.9% 1st preliminary |
| Gap | -5.4pt | -5.1pt |
| Implied change in nights per visitor | approx. -5.6% | approx. -5.5% |
| Foreign guest nights (actual) | 14,507,490 guest nights | 12,512,800 guest nights |
| Visitor arrivals (actual) | 3,560,256 | 3,148,600 |
| Guest nights per visitor (simple division) | 4.07 nights | 3.97 nights |
Source: Compiled by the HotelBank Editorial Team from Japan National Tourism Organization (JNTO), “Visitor Arrivals to Japan” and Japan Tourism Agency, “Overnight Travel Statistics Survey”. Nights per visitor is a simple division of the two statistics and, as discussed below, is a reference value only because the two series do not share the same population or point of recording.
This gap of around five points cannot be attributed to any single cause. It is reasonable to assume that at least the following four channels are operating at the same time.
(1) Change in nights per visitor
Dividing guest nights by arrivals month by month in 2026 gives 3.57 nights in January, 4.05 in February, 3.95 in March, 4.16 in April, 4.07 in May and 3.97 in June. A reshuffling of the market mix can affect this average. China, which is declining, is understood to involve relatively more multi-city itineraries, whereas Korea, Taiwan and Hong Kong, which are growing, are short-haul and therefore centred on short stays. Even where visitor numbers are simply swapped one for one, the structure can erode on a guest-nights basis. That said, the data in this article cannot directly observe average nights by market, so the size of this contribution cannot be pinned down.
(2) Dispersion of stay locations
Where lodging is declining is not uniform either. In the Japan Tourism Agency’s second preliminary figures for May 2026, foreign guest nights were -11.5% year on year across the three major metropolitan areas (the eight prefectures of Saitama, Chiba, Tokyo, Kanagawa, Aichi, Kyoto, Osaka and Hyogo) and -3.4% in regional areas. The decline is concentrated in the large metropolitan areas, while regional Japan is relatively resilient. By prefecture, Tokyo was -9.8%, Kyoto -15.9% and Osaka -16.8%, while many prefectures were positive, including Aomori +33.0%, Ibaraki +46.2% and Ehime +47.6%. Because regional areas have smaller properties and thinner samples, however, the Japan Tourism Agency itself asks readers to note that the standard error rate exceeds 20% for some prefectures.
(3) Differences in statistical population and estimation method
The two statistics are not counting the same thing to begin with. The following differences must be borne in mind whenever they are compared.
| Issue | Detail |
|---|---|
| Change in stratification basis | To improve statistical accuracy, the Japan Tourism Agency changed the stratification basis from “number of employees” to “number of guest rooms” from the January 2026 survey onwards. The agency itself states explicitly that “year-on-year comparisons and year-on-year differences may include the effects of this revision.” |
| Facilities covered by nationality-level aggregation | Foreign guest nights broken down by nationality (place of origin) cover only properties with 20 or more guest rooms. June 2026 came to 11,199,280 guest nights, or 89.5% of the all-facility foreign guest-night figure of 12,512,800. In any market-level discussion, the remaining roughly 10% sits outside the field of view. |
| Reference date of the population | The June 2026 aggregation is estimated using facilities as of 1 January 2026 as the population. |
| Preliminary status | June 2026 is a first preliminary figure and may change with the second preliminary figures scheduled for publication on 31 August 2026. May figures are second preliminary. |
| Definitional difference between arrivals and guest nights | Visitor arrivals are an estimate based on the Ministry of Justice’s immigration statistics — a head count of foreign travellers on an entry basis. Lodging statistics are nights recorded by properties; neither the coverage nor the point of recording matches. |
Source: Compiled by the HotelBank Editorial Team from Japan Tourism Agency, “Overnight Travel Statistics Survey” (May 2026 second preliminary, June 2026 first preliminary)
(4) Japanese-resident demand and month-boundary effects
June’s overall -6.5% is not a foreign-visitor phenomenon alone. Japanese guest nights also fell, to 34.26 million (-4.4% year on year). In addition, stays by travellers entering at the end of a month are partly recorded in the following month, and single-month year-on-year figures are also affected by differences in the day-of-week calendar. Reading a single month’s gap directly as “a change in the quality of inbound demand” is premature.
June room occupancy by facility type was 70.9% for business hotels, 69.1% for city hotels, 50.4% for resort hotels, 35.3% for ryokan and 23.0% for simple accommodation. The overall figure of 56.2% is the average of a distribution spread over more than 30 points between facility types. In placing your own property, the facility-type level is the more useful benchmark than the overall figure.we have covered inbound share by facility type in detail in a separate article。
The Demand Outlook from October — What Our Own Data Can and Cannot Show
From here we look at autumn onwards using data within our own observation range. On current supply and demand, estimated OCC (OTA sales inventory basis) for July 2026 was 93.1% in Tokyo (1,354 properties, 182,896 rooms), 92.3% in Hokkaido (1,293 properties, 92,099 rooms), 91.1% in Fukuoka, 91.0% in Okinawa (1,083 properties, 51,693 rooms), 86.5% in Osaka (698 properties, 110,295 rooms) and 83.8% in Kyoto (943 properties, 52,693 rooms). Even with arrivals below the prior year, inventory take-up itself in the main areas is running at high levels. Note that this estimated OCC is a different metric from the room occupancy rate in the Japan Tourism Agency’s Overnight Travel Statistics Survey cited above (56.2% overall for June 2026). The former is a six-area value estimated from how OTA-listed inventory is being taken up; the latter is actual performance reported by properties nationwide. Neither the coverage nor the calculation method matches, so the difference in level should not be read as a divergence in supply and demand.
Next, estimated settled ADR for October–December. Placing the levels estimated from prices listed on OTAs at the time of survey alongside the prior-year actuals gives the following.
| Area | Oct 2025→2026 | YoY | Nov 2025→2026 | YoY | Dec 2025→2026 | YoY |
|---|---|---|---|---|---|---|
| Tokyo | ¥15,625→¥18,606 | +19.1% | ¥17,088→¥18,844 | +10.3% | ¥15,814→¥17,798 | +12.5% |
| Kyoto | ¥19,243→¥20,994 | +9.1% | ¥24,800→¥25,848 | +4.2% | ¥17,918→¥17,659 | -1.4% |
| Osaka | ¥13,392→¥11,508 | -14.1% | ¥11,982→¥11,759 | -1.9% | ¥11,120→¥11,296 | +1.6% |
| Hokkaido | ¥9,708→¥12,574 | +29.5% | ¥9,123→¥11,517 | +26.2% | ¥9,421→¥12,782 | +35.7% |
| Okinawa | ¥10,852→¥12,549 | +15.6% | ¥10,550→¥11,706 | +11.0% | ¥10,890→¥12,009 | +10.3% |
| Fukuoka | ¥11,229→¥14,515 | +29.3% | ¥13,305→¥14,883 | +11.9% | ¥12,824→¥14,153 | +10.4% |
Source: Compiled from MetroEngines Research by the HotelBank Editorial Team. Property counts are, for October, Tokyo 1,066 / Kyoto 560 / Osaka 620 / Hokkaido 856 / Okinawa 499 / Fukuoka 452; for November, Tokyo 1,029 / Kyoto 530 / Osaka 609 / Hokkaido 797 / Okinawa 491 / Fukuoka 442; and for December, Tokyo 983 / Kyoto 495 / Osaka 580 / Hokkaido 736 / Okinawa 474 / Fukuoka 419. October–December 2026 are estimates based on listed levels at the time of survey.
How to read the year-on-year figures: The 2025 values in the table above are levels estimated from confirmed price history, whereas the October–December 2026 values are levels estimated from a snapshot of prices listed on OTAs at the time of survey; the two rest on different calculation bases. Our internal validation finds that the listed-snapshot basis tends to run just under 10% higher than the confirmed-history basis. The year-on-year figures in the table should therefore be read as an indication skewed to the upside rather than a measured rate of price change. Given also that prices may converge downward as check-in approaches, readers should weight the relative strength between areas (Hokkaido and Fukuoka strong, Osaka weak in October) rather than the absolute year-on-year levels.
Source: Compiled from MetroEngines Research by the HotelBank Editorial Team (October–December 2026 are estimates based on listed levels at the time of survey)
Even with arrivals running below the prior year, listed levels for October–December are above last year in most areas. Hokkaido is up 29.5% in October and 35.7% in December, and Fukuoka up 29.3% in October — the largest gains. Osaka’s October figure of -14.1% is the one substantial negative, but this owes more to the nature of the comparison base than to weak demand. October 2025 was the final month ofExpo 2025 Osaka, Kansai, which closed on 13 October 2025, and levels that month were elevated. The return to roughly prior-year levels at -1.9% in November and +1.6% in December is consistent with that difference in baseline.
Booking pace is also worth examining. The chart below tracks the remaining-room rate for a check-in date of Saturday 10 October 2026, from 90 days out to 52 days out (at the time of writing).
Source: Compiled from MetroEngines Research by the HotelBank Editorial Team. Check-in Saturday 10 October 2026. Coverage: Tokyo 1,346 properties / 182,348 rooms; Osaka 719 properties / 111,155 rooms; Kyoto 1,035 properties / 53,564 rooms; Hokkaido 1,347 properties / 93,352 rooms; Okinawa 1,162 properties / 52,936 rooms; Fukuoka 619 properties / 54,266 rooms
| Area | Rooms covered | LT90 remaining-room rate | LT52 remaining-room rate | Take-up over 38 days | Rooms remaining at LT52 |
|---|---|---|---|---|---|
| Tokyo | 182,348 rooms | 29.3% | 21.7% | 7.6pt | 39,533 rooms |
| Osaka | 111,155 rooms | 33.2% | 27.6% | 5.6pt | 30,733 rooms |
| Kyoto | 53,564 rooms | 19.7% | 12.6% | 7.1pt | 6,733 rooms |
| Hokkaido | 93,352 rooms | 24.4% | 19.3% | 5.1pt | 18,059 rooms |
| Okinawa | 52,936 rooms | 26.1% | 19.0% | 7.1pt | 10,075 rooms |
| Fukuoka | 54,266 rooms | 26.2% | 20.4% | 5.8pt | 11,065 rooms |
Source: Compiled from MetroEngines Research by the HotelBank Editorial Team. Check-in Saturday 10 October 2026; coverage is Tokyo 1,346 properties / Osaka 719 / Kyoto 1,035 / Hokkaido 1,347 / Okinawa 1,162 / Fukuoka 619
Kyoto has the lowest remaining-room rate at LT52 at 12.6%, a clear sign that advance booking ahead of the foliage season is working. Osaka, conversely, is the highest at 27.6%. With more than 50 days still to run until check-in, however, a remaining-room rate at this point should not be taken as evidence that rooms “are not selling”. At the time of writing, 10 October is 51 days away, which is not a stage at which any definitive sell-out judgement can be made. What can be read here is simply the current state of progress and the relative difference in pace between areas. Note also that 10 October falls where Taiwan’s Double Ten holiday overlaps with Japan’s Sports Day, and we examine how demand is building over that four-day weekend inDouble Ten x Sports Day: Japan’s Oct 9-12 Capacity at 76 Days Out. In addition, this remaining-room rate reflects take-up of inventory listed on OTAs; it does not capture direct bookings, allocations through travel agencies, or operations that release inventory to OTAs in stages.
The Revenue Questions — How to Handle a Skewed Market Mix
From the data above, we set out four questions worth holding onto from October. What the data supports and what it does not are kept separate.
Question 1: China dependence can only be measured in your own numbers
As one way of approximating market mix at the area level, we aggregated the language composition of guest reviews. The table below draws on an NLP tag analysis platform covering roughly 3.45 million reviews over the most recent 24 months, extracting the language composition of non-Japanese reviews by prefecture.
| Area | Non-Japanese reviews | English | Traditional Chinese | Korean | Simplified Chinese |
|---|---|---|---|---|---|
| Tokyo | 445,110 reviews | 80.3% | 8.7% | 7.7% | 2.3% |
| Osaka | 201,756 reviews | 66.7% | 11.8% | 16.7% | 3.5% |
| Kyoto | 190,377 reviews | 83.6% | 7.2% | 5.7% | 2.9% |
| Hokkaido | 103,552 reviews | 50.1% | 19.4% | 23.7% | 4.4% |
| Okinawa | 68,447 reviews | 36.2% | 35.8% | 22.8% | 4.8% |
| Fukuoka | 86,844 reviews | 31.0% | 21.0% | 43.0% | 3.7% |
Source: HotelBank Editorial Team research (NLP analysis of guest reviews, most recent 24 months, covering six languages — Japanese, English, Traditional Chinese, Simplified Chinese, Korean and Thai). Shares are against the non-Japanese total.
Source: HotelBank Editorial Team research (NLP analysis of guest reviews, most recent 24 months)
Korean accounts for 43.0% in Fukuoka; in Okinawa, Traditional Chinese at 35.8% and Korean at 22.8% together make up close to 60%; and in Tokyo and Kyoto English sits at around 80%. The regional differences are pronounced.We have shown in a separate article that the evaluation criteria themselves differ by language, and a skewed market mix feeds directly into how initiatives should be designed.
This table is not, however, the market mix itself. The decisive evidence is the Simplified Chinese share, which stays within 2.3–4.8% across all six areas. China accounted for 12.4% of July arrivals, so it is clear that lodging composition does not match review composition. Propensity to post reviews varies widely by language sphere, and the language written in does not match nationality either. In short,your own China dependence cannot be measured from reviews or area averages. There is no method other than checking the country and region mix in your own booking data, and how it has moved over the past three months. This is a part of the picture that leaves no room for conjecture.
Question 2: Decide in advance how you will receive China if it returns
On Chinese group travel, there have been reports that some state-linked travel agencies resumed recruiting from June 2026. As noted above, the prior-year base falls sharply into November and December, so even a gradual recovery will make year-on-year statistics look like an improvement. The point to watch is that this improvement does not necessarily translate into revenue at your own property. When the China market returns, what moves first is the routes where air seat supply has recovered and the lodging demand around them. Whether your property sits within that catchment changes the meaning entirely.we have covered the relationship between the winter schedule’s international route catchments and room supply in a separate article。
Deciding how you will receive that demand means, concretely, drawing the line in advance on how far down the rate ladder you will accept Chinese demand. In a recovery phase, group and tour enquiries tend to come first, and in-the-moment decisions frequently push rates downward. Given that estimated settled ADR is running above the prior year in most areas, managing a controlled allocation with a defined rate floor does more for full-year RevPAR than accepting returning demand unconditionally and breaking an existing mix.
Question 3: Lead-time differences by market cannot be observed in our data
It is often said in practice that lead times differ between Taiwan and Korea on one hand and Western markets and Australia on the other. OTA published price and inventory data, however, cannot identify which market a booking came from. Claims such as “Taiwan is centred on LT within 30 days, Western markets book from 90 days out” therefore cannot be substantiated with the data in this article. We treat this point as conjecture.
What can be observed is booking pace at the area level. In the 10 October curve above, Kyoto took up 7.1 points and Tokyo 7.6 points between LT90 and LT52, while Hokkaido managed only 5.1 points and Osaka 5.6 points. Because these are the same date and the same observation window, they can be read as relative differences in pace between areas. A realistic starting point is to overlay your own booking curve on the area level and establish whether you sit on the fast side or the slow side.
Question 4: October is the largest month of the year; November’s foliage season has the most headroom on rate
The largest month by arrivals in 2025 was October, at 3,896,524. Whether ADR peaks in October or November varies by prefecture, however, and we set out that classification inJapan Autumn ADR 2026: 20 Prefectures Peak in Nov, Kyoto +81.8%. Both in terms of contribution to the full-year landing and in terms of single-month demand volume, October is the most important month. Kyoto’s November estimated settled ADR of approximately ¥25,800 is the highest of any area in any month (against approximately ¥24,800 a year earlier, +4.2%), with the concentration of demand showing up in price.only 6 of 47 prefectures see their foreign-visitor share rise in autumn, which means the areas that can expect an autumn upswing are limited. Whether your property is among them changes the tactics to take in October and November.
On Korea’s Chuseok (24–27 September in 2026) running into Japan’s Silver Week,we examined in a separate article how Kyushu and Kansai take the wave. From late September into October there is a run of periods where Japanese public holidays overlap with those of neighbouring markets. Inventory and pricing designed with that overlap in mind will shape where in the three August–December scenarios the year lands.
⚠ Note on forward-dated ADR and inventory data:The estimated settled ADR for August–December 2026 and the remaining-room rates for check-in on 10 October 2026 presented in this article are all estimates based on information published on OTAs at the time of survey, and will move as the check-in date approaches. Please note that prices set high at present may fall through last-minute adjustment, and equally that additional inventory may be released. The full-year arrival estimates are likewise an arithmetic sensitivity analysis moving only the year-on-year rate, and are not a forecast.
Summary
July 2026 arrivals of 3,442,100 (+0.1% year on year) were a record high for the month of July, yet the flat headline was the net result of China at -56.1% being offset by Korea +31.9% and Taiwan +26.4%. The January–July cumulative total is 24,527,200 (-1.7% year on year), and placing August–December at prior-year levels and ±3% gives a full-year landing of 41.72 million to 42.79 million, a range of -2.2% to +0.2% against 2025. Matching the 2025 record would require +2.4% year on year across August–December, which demands a step up from the pace seen as of July.
The divergence between arrivals and guest nights (June: -6.8% against -11.9%) arises from a combination of the change in nights per visitor, the differing rates of decline between metropolitan and regional areas, and statistical differences such as the change in stratification basis and the restriction of nationality-level aggregation to properties with 20 or more rooms. Fixing on any one of these as the cause will lead to a misreading of demand at your own property.
Within our observation range, estimated settled ADR for October–December 2026 exceeds the prior year in five of six areas, with the largest gains in Hokkaido at +29.5% (October) and Fukuoka at +29.3% (same month). Osaka’s -14.1% in October reflects the special prior-year factor of the Expo’s final month. Remaining-room rates for 10 October show a clear difference between areas at 12.6% in Kyoto and 27.6% in Osaka, but with more than 50 days to check-in these are figures to be read as current progress. Lead-time differences by market cannot be identified in our data, so we would encourage operators to check this in their own booking data.
Frequently Asked Questions
Where will Japan’s 2026 visitor arrivals land for the full year?
Placing August–December against the 2025 monthly actuals at prior-year level, +3% and -3% gives a range of 41.72 million to 42.79 million (-2.2% to +0.2% against 2025). Matching the 2025 record of 42,683,301 would require +2.4% year on year across August–December, a monthly average of 3,631,220. This is an arithmetic sensitivity analysis moving only the year-on-year rate, not a forecast.
Will the decline in the China market continue at the same magnitude?
The decline narrows on a year-on-year basis, because the prior-year comparison level itself falls: China dropped from 1,018,747 in August 2025 to 330,435 in December. If August–December 2026 runs at the same 428,200 per month as July, the year-on-year difference narrows from -590,547 in August to -133,984 in November, and turns positive at +97,765 in December.
Why are foreign guest nights down 11.9% when arrivals are down only 6.8%?
No single cause explains it. The change in nights per visitor, the dispersion of stay locations (in May 2026, -11.5% in the three major metropolitan areas against -3.4% in regional areas), differences in statistical population and estimation method (the stratification basis changed from number of employees to number of guest rooms from the January 2026 survey, and nationality-level aggregation covers only properties with 20 or more rooms), and Japanese-resident demand together with month-boundary effects — it is reasonable to assume these four channels are operating simultaneously.
Which is correct: the article’s estimated OCC of 93.1% (July 2026, Tokyo) or the Japan Tourism Agency’s room occupancy rate of 56.2% (June 2026, nationwide)?
Both are correct; they are different metrics. Estimated OCC is a six-area value estimated from how OTA-listed inventory is being taken up, and by definition runs higher than a property’s actual occupancy. The Japan Tourism Agency’s room occupancy rate is actual performance reported by properties nationwide (June 2026, overall). Neither the coverage nor the calculation method matches, so the difference in level cannot be read as a divergence in supply and demand.
Can the figures showing October–December 2026 ADR above the prior year be taken at face value?
They need to be read with an allowance for upward bias. The 2025 values are levels estimated from confirmed price history, whereas October–December 2026 values are estimated from a snapshot of prices listed on OTAs at the time of survey; the calculation bases differ. Because the listed-snapshot basis tends to run just under 10% higher than the confirmed-history basis, the year-on-year figures should be treated as an indication rather than a measured rate of change.
Can this article’s data show differences in lead time by market?
No. OTA published price and inventory data cannot identify which market a booking came from. What can be observed is booking pace at the area level: for check-in on Saturday 10 October 2026, take-up between LT90 and LT52 was 7.6 points in Tokyo, 7.1 points in Kyoto, 7.1 points in Okinawa, 5.6 points in Osaka and 5.1 points in Hokkaido.
Related Reading
- City Hotels: 45.9% of Guest Nights Are Foreign — Ryokan +3.7%
- Chuseok Sep 24-27: Only Fukuoka, Saga, Kyoto Hold After Silver Week
- What Guests Write About in 8 Languages — 3.46M Review Tag Analysis
- Lodging Is 37% of Japan’s ¥2.51T Inbound Spend: ¥10,446 vs Real ADR
- Winter Schedule Oct 25: Do 20 Regional Airports Have Enough Rooms?
- Double Ten x Sports Day: Japan’s Oct 9-12 Capacity at 76 Days Out
- Japan Autumn ADR 2026: 20 Prefectures Peak in Nov, Kyoto +81.8%
References and Sources
■ Data sources
Visitor arrivals are figures published by the Japan National Tourism Organization (JNTO) (July 2026 estimates; 2025 confirmed). Guest nights and room occupancy rates are from the Japan Tourism Agency’s Overnight Travel Statistics Survey (May 2026 second preliminary, June 2026 first preliminary). Estimated settled ADR, estimated OCC and remaining-room rates are MetroEngines Research aggregations (by prefecture, monthly, double occupancy, per room). Review language composition is NLP analysis by the HotelBank Editorial Team (most recent 24 months). Property counts are stated on each chart and table.
■ Limitations and caveats
(1) The full-year landing estimates are an arithmetic sensitivity analysis moving only the year-on-year rate, not a forecast. Exchange rates, air seat supply, changes in travel policy, disasters and the individual effects of major events are not factored in. (2) Estimated settled ADR for October–December 2026 is on a listed-snapshot basis while the 2025 values are on a confirmed-history basis, so year-on-year figures need to be read as an indication skewed to the upside. (3) Estimated OCC is on an OTA-listed inventory basis and by definition runs higher than the room occupancy rate published by the Japan Tourism Agency. The two cannot be compared. (4) Visitor arrivals (a head count on an entry basis) and guest nights (nights recorded by properties) do not share the same population or point of recording. (5) OTA published data cannot identify which market a booking came from, so lead-time differences by market are not examined in this article.
■ Government and official statistics
- Japan National Tourism Organization (JNTO), “Visitor Arrivals to Japan (July 2026 estimates)” (published 19 August 2026)
- JNTO, “Visitor Arrivals to Japan (total): annual, monthly and market-level statistical tables” (2003–2026)
- Japan Tourism Agency, “Overnight Travel Statistics Survey (May 2026 second preliminary, June 2026 first preliminary)” (published 31 July 2026)
- Japan Tourism Agency, “Overnight Travel Statistics Survey” aggregated results (monthly)
■ Media and official announcements
- Travel Voice, “Foreign visitors to Japan: July 2026 a record 3.44 million for the month, Taiwan tops 700,000 for the first time” (19 August 2026)
- Nikkei, “Chinese authorities instruct travel agencies to cut Japan-bound visitors to 60%, through March 2026”
- Nippon TV NEWS NNN, “Chinese group travel to Japan: signs of resumption” (reported 19 June 2026)* Article URL no longer available
- EXPO 2025 Osaka, Kansai official website, “Expo 2025 Osaka, Kansai in data” (period: 13 April – 13 October 2025)
■ Our own data
- MetroEngines Research — estimated settled ADR (by prefecture, monthly), estimated OCC (OTA sales inventory basis), booking curves (remaining-room rate)
- HotelBank Editorial Team research — NLP analysis of guest reviews (most recent 24 months, aggregated by language)