

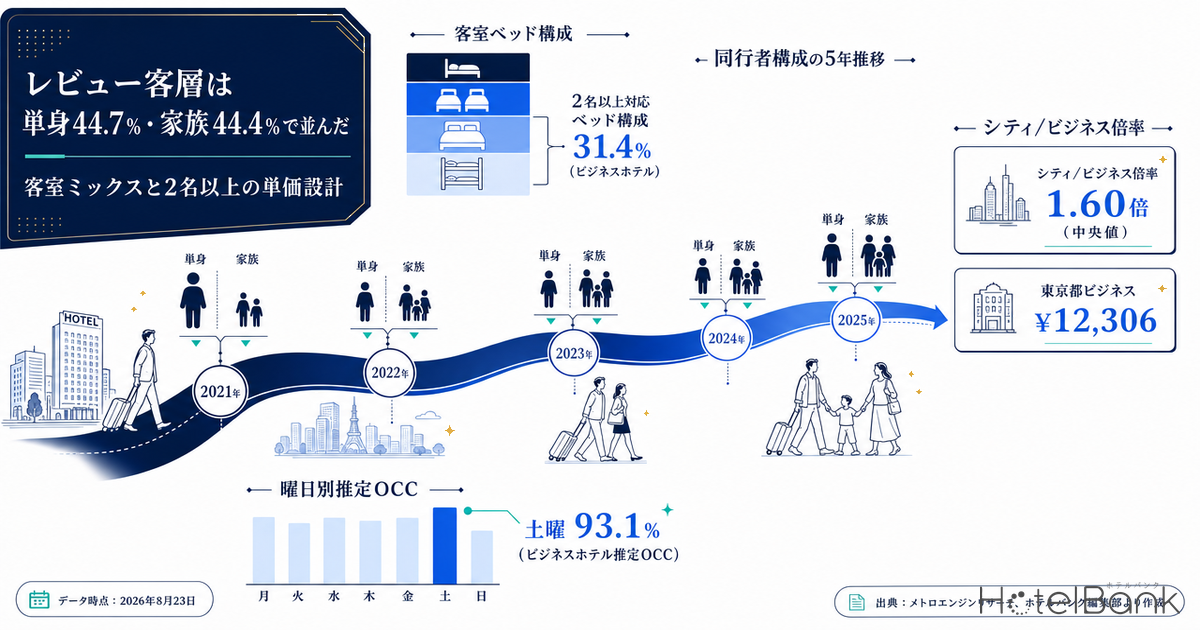
In guest-profile data compiled from publicly posted OTA reviews nationwide, the 2025 party composition came in at 44.7% solo and 44.4% family (n=407,873), narrowing the gap between the two to just 0.3pt. In 2021 the split was 46.5% solo against 38.6% family, a 7.9pt gap in which solo travellers were clearly the lead segment. On the supply side, however, the bed configuration of rooms held by business hotels nationwide remains majority single at 54.3% (N=5,773 properties, 668,177 rooms), with beds able to accommodate two or more guests accounting for only 31.4%. A gap that revenue management has to close still sits between the demand-side composition and the supply-side room mix. This article lines up five years of party, purpose and country-of-origin composition, day-of-week OCC by hotel category, and the estimated settled ADR across seven major areas, then translates them into room-type allocation and pricing for two or more guests.
Scope: nationwide aggregation of publicly posted OTA reviews (party and purpose, n=407,873-407,874, 2025); room composition of N=5,773 business hotels and N=1,076 city hotels nationwide; business and city hotels in seven major prefectures (estimated settled ADR, N=30-913 properties). Price figures in this article are the estimated settled ADR (the transaction price level estimated from OTA and other sales data, tax-excluded equivalent); occupancy is an estimate based on OTA-listed inventory. Definitions for both appear at the end of the article. Data as of August 23, 2026.
- — Solo 44.7%, family 44.4% (2025, n=407,873). The 7.9pt gap seen in 2021 has narrowed to 0.3pt, and the lead segment among reviewers has shifted from solo to parity.
- — That said, roughly 41% of solo stays are for business (20.5% x 89.8% = about 18.4pt). The remaining 26.3pt or so are leisure-driven solo stays, so this is not an argument for cutting single inventory across the board.
- — On the supply side, singles account for 54.3% of business hotel rooms (N=5,773 properties, 668,177 rooms), with beds for two or more at 31.4%. That contrasts with 54.6% at city hotels, leaving a gap against the demand mix.
- — Day-of-week estimated OCC (stay dates in June-July 2026) puts business hotels at 93.1% on Saturday and 84.9% on Monday, a maximum spread of 8.7pt. Saturday sits just 1.3pt below city hotels at 94.4%, meaning weekend inventory is already being absorbed as leisure stock.
- — The market’s city-to-business ratio runs 1.49x to 1.82x (median 1.60x) (July 2026 settled, seven areas). It offers a yardstick for reviewing the gap between your own single-guest and double-occupancy rates.
From 7.9pt to 0.3pt: five years of national review guest mix
First, a word on what the data is. The guest-profile data used here aggregates the attributes of people who posted accommodation reviews publicly on OTAs and similar platforms; it is not a survey covering all travellers. Because the population that writes reviews is skewed, the practical way to read it is to follow the year-on-year movement in composition rather than the absolute levels.
On that basis, the five-year trend in party composition is consistent. Solo fell 1.8pt from 46.5% in 2021 (n=488,360) to 44.7% in 2025 (n=407,873), while family rose 5.8pt from 38.6% to 44.4%. The gap went from 7.9pt to 0.3pt. The two drew almost level once in 2023 (solo 43.8%, family 43.6%), swung back in 2024 (solo 45.6%, family 42.5%), then converged again in 2025. This is not single-year noise but a five-year direction of travel in which the family share keeps stepping up. How to translate this shift in party mix into rate and inventory design is also covered in Solo vs Family Stays Just 0.3pt Apart.
Equally hard to overlook is the shrinking couple segment. It fell 2.9pt from 6.8% in 2021 to 3.9% in 2025, and combined with friends (4.9% to 4.5%), the make-up of so-called two-person stays has shifted from couples to families. It is closer to reality to read this as a change in composition rather than a decline in the total volume of two-person stays. Since family parties include three or more people, the distribution of guests per booking may well have lengthened at the upper end.
Source: Compiled by the HotelBank Editorial Team from MetroEngines Research data
Four in ten solo stays are for business: what the purpose mix says about the rest
The purpose mix for 2025 was 74.7% leisure, 20.5% business and 4.8% other (n=407,874). In 2021 it was 69.7% leisure and 22.5% business, so leisure has thickened by 5.0pt. Business purposes fell to 19.7% in 2023, then ran at 22.0% in 2024 and 20.5% in 2025, hovering around 20%.
Isolating business-purpose stays, the party composition is 89.8% solo and 7.7% colleagues (2025, n=83,714), barely moving over five years (2021: 87.8% solo, 8.4% colleagues). Business travel is structurally single-room demand. Working backwards, “business-purpose solo” accounts for 20.5% x 89.8% = about 18.4pt of the whole. Of the 44.7pt total solo share, roughly 41% is business, leaving about 26.3pt of solo stays driven by leisure and other purposes.
That breakdown matters for revenue management. The demand supporting single inventory is not only weekday business travel; leisure-driven solo stays exist at a comparable or larger scale. In other words, even if you shift the room mix in line with the rising family share, this is not an argument for cutting single inventory across the board. What should move is how you use it by day of week and by season.
For reference, the age composition of reviewers is worth adding. Among leisure-purpose stays, the share aged 60 and over rose from 23.5% in 2021 to 33.7% in 2025 (n=124,011); for business purposes it rose from 19.7% in 2021 to 28.9% in 2025 (n=31,355). Because this metric is strongly affected by the age skew of people who write reviews, it should be treated as a change in reviewer composition rather than as the actual age of guests.
Overseas reviewers at 38.4% in 2025: treat it as separate from demand volume
By country and region, posts from overseas accounted for 15.5% in 2021 (n=3,751,759), 14.9% in 2022, 41.4% in 2023, 44.7% in 2024 (n=4,896,647) and 38.4% in 2025 (n=4,256,486), a fall of 6.3pt from 2024 to 2025.
Reading that as “inbound demand has shrunk” would be wrong. According to the Japan National Tourism Organization (JNTO), foreign visitor arrivals in 2025 reached 42,683,600, an annual record. The decline in share can be explained by factors on the denominator side, such as an increase in domestic posts and differences in posting behaviour, and cannot be used as an indicator of demand volume. As with party and purpose composition, it should be treated strictly as a signal of whose reviews are accumulating. Note that 2026 is still mid-aggregation and has not been used for year-on-year comparison.
Day-of-week estimated OCC takes a different shape by category: how much room the weekend leaves
Where the change in guest mix bites shows up in the shape of occupancy by day of week. For stay dates in June and July 2026 across seven major prefectures (Tokyo, Kanagawa, Aichi, Kyoto, Osaka, Fukuoka and Hokkaido), estimated OCC based on OTA-listed inventory was aggregated by day of week (daily aggregate property counts: business approx. 2,786, city approx. 427, resort approx. 227).
| Category | Mon | Tue | Wed | Thu | Fri | Sat | Sun | Max spread |
|---|---|---|---|---|---|---|---|---|
| Business hotels | 84.9% | 88.5% | 90.2% | 91.6% | 90.2% | 93.1% | 84.4% | 8.7pt |
| City hotels | 86.9% | 88.9% | 90.1% | 91.1% | 91.6% | 94.4% | 87.9% | 7.5pt |
| Resort hotels | 77.9% | 81.6% | 81.7% | 82.3% | 85.5% | 90.4% | 84.5% | 12.5pt |
Source: Compiled by the HotelBank Editorial Team from MetroEngines Research data
Business hotels trough at 84.9% on Monday and 84.4% on Sunday and peak at 93.1% on Saturday, a maximum spread of 8.7pt across the week. Mid-week is strong (Thursday 91.6%) while both ends of the week open up, the classic business-travel shape. City hotels have a shallower trough at 86.9% on Monday and a thicker weekend, with Friday at 91.6% and Saturday at 94.4%. Resort hotels span 12.5pt from 77.9% on Monday to 90.4% on Saturday, the strongest weekend concentration of the three. This day-of-week shape does vary by area, however: as seen in Hokkaido Business Hotels Aren’t Weekend-Led, some markets are thick from Tuesday to Thursday and trough on Sunday and Monday. Check the shape of your own area first.
What deserves attention is business hotels at 93.1% on Saturday. That is only 1.3pt below city hotels at 94.4%, which shows that business hotels at the weekend are already being absorbed as leisure inventory. This is where room mix starts to bite. If families are the working assumption for Saturday, a single-heavy configuration tends to leave inventory that is not sold out yet does not sell.
Source: Compiled by the HotelBank Editorial Team from MetroEngines Research data
Bed configuration is still 54.3% single: the gap against the demand mix
Turning to supply. Across N=5,773 operating business hotels and 668,177 rooms nationwide, the bed configuration is 54.3% single, 15.9% twin, 15.3% double, 14.2% other and 0.2% suite. Beds able to accommodate two or more guests (twin, double, triple and suite) come to just 31.4%. City hotels, at N=1,076 properties and 188,088 rooms, are the mirror image: 39.5% twin, 31.8% single, 13.8% double, 13.6% other and 1.4% suite, with 54.6% able to take two or more.
The 44.4% family share among reviewers and the 31.4% double-capable share of business hotel rooms cannot simply be placed side by side. A review does not necessarily correspond to one booking, and the review data carries no breakdown by hotel category. Even so, the difference in direction is clear. While the family share on the demand side has risen 5.8pt in five years, room composition is constrained by the shape of the building and only moves on a multi-year cycle. What revenue management can move in the short term is how the same room is sold, and to how many guests, not the number of rooms themselves.
Source: Compiled by the HotelBank Editorial Team from MetroEngines Research data
What matters in practice here is how non-single inventory (twin and double) is deployed. Business hotels hold roughly equal amounts of each, twin at 15.9% and double at 15.3%, and their role changes: upgrade inventory for solo guests on weekdays, core inventory for two or more guests at the weekend. Running the same rate calendar across both roles tends to leave money on the table at the weekend and to discount too far on weekdays.
Where to set the rate for two or more guests: estimated settled ADR across seven major areas
As a yardstick for pricing, the estimated settled ADR for business and city hotels across seven major prefectures is lined up on a settled-month against settled-month basis (July 2026 versus July 2025). Both years are settled figures, so the year-on-year comparison is made on the same basis.
| Area | Business Jul 2026 | YoY | City Jul 2026 | YoY | City / Business |
|---|---|---|---|---|---|
| Tokyo | ¥12,306 N=913 | -5.3% | ¥22,434 N=107 | -17.1% | 1.82x |
| Kanagawa | ¥9,128 N=210 | -0.9% | ¥15,002 N=42 | +3.9% | 1.64x |
| Aichi | ¥7,491 N=323 | -1.2% | ¥11,466 N=30 | -1.9% | 1.53x |
| Kyoto | ¥10,230 N=325 | -13.0% | ¥17,420 N=58 | -16.8% | 1.70x |
| Osaka | ¥8,429 N=497 | -31.9% | ¥12,582 N=97 | -25.1% | 1.49x |
| Fukuoka | ¥10,382 N=340 | +3.6% | ¥16,608 N=40 | +3.1% | 1.60x |
| Hokkaido | ¥11,154 N=432 | +4.1% | ¥17,819 N=75 | -5.7% | 1.60x |
Source: Compiled by the HotelBank Editorial Team from MetroEngines Research data
Of the seven areas, business hotel ADR is up year on year only in Fukuoka (+3.6%) and Hokkaido (+4.1%). The steepest declines are Osaka (-31.9%) and Kyoto (-13.0%), and Osaka has to be read against the high base of July 2025, which fell inside the run of Expo 2025 Osaka, Kansai (April 13 to October 13, 2025). How that rebound deepened month by month is broken down in Osaka Settled ADR June 2026: City -26.3%, Business -32.8% Post-Expo. In Tokyo, business hotels sit around ¥12,300 and city hotels around ¥22,400.
More useful for pricing is the city-to-business ratio in the right-hand column. Across the seven areas it falls within a range of 1.49x (Osaka) to 1.82x (Tokyo), with a median of 1.60x. Read another way, between a category with 31.4% of rooms able to take two or more guests and one with 54.6%, the market shows an ADR difference of roughly 1.5x to 1.8x. This difference of course also reflects factors other than room composition, including location, on-site facilities and whether meals are included, so it cannot be taken as the “correct multiplier for a twin”. It does, however, work as a yardstick: when the gap between your own single-guest and double-occupancy rates sits well outside this range, can you explain why?
Breaking the ratio range into three positions
The 1.49x to 1.82x range above is the market’s observed spread, not the correct multiplier for any one property. Still, laying out the lower bound, the median and the upper bound as three positions – conservative, mid and aggressive – makes it easier to see where your current figure stands. Everything below is arithmetic using only the observed ratios for the seven areas shown in this article; no new assumptions have been added.
| Scenario | Ratio | Source within the range | Rate for two or more (single = 100) | Difference vs mid |
|---|---|---|---|---|
| Conservative (lower bound) | 1.49x | Osaka (lowest of the seven areas) | 149 | −11 |
| Mid | 1.60x | Median of the seven areas | 160 | — |
| Aggressive (upper bound) | 1.82x | Tokyo (highest of the seven areas) | 182 | +22 |
Source: Compiled by the HotelBank Editorial Team from MetroEngines Research data
Choosing where to put the ratio does not by itself determine how the rate per room moves. The effect is proportional to what share of that room type actually sells to two or more guests. The table below puts the double-occupancy share on the horizontal axis and the rate multiplier on the vertical, showing as an index how many times the single-guest rate the average rate per room becomes. The horizontal axis is a parameter you have to measure at your own property; this article does not estimate its level. The intended use is to break out your own twin and double rooms by day of week into single versus double-occupancy sales, then read the relevant cell.
| Rate multiplier / double-occupancy share | 20% | 30% | 40% | 50% | 60% |
|---|---|---|---|---|---|
| 1.49x (lowest of seven areas, Osaka) | 109.8 | 114.7 | 119.6 | 124.5 | 129.4 |
| 1.60x (median of seven areas) | 112.0 | 118.0 | 124.0 | 130.0 | 136.0 |
| 1.70x (midpoint of median and maximum) | 114.0 | 121.0 | 128.0 | 135.0 | 142.0 |
| 1.82x (highest of seven areas, Tokyo) | 116.4 | 124.6 | 132.8 | 141.0 | 149.2 |
Source: Compiled by the HotelBank Editorial Team from MetroEngines Research data
Reading it is straightforward. Raising the multiplier from 1.49x to 1.82x moves the index for the rate per room only 6.6 points, from 109.8 to 116.4, if the double-occupancy share is 20%. The same change in multiplier moves it 19.8 points, from 129.4 to 149.2, at a 60% share. In other words, revisiting the multiplier pays off most on the days when inventory selling to two or more guests is thickest – which is precisely the condition of weekend inventory in the business category, stacking up to 93.1% on Saturday. Conversely, touching only the multiplier on weekday inventory dominated by solo guests will barely move the rate per room. As noted above, the market’s 1.49x to 1.82x is a difference between categories that includes location, on-site facilities and whether meals are included, and cannot be used as-is as the correct twin multiplier for a single property. Use it as an axis for checking which side of the range your own figure sits on, and whether you can explain it when it falls outside.
For revenue managers running business and city hotels nationwide: implications and an action plan
(1) Build around “solo on weekdays, family at the weekend” rather than “solo or family”. Among reviewers, solo at 44.7% and family at 44.4% are effectively level, and roughly 41% of solo stays were for business. Solo demand has not disappeared; the lead segment swaps by day of week. Day-of-week estimated OCC shows the same shape for business hotels, troughing at 84.9% on Monday and 84.4% on Sunday and peaking at 93.1% on Saturday. There is room to switch room-type allocation rules by day of week.
(2) Price twins and doubles for their two distinct roles. Twin at 15.9% and double at 15.3% in business hotels serve as upgrade inventory for solo guests on weekdays and as core inventory for two or more guests at the weekend. Applying the same rate calendar to both tends to leave you unable to push high enough at the weekend and cutting too deep on weekdays. Start by breaking out weekday and weekend sales of your own twins and doubles into single and double-occupancy stays.
(3) Review the rate for two or more guests through the logic of “single rate plus per-person increment”. The market’s city-to-business ratio sat in a range of 1.49x to 1.82x (median 1.60x). If your own double-occupancy rate falls well below that range relative to your single rate, you may be losing bookings under a demand mix in which the family share has risen. If it sits well above, that becomes something to examine as a reason why bookings for two or more guests are not coming in.
(4) Move room composition on a multi-year cycle, rates and allocation weekly. Business hotels have 31.4% of beds able to take two or more guests; that is a renovation-planning question, not something this year’s revenue management can move. What can move this year comes down to two things: which days of the week existing twins and doubles are opened to which party sizes, and how the price gap between single and double occupancy is set.
| Horizon | Action | Decision trigger (figures in this article) | Objective |
|---|---|---|---|
| Today to this week | Overlay your own day-of-week occupancy on the shape for your category | The business category troughs at 84.9% on Monday and 84.4% on Sunday and peaks at 93.1% on Saturday. Do your own trough and peak days differ from that? | Shared basis for varying actions by day of week |
| Today to this week | Take stock of the single-occupancy share of twin and double inventory by day of week | Beds able to take two or more guests are 31.4% in the business category. Is that limited inventory being filled by solo guests on Saturday? | Visibility on weekend bookings being left on the table |
| Within two weeks | Calculate the ratio between your single and double-occupancy rates and compare it against the market range | The market city-to-business ratio is 1.49x to 1.82x (median 1.60x). Does your own ratio fall well outside that range? | Validation of pricing for two or more guests |
| Within two weeks | Consider holding a separate allocation for two or more guests in weekend twins and doubles | The gap between city hotels at 94.4% and business hotels at 93.1% on Saturday is 1.3pt. Category differences all but disappear at the weekend | Lifting the rate per guest at the weekend |
| Looking to next month | Reconcile your own rate range monthly against the estimated settled ADR level for your area | As settled for July 2026, business runs ¥7,491 to ¥12,306 and city ¥11,466 to ¥22,434. Is your own setting still below the level for your area? | Updating the assumptions behind the pricing calendar |
| Looking to next month | Frame how you read year-on-year change with area context included | Osaka business is -31.9% and Kyoto -13.0%, against Fukuoka +3.6% and Hokkaido +4.1%. Were there special factors in your own area last year? | Target setting that avoids misreading year-on-year change |
Source: Compiled by the HotelBank Editorial Team from MetroEngines Research data
Summary: three yardsticks
Yardstick one: the gap between solo and family (0.3pt). Having narrowed from 7.9pt in 2021, this gap shows that the premise behind room mix has changed. But roughly 41% of solo stays are for business, so it does not lead to a decision to cut single inventory across the board. Understanding that the lead segment swaps by day of week is the starting point.
Yardstick two: the share of beds able to take two or more guests (business 31.4%, city 54.6%). Supply composition only moves on a multi-year cycle. That is precisely why the main battleground for revenue management is which days of the week the limited stock of twins and doubles is opened to which party sizes. The fact that the business category stacks up to 93.1% on Saturday means that inventory is already being absorbed in a leisure context.
Yardstick three: the city-to-business ratio (1.49x to 1.82x, median 1.60x). This is the market ADR difference between a category holding a lot of inventory for two or more guests and one that does not. It can be used to check whether you can explain the gap between your own single and double-occupancy rates. Rather than making the ratio itself a target, hold it as a reference for putting into words why you sit outside it.
About the data
– Definition of estimated OCC: occupancy based on OTA-listed inventory = 100 – 100 x rooms remaining on OTAs / total rooms. It is an estimate based on how listed inventory is being absorbed on OTAs and differs by definition from actual room occupancy (it runs higher). The day-of-week estimated OCC in this article covers stay dates from June to July 2026, aggregated across seven major prefectures (Tokyo, Kanagawa, Aichi, Kyoto, Osaka, Fukuoka and Hokkaido) weighted by room count.
– Observation window: the daily series for estimated OCC is based on observations from 45 days before the stay date up to the most recent point. This article uses the most recent observation for each stay date.
– Definition of estimated settled ADR: the transaction price level (tax-excluded equivalent) estimated from OTA and other sales data (lowest-plan level x category coefficient, an ensemble across multiple channels). Past months are settled values; the current and future months are estimates based on the current sales position. Median error against published operating results is 6.6%. July 2025 and July 2026, compared in this article, are both settled values, making this a year-on-year comparison on the same basis.
– Nature of the guest-profile data: the composition by party, purpose and age aggregates the attributes of people who posted accommodation reviews publicly on OTAs and similar platforms; it is not a survey covering all travellers. Because the population that writes reviews is skewed (age in particular skews older), it is treated as a year-on-year change in composition rather than as levels. Composition by country and region is likewise reviewer-based and is not an indicator of demand volume. 2026 is still mid-aggregation and has not been used for year-on-year comparison.
– Breakdown of N: party composition n=488,360 (2021) / 739,842 (2022) / 633,015 (2023) / 606,094 (2024) / 407,873 (2025). Purpose composition n=488,357 / 739,831 / 632,996 / 606,085 / 407,874. Party composition within business-purpose stays n=83,714 (2025). Age composition n=124,011 (leisure, 2025) / 31,355 (business, 2025). Country and region n=3,751,759 (2021) to 4,256,486 (2025). Room bed configuration N=5,773 properties and 668,177 rooms (business hotels) / 1,076 properties and 188,088 rooms (city hotels). Estimated settled ADR N=30-913 properties (by area and category, stated in the table). Day-of-week estimated OCC N=approx. 2,786 properties per day in aggregate (business) / approx. 427 (city) / approx. 227 (resort).
– Data as of: August 23, 2026. Sales positions and inventory change daily, so the figures in this article are a snapshot at the time of retrieval.
References and sources
■ Data sources
Guest-profile data (party, purpose, age, country and region) is a nationwide aggregation of the attributes of people posting public OTA reviews (2021-2025, aggregated as of August 2, 2026). Day-of-week estimated OCC aggregates how OTA-listed inventory was absorbed for stay dates in June and July 2026 across seven major prefectures, weighted by room count. Estimated settled ADR is a monthly aggregation for the same seven prefectures split by business and city hotels (July 2025 and July 2026, both settled). Room bed configuration is a nationwide aggregation of room attributes at operating properties (business hotels N=5,773 properties, 668,177 rooms; city hotels N=1,076 properties, 188,088 rooms). External statistics come from the Japan National Tourism Organization (JNTO), the Japan Tourism Agency and the official EXPO 2025 website.
■ Calculation assumptions
Day-of-week estimated OCC sums daily remaining rooms and total rooms by day of week and derives the figure from the sum of remaining rooms divided by the sum of total rooms (not a simple average of rounded daily values). Year-on-year change is taken between settled values for July 2025 and July 2026, with no mixing of settled and estimated figures. The city-to-business ratio is the estimated settled ADR of city hotels divided by that of business hotels in each area. The three-scenario table and the two-axis sensitivity table are arithmetic taking only the observed ratios for these seven areas as inputs (lower bound 1.49x, median 1.60x, upper bound 1.82x); no external assumptions have been added. The index in the sensitivity table is calculated as 100 x (1 + double-occupancy share x (rate multiplier – 1)), with the double-occupancy share presented as a range because it is a parameter each property has to measure for itself. The roughly 18.4pt for “business-purpose solo” is the product of the 20.5% business share of the purpose mix and the 89.8% solo share within business-purpose stays.
■ Limitations and caveats
The guest-profile data covers the attributes of review posters, not a survey of all travellers. Because the posting population is skewed (age in particular skews older), it has to be read as a year-on-year change in composition rather than as levels in themselves. Composition by country and region is not an indicator of demand volume, and 2026 has not been used for year-on-year comparison as it is still mid-aggregation. Estimated OCC is based on OTA-listed inventory and differs by definition from actual room occupancy (it runs higher). Estimated settled ADR carries a median error of 6.6% against published operating results. Review composition (one review does not necessarily equal one booking, and the data carries no breakdown by hotel category) and room bed configuration (measured per property) come from different populations, so figures such as 44.4% and 31.4% cannot be subtracted directly; only the difference in direction is discussed. The market’s city-to-business ratio is a difference between categories that includes location, on-site facilities and whether meals are included, and is not the correct twin multiplier for any single property.
– Japan National Tourism Organization (JNTO), “Foreign Visitors to Japan (December 2025 estimate)”, published January 21, 2026 — https://www.jnto.go.jp/news/press/20260121_monthly.html
– EXPO 2025 Osaka, Kansai official website, “Overview” (run: April 13 to October 13, 2025) — https://www.expo2025.or.jp/overview/
– Japan Tourism Agency, “Accommodation Survey” — https://www.mlit.go.jp/kankocho/tokei_hakusyo/shukuhakutokei.html
Related reading
- Solo vs Family Stays Just 0.3pt Apart — Rethinking Rate and Inventory
- Hokkaido Business Hotels Aren’t Weekend-Led: Thu 95.4% Ties Sat 95.4%
- Kyoto Day-of-Week OCC: Thursday 90.4% Edges Friday, May–Jul 2026
- Osaka Settled ADR June 2026: City -26.3%, Business -32.8% Post-Expo
- Kanagawa ADR Splits: City Hotels +20.9%, Business −1.7% in June 2026
- Fukuoka Settled ADR Slows +14.4% to +3.6% — Breakfast Premium Next?
- City Hotels: 45.9% of Guest Nights Are Foreign — Ryokan +3.7%