

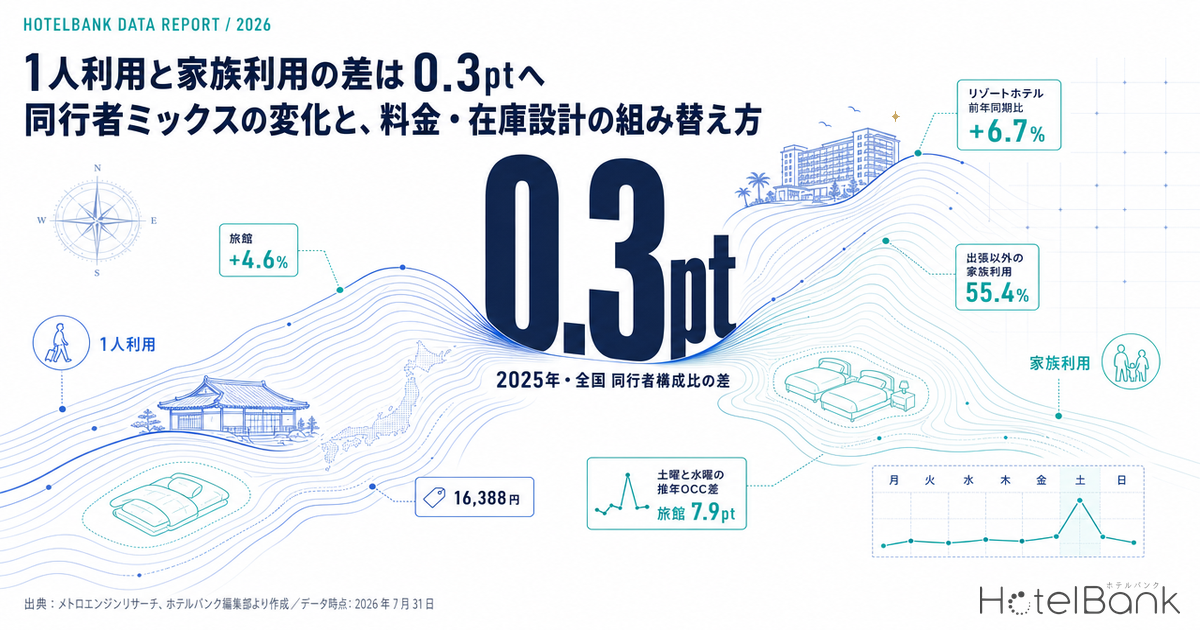
Across Japan, the companion mix visible in reviewer attributes has shifted its centre of gravity over the past five years. In 2021, solo stays accounted for 46.5% against 38.6% for family stays — a gap of 7.9pt. In 2025, solo stays were 44.7% and family stays 44.4%, narrowing the gap to just 0.3pt (N=407,873 reviews). Excluding business-purpose stays, the estimated family share moved from 49.0% in 2021 to 55.4% in 2025, already a majority (estimate, N=324,159 reviews). Over the same period, estimated settled ADR in finalized months rose faster for the hotel types whose rooms are built around multiple occupants. Year-on-year for January–June 2026 (finalized): resort hotels +6.7% (¥15,400 → ¥16,400) and ryokan +4.6% (¥14,300 → ¥15,000), against business hotels +2.2% (¥8,500 → ¥8,700) and city hotels +2.0% (¥13,100 → ¥13,300). A BAR structure still built around single occupancy risks leaving this structural change on the table.
Scope: nationwide / business hotels N=7,376–7,483 properties, city hotels N=1,093–1,113 properties, ryokan N=6,531–6,893 properties, resort hotels N=1,523–1,597 properties (finalized months, January–June 2026). Guest-profile data comes from nationwide public reviewer attributes, N=407,873–488,360 reviews (annual). Price figures in this article are estimated settled ADR (the settled price level estimated from OTA and other sales data, pre-tax equivalent); occupancy is an estimate based on OTA-listed inventory. Definitions for both appear at the end of the article. Data as of 31 July 2026.
- — 0.3pt The nationwide companion mix has converged to 44.7% solo and 44.4% family. The gap has narrowed from 7.9pt in 2021, with family stays accounting for most of the increase (2025, N=407,873 reviews).
- — 55.4% Within the leisure segment — business trips excluded — family stays are already a majority. The right yardstick for your own property is this figure, not the overall 44.4% (estimate, 2025).
- — +6.7% / +2.2% Year-on-year estimated settled ADR in finalized months: resort hotels +6.7% and ryokan +4.6%, against business hotels +2.2% and city hotels +2.0% (January–June 2026, finalized).
- — 7.9pt / 0.4pt The Saturday-versus-Wednesday gap in estimated OCC is 7.9pt for ryokan and 5.2pt for resorts, but 0.4pt for business hotels and 1.2pt for city hotels. Different hotel types build occupancy on different days of the week (June 2026).
- — 26.2% Among leisure-purpose reviewers, 26.2% are in their sixties and 7.5% in their seventies. Product design that assumes “family = travelling with children” will not capture the full multi-occupant demand (2025).
From 7.9pt to 0.3pt: the gap between solo and family stays
Start with the overall picture. The guest-profile data used here aggregates, by year, the attributes reviewers report alongside their public OTA reviews. It is not a survey of travellers, and it must be read as the distribution of self-declared attributes among people who wrote a review.
In 2021 the companion mix was 46.5% solo, 38.6% family, 6.8% couples, 4.9% friends and 2.4% colleagues (N=488,360 reviews). In 2025 it was 44.7% solo, 44.4% family, 3.9% couples, 4.5% friends and 2.0% colleagues (N=407,873 reviews). Solo stays fell by only 1.8pt and remain the largest single segment. What moved was family stays, up 5.8pt. The path was not a straight line: the gap briefly narrowed to 0.2pt in 2023 (43.8% solo / 43.6% family, N=633,015 reviews), widened again to 3.1pt in 2024 (45.6% / 42.5%, N=606,094 reviews), then returned to 0.3pt in 2025. That back-and-forth matters for how the demand mix should be read, as discussed below.
Source: Compiled by MetroEngines Research and the HotelBank Editorial Team
Over these five years the shares of couples, friends and colleagues all shrank; in practice, family stays were the only category to grow. So rather than “solo stays fell and family stays rose,” the pattern is closer to “solo stays held roughly flat while the smaller other categories were absorbed into family stays.” The revenue-management implication is straightforward: protect the single-occupancy inventory while separately building selling power for inventory that can accommodate two or more guests.
Outside business travel, family stays are already the majority
The overall mix is heavily pulled by business-purpose stays. Looking only at business trips, solo stays became even more concentrated, from 87.8% in 2021 (N=109,668 reviews) to 89.8% in 2025 (N=83,714 reviews) — business travel is in effect almost entirely single occupancy. Meanwhile the split by trip purpose shifted: leisure from 69.7% in 2021 to 74.7% in 2025, business from 22.5% to 20.5% (N=488,357 → 407,874 reviews).
Estimating the companion mix for non-business stays (leisure and other) from the overall mix, the business-purpose mix and the review counts behind each, family stays rise 6.4pt from 49.0% in 2021 to 55.4% in 2025, while solo stays fall 1.4pt from 34.5% to 33.1%. Outside business travel, family stays are already the majority segment. Business travel itself is not monolithic either — some trips are now extended into leisure stays, which shifts the companion mix inside what is nominally a business booking.
| Year | Total N (reviews) | Solo | Family | Gap | Non-business N (reviews, est.) | Non-business family share |
|---|---|---|---|---|---|---|
| 2021 | 488,360 | 46.5% | 38.6% | 7.9pt | 378,692 | 49.0% |
| 2022 | 739,842 | 46.3% | 40.7% | 5.6pt | 584,829 | 50.9% |
| 2023 | 633,015 | 43.8% | 43.6% | 0.2pt | 508,429 | 53.8% |
| 2024 | 606,094 | 45.6% | 42.5% | 3.1pt | 473,028 | 53.9% |
| 2025 | 407,873 | 44.7% | 44.4% | 0.3pt | 324,159 | 55.4% |
Source: Compiled by MetroEngines Research and the HotelBank Editorial Team. Non-business figures are estimates derived from the difference in review counts between the overall mix and the business-purpose mix.
The composition of “family” also deserves attention. Among leisure-purpose reviewers, the share in their sixties rose from 19.0% in 2021 to 26.2% in 2025 and the share in their seventies from 4.5% to 7.5%, while those in their twenties fell from 5.8% to 3.4% and those in their forties from 24.7% to 20.7% (N=132,426 → 124,011 reviews). Age structure here reflects the people who write reviews rather than all guests, but it does show that “more family stays” cannot be read as shorthand for “more small children.” For room design, it is safer to assume a substantial volume of two- and three-generation trips, adult children travelling with parents, and senior couples. Setting up bedding-share arrangements alone will not capture pairs who want separate beds, or guests who care about steps and bathroom usability.
Nationality mix is worth placing alongside this. The share of overseas reviewers rose from 15.5% in 2021 (N=3,751,746 reviews) to 41.4% in 2023 (N=4,704,914 reviews) and 44.7% in 2024 (N=4,896,529 reviews), then stood at 38.5% in 2025 (N=4,250,877 reviews) (period covered: 2021–2025). Reading the shift in companion mix as a purely domestic phenomenon would misdirect allocation. Multi-occupant demand includes both domestic family travel and group stays from overseas.
Estimated settled ADR in finalized months — multi-occupant types pulled ahead
To see whether the shift in guest profile is showing up in price, compare estimated settled ADR across finalized months only. Every month from January to June 2026 is a finalized figure and can be compared with the finalized figure for the same month a year earlier. Weighting the values for all 47 prefectures by property count gives the following.
| Hotel type | Jan–Jun 2025 (finalized) | Jan–Jun 2026 (finalized) | YoY | N (properties) |
|---|---|---|---|---|
| Resort hotels | ¥15,359 | ¥16,388 | +6.7% | 1,523–1,597 |
| Ryokan | ¥14,318 | ¥14,971 | +4.6% | 6,531–6,893 |
| Business hotels | ¥8,524 | ¥8,713 | +2.2% | 7,376–7,483 |
| City hotels | ¥13,065 | ¥13,322 | +2.0% | 1,093–1,113 |
| Capsule hotels (reference) | ¥4,626 | ¥5,055 | +9.3% | 73–117 (25–31 prefectures) |
Source: Compiled by MetroEngines Research and the HotelBank Editorial Team. Monthly estimated settled ADR (finalized values) weighted by property count, then averaged unweighted across January–June.
Resort hotels and ryokan — the types with many rooms designed for several guests sharing — rose +6.7% and +4.6%, while business and city hotels, centred on single occupancy, rose +2.2% and +2.0%. Capsule hotels show the largest gain at +9.3%, but the sample differs by year: 158–177 properties in January–June 2025 against 73–117 in the same period of 2026, covering only 25–31 prefectures. With the population turning over between years, that growth rate cannot simply be lined up against the other types. The absolute level is also low, at ¥4,600 → ¥5,100, so it is treated as a reference figure. The gap that has opened between hotel types is broken down by prefecture × category in Japan Hotel ADR Polarization 2026: 57.6pt Prefecture×Category Gap.
That said, this is not happening uniformly through the year. Overlaying resort hotels month by month across years shows an extreme seasonal amplitude in its own right. In 2025 finalized values, August was the annual high at ¥21,300 (N=1,528 properties) and June the annual low at ¥14,500 (N=1,526 properties) — a spread of about ¥6,800. Demand tied closely to school holidays effectively sets the price range for the year. In 2026, the finalized January–June values are tracking above 2025, and from July onwards the figures are estimates based on current sales conditions: ¥20,800 for August (N=1,584 properties) and ¥18,700 for December (N=1,283 properties). Because estimates can move with future sales conditions, they should not be compared directly with finalized values; treat them as an indication of shape only.
Source: Compiled by MetroEngines Research and the HotelBank Editorial Team
Estimated OCC by day of week — weekday plateau versus Saturday peak
Differences in companion mix also show up in the shape of demand within the week. Daily estimated OCC (based on OTA-listed inventory) for June 2026 (a month in progress) was aggregated across all 47 prefectures and averaged by day of week, weighted by room count. The value for each stay date is based on the last observed listed inventory for that date (0–1 days before the stay).
Business hotels (N=6,431 properties per day, median) are almost flat at 92.0% on Tuesday, 92.2% on Wednesday, 92.7% on Thursday and 92.6% on Saturday, with only Sunday dropping, to 84.6%. City hotels (N=1,027 properties per day) are similarly elevated at 92.9% Thursday, 92.9% Friday and 93.1% Saturday, with troughs on Monday (87.0%) and Sunday (87.7%). By contrast, ryokan (N=5,296 properties per day) run 92.5% on Saturday against 84.6% on Wednesday and 84.6% on Thursday, and resort hotels (N=1,347 properties per day) 91.1% on Saturday against 85.9% on Wednesday.
Taking the Saturday-minus-Wednesday difference: 0.4pt for business hotels, 1.2pt for city hotels, 5.2pt for resort hotels and 7.9pt for ryokan. Types centred on single occupancy fill most of the week at a high level — a “weekday plateau” — while types centred on multiple occupancy concentrate demand on Saturday, a “Saturday peak.” Looking at the same country and the same month, the days that generate occupancy are completely different. The same shape can be traced down to prefecture level, where the depth of the Sunday trough varies considerably from market to market.
Source: Compiled by MetroEngines Research and the HotelBank Editorial Team
One caution here: differences between hotel types do not necessarily map one-to-one onto differences in guest profile. Urban business hotels do receive family stays, and ryokan do accept solo guests. What this shape does strongly govern is how much room there is to move price within the week — that is, how much of the Saturday demand peak can be absorbed through pricing. For a weekday-plateau property going after family demand, the headroom lies mainly not on Saturday but on Friday, Sunday and the long-holiday periods.
For revenue managers running hotels and ryokan in Japan — implications and an action plan
(a) Operational insights
1. Read this as “family stays caught up,” not “solo stays declined.” Solo stays moved only 1.8pt, from 46.5% to 44.7%. This is not an argument for cutting single-occupancy inventory; it is an argument for separately building selling power for two-plus-occupancy inventory. If your existing BAR is built on a single-occupancy basis, that basis can reasonably stay in place for now, while the charging structure for the second and subsequent guests, and the inventory allocation of room types that accommodate two or more, are carved out as independent decisions.
2. Adjust your own guest mix for business share before benchmarking it against the market. In 2025, 89.8% of business-purpose stays were single occupancy, so the higher a property’s business share, the higher its overall solo ratio will automatically appear. Rather than comparing directly with the market’s 44.7% / 44.4%, use the 55.4% family share among non-business stays as the yardstick and check the multi-occupant ratio within your own leisure segment. If it sits well below 55.4%, that is a starting point for suspecting that the product side is failing to accommodate multiple guests.
3. Match the rate-change calendar to your type’s seasonal amplitude. For resort hotels, the 2025 finalized values were ¥21,300 in August and ¥14,500 in June — an in-year amplitude of about ¥6,800. The more a property depends on multi-occupant demand, the wider its in-year price range has to be. Conversely, business hotels’ finalized year-on-year change of +2.2% is modest, and the case for widening the range rests not on season but on day of week and individual dates.
4. The days with headroom differ by hotel type. The Saturday-versus-Wednesday gap in estimated OCC is 7.9pt for ryokan and 5.2pt for resorts, against 0.4pt for business and 1.2pt for city hotels. At properties where weekdays are already filled to a plateau, creating capacity for family demand will not change an already-high Saturday; the days where pricing can absorb demand are more likely to be Friday, Sunday and the dates around long weekends.
5. Do not design “family” around children alone. Among leisure-purpose reviewers, 26.2% are in their sixties and 7.5% in their seventies (2025). Beyond arranging bedding-share options, check whether rooms with separable beds, or rooms that reduce the strain of moving around and using the bathroom, are actually on the shelf as multi-occupant products.
(b) Action plan
| Time horizon | Action | Trigger | Objective |
|---|---|---|---|
| Today to this week | Split your own stay records into business and non-business, and calculate the multi-occupant ratio within non-business stays | Non-business family stays sit well below the market’s 55.4% | Separate a product-side constraint from a demand-side constraint |
| Today to this week | Reconcile the number of room-type units that can be sold to two or more guests with the number actually on the shelf | A high share of multi-occupancy-capable rooms is still being sold to single guests, unaddressed | Make visible the erosion of multi-occupant inventory by single-occupancy sales |
| Within two weeks | Reset the price and inventory cap for multi-occupant products separately by day of week | Your in-week occupancy shape resembles the weekday-plateau pattern, with a Saturday-versus-Wednesday gap of 0.4–1.2pt | Place capacity for multi-occupant demand on days other than Saturday (Friday and Sunday) |
| Within two weeks | Review whether your per-person charging (the increment for the second guest onward) is reasonable, alongside market levels by hotel type | Your per-room setting for the month in question remains below the market’s estimated settled ADR (ryokan ¥14,971 / resorts ¥16,388, finalized January–June 2026) | Bring the per-room rate for multi-occupant stays back within the market range |
| Looking to next month | Redraw the in-year rate-change calendar to match your type’s seasonal amplitude | At a property led by multi-occupant demand, the in-year price range is clearly narrower than the market’s amplitude (about ¥6,800 for resorts, 2025 finalized) | Simultaneously reduce missed revenue in peak periods and excessive holding of rates in slow periods |
| Looking to next month | Rewrite room descriptions for multi-occupant products at a level of detail that senior and two-generation guests can act on | Against an age structure of 26.2% in their sixties and 7.5% in their seventies among leisure travellers, your multi-occupant products are described mainly for guests travelling with children | Widen the range of multi-occupant demand the same inventory can serve |
Source: Compiled by MetroEngines Research and the HotelBank Editorial Team
Summary — three yardsticks
When translating the shift in companion mix into decisions at your own property, three reusable yardsticks stand out.
Yardstick 1: the 55.4% non-business family share. Not the overall 44.4% but the 55.4% recorded once business travel is excluded is the reference point for measuring the multi-occupant ratio within the leisure segment. How far your own leisure segment sits from that level determines the priority of revisiting product design.
Yardstick 2: the year-on-year gap in finalized months (+6.7% / +4.6% versus +2.2% / +2.0%). Price growth has diverged between types built around multiple occupants and those centred on single occupancy. Which shape your property resembles determines whether pricing should be anchored to season or to day of week.
Yardstick 3: the Saturday-versus-Wednesday gap in estimated OCC. It ranges from 0.4pt (business) to 7.9pt (ryokan). Where that gap is small, the place to pursue multi-occupant demand is not Saturday but Friday, Sunday and the long-holiday periods. Adding family-oriented products without first checking where the vacancy sits within the week risks simply cannibalising existing demand.
Solo stays remain the largest single segment, and there is no need to rush a decision to cut that inventory. But since most of the growth is coming from multi-occupant stays, it is worth deciding which inventory absorbs that growth as a separate question from the level of BAR itself.
About the data
■ Data sources
Guest-profile data: annual aggregation of reviewer attributes attached to public reviews, nationwide scope. Companion and trip purpose N=407,873–739,842 reviews per year; age structure N=124,011–132,426 reviews per year; nationality mix N=3,751,746–4,896,529 reviews per year (years covered: 2021–2025). Price and inventory data: histories of publicly listed OTA selling prices and listed inventory, collected daily for all 47 prefectures and aggregated by hotel type and prefecture. Compiled by MetroEngines Research and the HotelBank Editorial Team.
■ Calculation assumptions
Estimated OCC (based on OTA-listed inventory) = 100 − 100 × OTA-listed remaining rooms ÷ total rooms. It is based on the last observed listed inventory for each stay date (0–1 days before the stay), and days with markedly low observation coverage are excluded from the aggregation. The month covered is June 2026 (a month in progress), the scope is all 47 prefectures, and day-of-week figures are weighted by room count. Estimated settled ADR is a settled price level (pre-tax equivalent) estimated from OTA and other sales data (lowest-plan level × hotel-type coefficient, ensembled across multiple channels); past months are finalized values, while the current and future months are estimates based on current sales conditions. Reconciliation against published operating results gives a median error of 6.6%. Year-on-year figures by hotel type weight each month’s finalized value by property count and then take the unweighted average across January–June. The non-business companion mix is an estimate derived from the overall mix, the business-purpose mix and the difference in review counts between them. N covered (estimated settled ADR): business hotels 7,376–7,483 properties, city hotels 1,093–1,113 properties, ryokan 6,531–6,893 properties, resort hotels 1,523–1,597 properties, capsule hotels 73–117 properties (25–31 prefectures; 158–177 properties in the same period of 2025). N covered (day-of-week estimated OCC, median of the daily nationwide total): business hotels 6,431 properties, city hotels 1,027 properties, ryokan 5,296 properties, resort hotels 1,347 properties.
■ Limitations and caveats
Guest-profile data is not a survey of travellers but the distribution of self-declared attributes among people who wrote a review, and it does not match the composition of all guests. Age structure likewise reflects the population that writes reviews. Estimated OCC is an estimate based on how inventory sold on OTAs is taken up, and its definition differs from actual room occupancy (it runs higher). For capsule hotels the set of aggregated properties turns over between years (158–177 properties in January–June 2025 against 73–117 in the same period of 2026), so the growth rate is treated as a reference figure rather than lined up against other types. Estimated settled ADR from July 2026 onward is based on current sales conditions and cannot be compared directly with finalized values. For nationality mix, the 2026 denominator has accumulated less than a third of the prior year’s volume because of the lag in review posting and is not yet settled, so this article discusses 2021–2025 only. Data as of 31 July 2026. Because sales conditions and inventory change daily, the figures in this article are a snapshot as of the time of retrieval.