

Tokyo Game Show 2026, one of the world’s largest gaming events, runs from Thursday, September 17 to Monday, September 21, 2026 (a public holiday) at Makuhari Messe. Marking its 30th anniversary, this edition is themed “The Longest Ever — 5 Days Packed With Play” and becomes the first five-day Tokyo Game Show in the event’s history, with organizers anticipating 300,000 visitors. September 17 and 18 are business days; September 19 through 21 are public days, and those final three days coincide exactly with the 2026 Silver Week three-day weekend. This article takes a measured inventory of the guest-room stock around Makuhari that will absorb these five days, and breaks down how far booking progress at the 45-days-out fixed point has moved above normal days — across Chiba Prefecture as a whole, by ward and city, and by hotel segment.
Metric Definitions Used in This Article
- ADR (average daily rate): an estimated settled rate (tax-excluded equivalent) calculated by applying segment-specific adjustment coefficients to the lowest published plan level each property lists on OTAs (double occupancy, per-room rate, tax-included). Cross-checked against property-level results disclosed by listed hotel REITs (91 properties, most recent three months), the median error is approximately 7%. These are estimates and differ from each property’s actual transacted rates or accounting figures. Area-level ADR is the median of the target properties (the level of a typical property in that area).
- Published price: the average of all plans listed on OTAs (double occupancy, per-room rate, tax-included). It spans room-only through meal-inclusive plans. Because the average automatically rises as cheaper plans sell out and leave inventory, it does not represent the size of a rate increase itself.
- Occupancy (OCC): the share of sold rooms against total rooms in the area (an estimate based on OTA sales inventory). It is an estimate derived from how OTA-listed inventory is being absorbed and differs from a property’s actual overall occupancy.
- LT (lead time): days remaining until check-in. LT0 = same day. This article fixes LT45 (45 days out) as the comparison point, where the observed sample is consistent.
- Data source: MetroEngines Research
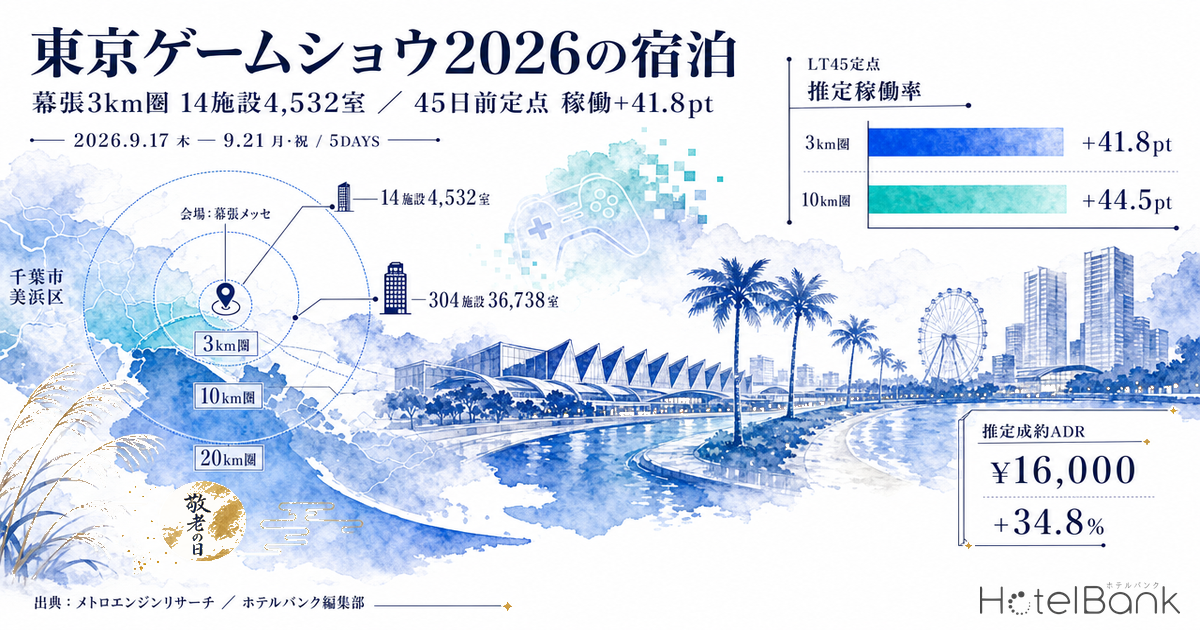
- — 14 properties and 4,532 rooms within 3km / 103 properties and 13,984 rooms within 10km / 304 properties and 36,738 rooms within 20km. About 44% of the rooms inside the 3km ring sit in a single large property.
- — Estimated occupancy at the 45-days-out fixed point exceeds same-weekday normal days on all five event days. Across Chiba Prefecture the gap runs +5.5 to +20.6pt, peaking on Sunday, September 20.
- — The epicenter is Mihama Ward in Chiba City, 0.5km from the venue, at +30.4 to +44.5pt. The effect decays with distance: Chuo Ward, Chiba City +18.9 to +34.8pt, Funabashi City +7.3 to +24.0pt, Tokyo +0.4 to +10.0pt.
- — Segments react at different times. On the first-half business days, city hotels (+11.2pt) and business hotels (+6.7pt) move first; resort hotels only start moving on the three holiday-weekend days (+15.6 to +16.5pt).
A First-Ever Five Days, 300,000 Expected — Pinning Down the Event Parameters First
According to the event outline published by the organizer, the Computer Entertainment Supplier’s Association (CESA), Tokyo Game Show 2026 runs for five days, from Thursday, September 17 through Monday, September 21, 2026 (a public holiday). The venue comprises Makuhari Messe Exhibition Halls 1 through 11 and the International Conference Hall, plus TKP Tokyo Bay Makuhari Hall. Nikkei BP and Sony Music Solutions are co-organizers, the exhibition is planned at 3,500 booths, and expected attendance is 300,000.
What matters decisively for reading lodging demand is that these five days are not homogeneous. Thursday, September 17 and Friday, September 18 are business days running from 10:00 to 17:00, with attendance centered on exhibitors, press, and buyers attending for business meetings. The three days from Saturday, September 19 through Monday, September 21 (holiday) are public days running from 9:30 to 16:00. The structure is two consecutive blocks of entirely different character: corporate weekday demand for the first two days, and holiday-weekend leisure demand for the final three.
On top of that, the final three days overlap exactly with the first half of Japan’s 2026 Silver Week (the September 19–21 three-day weekend). September 21 is Respect for the Aged Day, and two days later, September 23, is the Autumnal Equinox holiday, with Tuesday, September 22 in between forming a staggered extended break. In other words, for hotels around Makuhari, September 19–21 is three days in which “event demand” and “holiday leisure and family-visit demand” compete for the same room inventory, while September 17–18 offers a purer cross-section of event demand with no holiday factor.
| Date | Day | Event category | Hours | Calendar factor |
|---|---|---|---|---|
| September 17 | Thu | Business day | 10:00–17:00 | Weekday |
| September 18 | Fri | Business day | 10:00–17:00 | Weekday |
| September 19 | Sat | Public day | 9:30–16:00 | Day 1 of 3-day weekend |
| September 20 | Sun | Public day | 9:30–16:00 | Day 2 of 3-day weekend |
| September 21 | Mon (holiday) | Public day | 9:30–16:00 | Respect for the Aged Day |
Source: Computer Entertainment Supplier’s Association, “Tokyo Game Show 2026” event outline; compiled by the HotelBank Editorial Team
Taking Inventory of the Supply — 14 Properties and 4,532 Rooms Within 3km, 13,984 Rooms Within 10km
Next, we measure the room stock that will absorb these five days. Centered on Makuhari Messe (approximately 35.648°N, 140.035°E), we aggregated properties tracked by MetroEngines Research across three concentric bands — 3km, 10km, and 20km radius — limited to those with confirmed OTA listing activity from August 2026 onward. Cases where a single building carries multiple records due to a brand change (old and new brand names coexisting) were consolidated by matching coordinates, removing duplicates.
| Distance band | Properties | Rooms | Cumulative rooms | Main locations |
|---|---|---|---|---|
| 0–3km | 14 | 4,532 | 4,532 | Kaihin-Makuhari Station area, Makuhari-Hongo |
| 3–10km | 89 | 9,452 | 13,984 | Chiba Station area, Tsudanuma, Funabashi |
| 10–20km | 201 | 22,754 | 36,738 | Maihama / Shin-Urayasu, eastern Tokyo |
| Total (within 20km) | 304 | 36,738 | — | — |
Source: MetroEngines Research (based on confirmed OTA listings, N=304 properties, limited to properties with listing activity from August 2026 onward, duplicates within the same building consolidated); compiled by the HotelBank Editorial Team
The 3km ring holds 14 properties and 4,532 rooms. A single 2,000-room-class property stands in front of Kaihin-Makuhari Station, accounting for roughly 44% of the rooms in that ring. In other words, the stock closest to Makuhari consists of “one large hotel plus seven or eight properties in the 200–400 room class” — a high concentration of rooms relative to the number of properties. Extend beyond walking and shuttle range to the Chiba Station area, Tsudanuma, and Funabashi and the 10km ring reaches 103 properties and 13,984 rooms; include Maihama, Shin-Urayasu, and eastern Tokyo (Kasai, Toyocho, Shiomi) and the 20km ring reaches 304 properties and 36,738 rooms.
By municipality, the deepest room stock within the 20km ring is Urayasu City, with 41 properties and 12,164 rooms — 33.1% of all rooms in the ring. Urayasu’s stock, however, is concentrated in theme-park-adjacent locations in Maihama and Shin-Urayasu, 9.4km or more from Makuhari Messe. Next come Chuo Ward, Chiba City (46 properties, 4,713 rooms) and Mihama Ward, Chiba City (13 properties, 4,155 rooms). Distance from Kaihin-Makuhari and room volume do not line up neatly: this trade area is not structured so that the closest places hold the most rooms.
| Municipality | Properties | Rooms | Share of ring | Shortest distance from venue |
|---|---|---|---|---|
| Urayasu City | 41 | 12,164 | 33.1% | 9.4km |
| Chuo Ward, Chiba City | 46 | 4,713 | 12.8% | 7.5km |
| Mihama Ward, Chiba City | 13 | 4,155 | 11.3% | 0.5km |
| Koto Ward, Tokyo | 24 | 3,557 | 9.7% | 18.0km |
| Edogawa Ward, Tokyo | 37 | 2,871 | 7.8% | 13.5km |
| Ichihara City | 18 | 1,627 | 4.4% | 13.7km |
| Funabashi City | 22 | 1,404 | 3.8% | 5.1km |
| Ichikawa City | 14 | 1,266 | 3.4% | 9.6km |
| Katsushika Ward, Tokyo | 27 | 670 | 1.8% | 17.4km |
| Narashino City | 4 | 416 | 1.1% | 2.7km |
| Hanamigawa Ward, Chiba City | 6 | 390 | 1.1% | 2.3km |
| Yachiyo City | 5 | 373 | 1.0% | 7.6km |
| Sakura City | 7 | 336 | 0.9% | 13.7km |
Source: MetroEngines Research (based on confirmed OTA listings, within a 20km radius of Makuhari Messe, N=304 properties); compiled by the HotelBank Editorial Team. Shaded rows are municipalities that fall partly within the 3km ring. Small residual counts for other municipalities such as Sumida Ward are omitted from display.
Source: MetroEngines Research (based on confirmed OTA listings; 218 properties with 20 or more rooms plotted)
Booking Progress at the 45-Days-Out Fixed Point — Chiba Runs Up to +20.6pt Above Same-Weekday Normal Days
From here we turn to the demand side. Because the observed sample in a booking curve shifts by day, comparing dates directly lets differences in the sample bleed into the result. We therefore fix the comparison at LT45 (45 days before check-in), where the observed property count is nearly level across all 13 target dates at 686–723 properties, and compare against the average of same-weekday normal days (September 10 and 24 = Thursday; 11 and 25 = Friday; 12 and 26 = Saturday; 13 and 27 = Sunday; 14 = Monday). The Chiba Prefecture target set is 741 properties and 48,348 rooms, with 692–706 properties observed at LT45.
| Date | Category | Estimated occupancy | Same-weekday normal day | Gap | Published price | Same normal day |
|---|---|---|---|---|---|---|
| Sep 17 (Thu) | Business day | 72.4% | 66.7% | +5.7pt | ¥29,400 | ¥28,000 |
| Sep 18 (Fri) | Business day | 75.1% | 69.5% | +5.5pt | ¥34,100 | ¥30,600 |
| Sep 19 (Sat) | Public day | 85.2% | 72.5% | +12.7pt | ¥49,900 | ¥36,300 |
| Sep 20 (Sun) | Public day | 87.2% | 66.6% | +20.6pt | ¥49,800 | ¥29,000 |
| Sep 21 (Mon, hol.) | Public day | 81.9% | 64.4% | +17.5pt | ¥42,400 | ¥28,100 |
Source: MetroEngines Research (Chiba Prefecture, all segments, LT45 fixed point, target 741 properties / 48,348 rooms, 692–706 properties observed); compiled by the HotelBank Editorial Team
All five days sit above their same-weekday normal days. The largest gap is Sunday, September 20 at +20.6pt, followed by Monday, September 21 (holiday) at +17.5pt and Saturday, September 19 at +12.7pt — all three public days in double-digit point territory. The business days, Thursday, September 17 and Friday, September 18, at +5.7pt and +5.5pt, are also clearly elevated for weekdays. Average published price moves the same way, with September 19 at ¥49,900 against ¥36,300 for a normal Saturday. That said, average published price naturally rises as cheaper plans sell through first and the remaining inventory skews upward, so this gap cannot be read directly as the size of a rate increase. For how pricing played out at a comparable large event at the same Makuhari Messe venue, our analysis of the five-day Summer Sonic 2026 waveform is also useful.
Source: MetroEngines Research (Chiba Prefecture, all segments, LT45 fixed point); compiled by the HotelBank Editorial Team
The other thing worth checking is whether progress is still moving. Across the 12 days from August 2 to August 13, 2026, when the observed sample holds at 650 or more properties, we tracked estimated occupancy for each target date. September 20 moved from 86.6% to 89.0% and September 19 from 84.4% to 86.7% — gains of 2.4pt and 2.3pt in those 12 days alone. The normal day of Saturday, September 12 also moved, from 74.3% to 77.3%, so progress itself is ongoing across all dates. Bear in mind this is a cross-section taken more than a month before the event, not a settled final occupancy.
Source: MetroEngines Research (Chiba Prefecture, all segments, days with 650 or more properties observed only); compiled by the HotelBank Editorial Team
Wednesday, September 16 — the day before the event opens — also shows progress lifting off. At the LT45 fixed point, estimated occupancy for Chiba Prefecture overall is 71.8% (check-in September 16, 2026, LT45 fixed point), running 3.3pt above the comparable Wednesday of September 9 (68.5%) and 4.1pt above the preceding day, Tuesday, September 15 (67.7%). Move-in, setup, and pre-event overnight stays are showing up in inventory a day earlier than opening day. Meanwhile, after the event, Tuesday, September 22 sits at 70.1% — high for a weekday — while Wednesday, September 23 (Autumnal Equinox Day) stalls at 62.8%. The demand peak concentrates from the eve of the event through the event itself and does not extend afterward. Booking progress for the back half of the holiday period covering September 22–23 is broken out separately in our analysis of the final two days of Silver Week 2026.
The Epicenter Is Mihama Ward — A Gradient That Decays With Distance From the Venue
The prefecture-wide figure is an average that includes the Boso and Narita areas far from the venue. To locate the epicenter, we broke the same LT45 fixed point down by municipality.
| Area | Sep 17 Thu | Sep 18 Fri | Sep 19 Sat | Sep 20 Sun | Sep 21 Mon hol. | Properties observed |
|---|---|---|---|---|---|---|
| Mihama Ward, Chiba City (from 0.5km) | +41.8 | +31.4 | +43.9 | +44.5 | +30.4 | 11–12 |
| Chuo Ward, Chiba City (from 7.5km) | +18.9 | +22.6 | +19.8 | +29.1 | +34.8 | 29–32 |
| Funabashi City (from 5.1km) | +7.3 | +10.1 | +13.9 | +24.0 | +20.7 | 13 |
| Chiba Prefecture overall | +5.7 | +5.5 | +12.7 | +20.6 | +17.5 | 692–706 |
| Tokyo (reference) | +0.7 | +0.4 | +6.7 | +10.0 | +7.6 | 1,306–1,341 |
Figures are the gap versus the same-weekday normal-day average (pt). Source: MetroEngines Research (LT45 fixed point, estimated occupancy); compiled by the HotelBank Editorial Team
A clean gradient emerges. Mihama Ward in Chiba City, closest to the venue, is above +30pt on all five days and spikes to +44.5pt on Sunday, September 20. From there it decays: Chuo Ward, Chiba City at +18.9 to +34.8pt, Funabashi City at +7.3 to +24.0pt, Chiba Prefecture overall at +5.7 to +20.6pt, and Tokyo down to +0.4 to +10.0pt. Tokyo’s two business days in particular, at +0.7pt and +0.4pt, are essentially at normal-day levels, and its +6.7 to +10.0pt over the final three days is explainable by the holiday weekend alone. Put the other way round, the fact that only the Chiba side is elevated on the weekdays of September 17 and 18 is the clearest evidence that this lift is event-driven.
Source: MetroEngines Research (LT45 fixed point, gap versus the same-weekday normal-day average); compiled by the HotelBank Editorial Team
Mihama Ward’s figures do, however, need to be read with care. The sample with confirmed OTA listings inside the ward is 11–13 properties and 4,139 rooms, of which one property with 2,007 rooms accounts for roughly 48% of listed inventory. The ward average is therefore easily linked to that single large property’s inventory-release timing, and the small property count amplifies swings. Estimated occupancy on normal days sitting at a low 23.0–48.9% also inflates the size of the point gaps. The direction is unambiguous, but the absolute values should be read knowing they lack the stability of Chuo Ward (29–32 properties) or the prefecture as a whole (692–706 properties), which have far larger samples.
Segments Diverge — Business Hotels From the Weekdays, Resorts From the Holiday Weekend
Breaking the same LT45 fixed point down by segment shows a clear split between which segments respond in the first half of the event and which respond in the second.
| Segment | Sep 17 Thu | Sep 18 Fri | Sep 19 Sat | Sep 20 Sun | Sep 21 Mon hol. | Target set |
|---|---|---|---|---|---|---|
| Business hotels | +6.7 | +9.6 | +16.8 | +25.9 | +21.0 | 141 properties, 16,871 rooms |
| City hotels | +11.2 | +10.6 | +16.2 | +19.2 | +15.1 | 52 properties, 15,453 rooms |
| Resort hotels | +0.2 | -2.6 | +4.2 | +15.6 | +16.5 | 59 properties, 7,407 rooms |
Figures are the gap versus the same-weekday normal-day average (pt). Source: MetroEngines Research (Chiba Prefecture, LT45 fixed point, estimated occupancy); compiled by the HotelBank Editorial Team
City hotels respond earliest of the three segments, at +11.2pt on the business day of Thursday, September 17. Business hotels start at +6.7pt and then, once the public days begin, post the largest lift of any segment at +25.9pt on Sunday, September 20. Resort hotels, by contrast, sit essentially at normal levels across the two business days at +0.2pt and −2.6pt, and only begin moving with +15.6pt on Sunday, September 20 and +16.5pt on Monday, September 21 (holiday). The data shows the sequence plainly: business and city hotels absorb the corporate demand of the first two days, and over the final three days leisure demand layers on top, pulling resorts in as well.
This structure indicates what kind of stay collects where across the event. The two business days center on one- and two-night stays for meetings and press coverage, where the trade-off between venue access and price drives selection. The three public days, overlapping the holiday weekend, mix in families, groups, and travelers coming from farther afield, and tolerance for higher rates per guest widens accordingly. Even within the same property, it is better to assume that September 17 and September 20 call for a different product.
Where Rates Sit — Mihama Ward’s September Estimated Settled ADR Is +34.8% Year on Year
Rates are worth checking too. Looking at monthly estimated settled ADR (an estimate) by municipality, as of September 2026 Mihama Ward stands at ¥16,000 (¥11,800 the prior year, +34.8%), Funabashi City at ¥11,200 (¥9,000, +24.2%), and Chuo Ward, Chiba City at ¥11,500 (¥10,000, +15.8%) — the Makuhari-to-central-Chiba corridor is uniformly positioned above the prior-year month. Urayasu City, by contrast, sits below the prior year at ¥20,800 (¥23,400, −11.1%).
| Municipality | July 2026 (settled month) | YoY | September 2026 (current estimate) | YoY | Properties |
|---|---|---|---|---|---|
| Mihama Ward, Chiba City | ¥10,900 | +3.9% | ¥16,000 | +34.8% | 12–13 |
| Chuo Ward, Chiba City | ¥8,900 | -0.6% | ¥11,500 | +15.8% | 32–35 |
| Funabashi City | ¥9,300 | +15.6% | ¥11,200 | +24.2% | 12–14 |
| Urayasu City | ¥18,200 | -14.4% | ¥20,800 | -11.1% | 28–29 |
Estimated settled ADR (tax-excluded equivalent). September 2026 is an estimate calculated from listing levels at the time of the survey and is not a settled figure. July 2026 and each 2025 month are settled months. Source: MetroEngines Research; compiled by the HotelBank Editorial Team
Note, however, that the September 2026 value is an estimate calculated from prices listed on OTAs at the time of the survey, not a settled result. Taking year-on-year change for July 2026, a settled month, gives +3.9% for Mihama Ward, +15.6% for Funabashi City, −0.6% for Chuo Ward, Chiba City, and −14.4% for Urayasu City — nowhere near the growth implied by the September estimate. The September upside is best read as reflecting the price level currently set for a month in which an event and a holiday weekend overlap.
Source: MetroEngines Research (Mihama Ward, Chiba City, 12–13 properties); compiled by the HotelBank Editorial Team
Overlaying Mihama Ward’s estimated settled ADR by year, 2025 traced an autumn-weighted curve, bottoming at ¥10,500 in July and climbing toward ¥15,700 in November. In 2026, after hitting the same floor at ¥10,900 in July, current listings point to a jump to ¥16,000 in September. In other words, the level the prior year did not reach until November is already in place by September.
Where the Overflow Lands, and the Stock Arriving From 2027
If the character of demand switches across the five days, then how the supply is built cannot be uniform either. Over the two business days, venue access ranks highest, centering demand on the Kaihin-Makuhari Station area and central Chiba. Across those two days Mihama Ward moved +41.8pt and +31.4pt and Chuo Ward +18.9pt and +22.6pt, while Funabashi City was comparatively gentle at +7.3pt and +10.1pt — leaving room still available outside the 10km ring.
Over the three public days, the overlap with holiday demand widens the search radius itself. On Sunday, September 20, Funabashi City is at +24.0pt and Chiba Prefecture overall at +20.6pt, so even areas away from the epicenter show double-digit point lifts. Funabashi and Tsudanuma along the Sobu and Keiyo lines, plus eastern Tokyo (Kasai, Toyocho, Shiomi), hold more than 7,000 rooms combined within the 20km ring, yet Tokyo’s overall lift stays at a level consistent with the holiday alone. With information design that states travel time to the venue explicitly, there is meaningful room for this band to function as supply for the final three days.
The medium-term stock is also worth noting. Looking at planned projects in Chiba Prefecture on the basis of the Ministry of Land, Infrastructure, Transport and Tourism’s Building Construction Dynamic Statistics Survey, a mixed-use complex including a 23-story, roughly 1,000-room hotel in 1-chome Hibino, Mihama Ward, Chiba City is registered as having broken ground in January 2025 with completion scheduled for December 2027. Its uses include a cinema, restaurants, and a bathing facility alongside the hotel. If it comes online as planned, room stock within the 3km ring rises roughly 22%, from the current 4,532 rooms to a 5,500-room scale. A 238-room project with completion scheduled for May 2028 is also registered in Maebara-nishi, Funabashi City. How far this 1,000-room mixed-use development will shift the supply-demand balance at Makuhari is explored from an absorption-capacity angle in our analysis of the 1,000-room, ¥30bn mixed-use development in front of Kaihin-Makuhari Station.
*Project counts and room counts for planned properties are based on building confirmation applications as of the survey date and are expected to increase as further applications are filed. Please treat them as a lower bound on the currently confirmed pipeline.
Once the 1,000 rooms scheduled for completion in December 2027 are added, the rooms securable close to the venue during a large-scale event such as Tokyo Game Show grow to roughly 1.2 times the current level. At the same time, a second question arises: how to fill those 1,000 rooms on normal days. The swing this data reveals for Mihama Ward — 23.0–48.9% on normal days versus 72.2–81.4% on event days — becomes a far larger design question once the large new stock arrives. Year-round demand design linked to the venue’s event calendar looks set to be the next theme for the Makuhari trade area.
Summary
Tokyo Game Show 2026 runs a first-ever five days, from Thursday, September 17 to Monday, September 21 (holiday), with expected attendance of 300,000. The rooms available to absorb it number 14 properties and 4,532 rooms within 3km of Makuhari Messe, 103 properties and 13,984 rooms within 10km, and 304 properties and 36,738 rooms within 20km.
Booking progress at the 45-days-out fixed point runs +5.5 to +20.6pt above same-weekday normal days across Chiba Prefecture. The epicenter is Mihama Ward in Chiba City, closest to the venue, at +30.4 to +44.5pt, followed by Chuo Ward, Chiba City at +18.9 to +34.8pt, Funabashi City at +7.3 to +24.0pt, and Tokyo at +0.4 to +10.0pt — a clear gradient decaying with distance from the venue. That only the Chiba side is elevated on the weekdays of September 17 and 18, which carry no holiday factor, is what shows this movement to be event-driven.
By segment, city hotels respond earliest at +11.2pt from the first business day, while business hotels extend to +25.9pt on the public days. Resort hotels are near normal across the first two days and begin moving from the holiday band in the second half, at +15.6 to +16.5pt. The switch in the character of demand — corporate in the first half, leisure in the second — appears directly in the order in which segments respond. All of these are in-progress cross-sections taken more than a month before the event and will continue to move. The length of a five-day run offers an opportunity to address demand that differs day by day, rather than to design a single product.
⚠ Note on data for future dates: the estimated occupancy in this article, and the estimated settled ADR from August 2026 onward, are estimates based on sales inventory and prices published on OTAs at the time of the survey, and will shift as check-in dates approach. They are in-progress cross-sections taken more than a month before the event, not settled results.
Related Reading
- Kaihin-Makuhari 1,000-Room ¥30bn Mixed-Use: Breakeven ADR ¥13,200 — Absorption Capacity of Chiba’s Largest Pipeline
- Summer Sonic 2026: Hotel ADR Within 5km of Makuhari and Banpaku Runs +50% Above a Normal Friday — Reading the 25th-Anniversary Five-Day Waveform
- Silver Week 2026 Back Half at T-47: Sep 23 Matches a Normal Wednesday
- Chiba Settled ADR: H1 2026 Beats Last Year, July Turns −8.2% — Pricing for H2 2026 Read Through Settled-Month YoY
References and Sources
■ Primary event information
- Computer Entertainment Supplier’s Association, “Tokyo Game Show 2026 Confirmed” press release (March 2026)
- Nikkei XTREND, “The 30th-anniversary Tokyo Game Show runs five days, with 300,000 visitors expected [TGS2026]”
- Makuhari Messe, “Tokyo Game Show 2026” event information (dates, venue, business day / public day breakdown)
■ Market data
- MetroEngines Research — property and room aggregation based on confirmed OTA listings (within a 20km radius of Makuhari Messe, N=304 properties), estimated occupancy (booking curve, Chiba Prefecture, 741 properties / 48,348 rooms), and estimated settled ADR by municipality
■ Government statistics and public data
- Ministry of Land, Infrastructure, Transport and Tourism, “Building Construction Dynamic Statistics Survey” — planned hotel projects in Chiba Prefecture (groundbreaking and scheduled completion)