

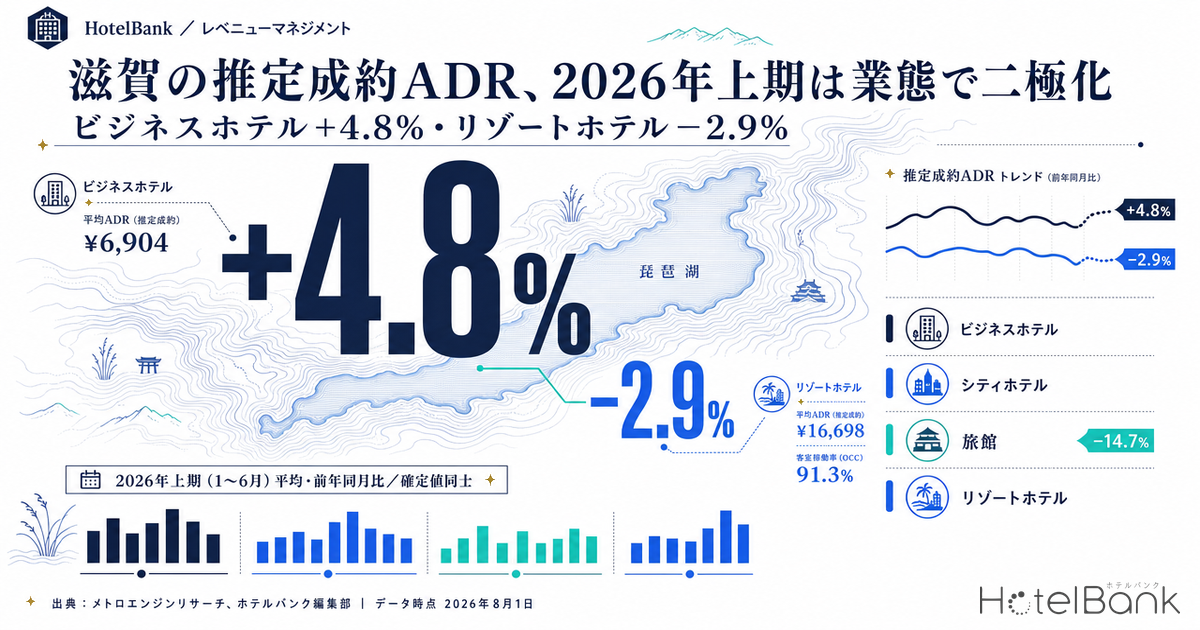
Shiga’s settled ADR estimates have moved in opposite directions by property category since the start of 2026. As of June 2026 — the most recent month for which finalized figures are available — business hotels stood at ¥6,904 (N=83 properties), up 4.4% year on year, and have exceeded the prior year in all 12 of the most recent finalized months. City hotels, by contrast, came in at ¥10,404 (N=12 properties), down 4.7%; ryokan at ¥12,050 (N=53 properties), down 14.7%; and resort hotels at ¥16,698 (N=11 properties), down 12.2% — three categories outside the room-only segment all falling below the prior year. Averaged across the first half of 2026 (January–June), business hotels gained 4.8% while city hotels fell 1.7% and resort hotels fell 2.9%. Within a single prefecture, the direction of rate trends has split cleanly down the middle. This article breaks down that structure using year-on-year comparisons between finalized months, and cross-checks it against what happened on the occupancy side in June.
Scope: city hotels (N=12 properties), business hotels (N=83), ryokan (N=53), and resort hotels (N=11) in Shiga Prefecture, all as of the June 2026 finalized figures. The price metric in this article is settled ADR estimate (the estimated transacted rate level derived from OTA and other sales data, pre-tax equivalent); occupancy is an estimate based on OTA-listed inventory. Full definitions appear at the end of the article. Data as of: August 1, 2026.
- — H1 2026 average year-on-year change: business hotels +4.8% and ryokan +4.3% versus city hotels −1.7% and resort hotels −2.9%. Within the same prefecture, rate direction has split by category.
- — Business hotels beat the prior year in all 12 finalized months from July 2025 through June 2026 (minimum +0.2%, maximum +18.7%). It is the lifting of trough months, not peak months, that is pushing up the full-year average.
- — June is a shoulder month that sits low in the annual range for all four categories. Ryokan’s −14.7% in June points the opposite way from their +4.3% H1 average — judging direction from a single month leads to misreading.
- — Estimated OCC for June 10–30, 2026 was high at 91.3% for resort hotels and 89.1% for ryokan. The categories whose rates fell by double digits are precisely the ones clearing inventory best — an inversion.
- — The within-week peak-to-trough spread is 13.7pt for city hotels and 12.4pt for business hotels, versus 5.2pt for ryokan and 6.8pt for resort hotels. The choppier the category, the more room there is for day-of-week pricing design.
In H1 2026, Shiga’s rates moved in opposite directions by category
Start with the big picture, using year-on-year comparisons between finalized months. Settled ADR estimates have a two-layer structure: past months are finalized values, while the current and future months are estimates based on the sales situation at the time of measurement. That means only combinations of finalized values can be used for year-on-year comparison. For Shiga, the most recent month with a complete set of finalized values is June 2026, and everything below compares finalized month against finalized month.
Line up the January–June 2026 year-on-year changes by category and business hotels are the only category positive in all six months. The swing runs from +0.2% (April) to +11.4% (January), but they never once fell below the prior year. City hotels, by contrast, opened the year in positive territory at +2.8% in January and +3.7% in February, then flipped to −6.7% in March, followed by −1.2% in April, −3.3% in May and −4.7% in June — four consecutive months below the prior year. Resort hotels turned even earlier, running five straight negative months from −6.8% in February to −12.2% in June. Ryokan have strong months — +22.6% in January, +8.7% in March, +7.1% in May — but also swing hard the other way with −2.3% in April and −14.7% in June, making them the most volatile shape among the four categories.
Source: MetroEngines Research; compiled by the HotelBank Editorial Team
One thing to keep in mind here is the character of June itself. In Shiga, all four categories post June settled ADR estimates that sit low within the annual range: city hotels’ ¥10,404 is the lowest of the six months in H1 2026, and ryokan’s ¥12,050 is likewise their H1 low. In other words, June is inherently a shoulder month where discounting takes hold easily, and the year-on-year decline happened to come out especially large in that month. To read relative strength across the year, overlaying the H1 average rather than a single month leaves less room for misinterpretation.
| Category | June 2026 (finalized) |
June 2025 (finalized) |
June YoY |
H1 2026 average |
H1 2025 average |
H1 YoY |
N (June 2026 / June 2025) |
|---|---|---|---|---|---|---|---|
| Business hotels | ¥6,904 | ¥6,610 | +4.4% | ¥7,160 | ¥6,830 | +4.8% | 83 / 82 |
| City hotels | ¥10,404 | ¥10,918 | −4.7% | ¥12,022 | ¥12,234 | −1.7% | 12 / 12 |
| Ryokan | ¥12,050 | ¥14,120 | −14.7% | ¥13,778 | ¥13,210 | +4.3% | 53 / 56 |
| Resort hotels | ¥16,698 | ¥19,019 | −12.2% | ¥19,580 | ¥20,163 | −2.9% | 11 / 11 |
Source: MetroEngines Research; compiled by the HotelBank Editorial Team
Re-sorted by H1 average, a different face emerges from the one June alone shows. Ryokan may have sunk 14.7% in June, but their H1 average of ¥13,778 is 4.3% above the prior year’s ¥13,210. January’s +22.6% is doing the work, and on a full-year earnings basis the category can be read as having improved over last year. City hotels are the reverse: the H1 average decline of 1.7% is smaller than June’s −4.7%, a shape in which the drop is weighted toward — and accelerating in — the latter part of the period. Resort hotels, at −12.2% in June and −2.9% for the H1 average, trace the classic pattern of a single month’s decline dragging down the average. Judging your own property’s position from a single month’s headline number risks getting the direction wrong. Note too that rate direction splitting by category is not unique to Shiga: the same breakdown applied across prefecture × category in Japan Hotel ADR Polarization 2026: 57.6pt Prefecture×Category Gap confirms the same type of divergence at the national level.
Business hotels beat the prior year in all 12 of the most recent finalized months
Of the four categories, business hotels are the only one tracing a consistent upward path. Comparing each of the 12 finalized months from July 2025 through June 2026 against the same month a year earlier, the minimum is +0.2% (April 2026) and the maximum is +18.7% (October 2025), with not a single negative month. From September through November 2025, double-digit gains ran three months in a row at +16.5%, +18.7% and +10.3%.
The level itself has stepped up year by year. Overlaying the years, 2024 stayed broadly within a ¥6,500–¥7,100 range throughout, whereas 2025 reached the ¥7,800s from September through November. In 2026 the track runs ¥6,984 in January, ¥6,682 in February, ¥7,337 in March, ¥7,378 in April, ¥7,672 in May and ¥6,904 in June — meaning that June, the seasonal trough, now sits 6.4% above the same month in 2024 (¥6,489). February (¥6,682) is still 2.3% below February 2024’s ¥6,837, but it has been lifted 3.4% from the most recent trough of ¥6,461 in February 2025. It is this raising of the floor at the trough that is pushing up the full-year average rate.
Source: MetroEngines Research; compiled by the HotelBank Editorial Team
A note on the supply side. Ten lodging facilities were confirmed to have opened in Shiga Prefecture in 2026, but only two of them have 10 or more guest rooms, and both are business hotels (44 rooms and 47 rooms). The remaining eight are guesthouses, vacation rentals, cottages and ryokan with 1–6 rooms. Since the observed business-hotel population totals roughly 6,400–6,600 rooms, those two additions amount to an increment in the low single-digit percentage range — around 1% on a room-count basis. It is reasonable to read the rate trajectory on the premise that the prefecture’s overall capacity for lodging demand has not surged over the past year.
The opening counts in this article are tallied on the basis of confirmed OTA listings. Only some properties are listed on OTAs before opening, and it is not uncommon for listings to appear after opening, so counts for the second half of 2026 onward may increase as further listings appear. Please read them alongside the construction-plan pipeline based on building confirmation applications (MLIT, “Statistical Survey on Building Construction“).
Source: MetroEngines Research (based on confirmed OTA listings, Shiga Prefecture N=10)
On the demand-entry side, Shiga’s rate ceiling depends heavily on how much proximity demand it can capture from Kyoto and Osaka. Both the area-level ADR and the supply picture around Lake Biwa point to the same conclusion: the prefecture functions as an overflow market for its larger neighbors, so shifts in Kyoto and Osaka pricing feed through to what Shiga properties can charge.
Meanwhile, the city hotel population held steady at 12 properties throughout the year; ryokan moved from 56 properties in June 2025 to 53 in June 2026; and resort hotels were flat at 11. The smaller the population in a category, the more readily a change in an individual property’s sales policy shows up in the aggregate — a premise worth holding onto when reading these numbers.
In a June when rates fell, what was happening on the occupancy side?
Whether occupancy also fell in the months when rates dropped below the prior year needs to be checked separately. Looking at estimated OCC (based on OTA-listed inventory) for June 2026 on a daily basis, ryokan and resort hotels in fact held at high levels. Averaged over the 21 days from June 10 to June 30, 2026 — the window where observation is stable — resort hotels came in at 91.3% and ryokan at 89.1%. Business hotels, by contrast, were at 83.4% and city hotels at 76.8%. In other words, the ryokan and resort categories whose rates fell by double digits year on year sat on the higher side in terms of inventory clearance.
Smoothing by day of week makes the shape of demand in each category clearer still. Business hotels peak on Thursday at 87.8% and trough on Sunday at 75.4%, a spread of 12.4 points. City hotels peak on Friday at 83.8% and trough on Sunday at 70.1%, a 13.7-point spread — the widest of the four categories. Ryokan, by contrast, peak on Saturday at 92.5% and trough on Tuesday at 87.3% for a spread of 5.2 points, while resort hotels run 95.6% on Saturday against 88.8% on Tuesday, a 6.8-point spread. Where the two room-only categories are heavy from weekdays into the first half of the weekend and thin on Sunday, ryokan and resort hotels peak on Saturday while the within-week choppiness itself stays shallow. A Sunday trough in the room-only categories is common to other prefectures as well, so Shiga’s 12.4-point business-hotel trough is best read as a moderate-to-deep example rather than an outlier.
Source: MetroEngines Research; compiled by the HotelBank Editorial Team
| Category | Mon | Tue | Wed | Thu | Fri | Sat | Sun | Period average | Properties observed |
|---|---|---|---|---|---|---|---|---|---|
| Business hotels | 80.7% | 83.0% | 86.8% | 87.8% | 83.1% | 87.1% | 75.4% | 83.4% | 70–75 |
| City hotels | 70.3% | 70.9% | 77.6% | 82.5% | 83.8% | 82.6% | 70.1% | 76.8% | 12 |
| Ryokan | 87.6% | 87.3% | 88.5% | 88.3% | 90.7% | 92.5% | 88.6% | 89.1% | 37–46 |
| Resort hotels | 90.1% | 88.8% | 89.5% | 90.1% | 93.3% | 95.6% | 91.4% | 91.3% | 9–11 |
Period covered: June 10–30, 2026 (21 days). Source: MetroEngines Research; compiled by the HotelBank Editorial Team
What this reveals is that “what the bottleneck is right now” differs by category. City hotels stay around 70% on Sunday, Monday and Tuesday, leaving unsold rooms in the first half of the week. With unsold inventory on hand and rates also below the prior year, June was a month that weakened on both the price and the occupancy front. Ryokan and resort hotels, on the other hand, hold in the high 80s even at their weekly trough, so in terms of inventory clearance there is little being left on the table. That their settled ADR estimates nonetheless fell by double digits year on year suggests the way price is being used to fill rooms may have changed from a year earlier. Aggregate figures also embed shifts in the mix of room types and meal plans sold, so no single factor can be assigned — but at minimum, the shape is not one that “rates fell because rooms did not sell” can fully explain.
Converting rate and occupancy onto a single yardstick — category scenarios and a two-axis grid
So far we have looked at settled ADR estimates (rate) and estimated OCC (inventory clearance) separately. The two can be aligned onto a single yardstick through the definitional multiplication estimated RevPAR equivalent = settled ADR estimate × estimated OCC. What follows is not a forecast: it is a re-expression, in the same units, of the June 2026 finalized rates and the measured June 10–30 occupancy already presented in this article. No new assumptions or external inputs are introduced.
| Category | Settled ADR estimate June 2026 finalized | Pessimistic weekly trough | Mid period average | Optimistic weekly peak | Trough → peak spread | Trough → average spread |
|---|---|---|---|---|---|---|
| Business hotels | ¥6,904 | ¥5,206 Sun 75.4% | ¥5,758 period avg 83.4% | ¥6,062 Thu 87.8% | ¥856 | ¥552 |
| City hotels | ¥10,404 | ¥7,293 Sun 70.1% | ¥7,990 period avg 76.8% | ¥8,719 Fri 83.8% | ¥1,426 | ¥697 |
| Ryokan | ¥12,050 | ¥10,520 Tue 87.3% | ¥10,737 period avg 89.1% | ¥11,146 Sat 92.5% | ¥626 | ¥217 |
| Resort hotels | ¥16,698 | ¥14,828 Tue 88.8% | ¥15,245 period avg 91.3% | ¥15,963 Sat 95.6% | ¥1,135 | ¥417 |
Source: MetroEngines Research; compiled by the HotelBank Editorial Team (converted from values published in this article)
What only becomes visible after conversion is how much money the day-of-week choppiness actually represents. The spread from the trough day to the peak day is ¥1,426 for city hotels and ¥856 for business hotels, against ¥626 for ryokan and ¥1,135 for resort hotels. Even though the rate level itself is two to three times higher at ryokan and resort hotels, the amount that moves within the week is larger for the two room-only categories. Priority for investing effort in day-of-week price and inventory design is set not by how high the rate is, but by how big the choppiness is.
For a more realistic target, look at the gain from lifting the trough day up to the 21-day average level: ¥697 for city hotels, ¥552 for business hotels, ¥217 for ryokan and ¥417 for resort hotels. City hotels were among the categories most exposed to headwinds, with June settled ADR estimates down 4.7% year on year — yet simply smoothing the early-week trough up to the period average leaves ¥697 per room on the table. Restoring rate and filling the trough can be compared on the same yardstick.
Two-axis grid for business hotels — five rate levels × five occupancy levels
For business hotels, we placed the five settled ADR estimate levels reported in this article for finalized months in 2026 on the vertical axis and the five measured occupancy levels for June 10–30, 2026 on the horizontal axis, and converted every combination into an estimated RevPAR equivalent. Both axes consist solely of measured values from inside the observed range; no extrapolation beyond the range has been performed. Yellow marks the actual June 2026 combination (¥6,904 × 83.4% = ¥5,758).
| Settled ADR estimate \ Estimated OCC | 75.4% Sun | 80.7% Mon | 83.4% period avg | 86.8% Wed | 87.8% Thu |
|---|---|---|---|---|---|
| ¥6,682 Feb 2026 | ¥5,038 | ¥5,392 | ¥5,573 | ¥5,800 | ¥5,867 |
| ¥6,904 Jun 2026 | ¥5,206 | ¥5,572 | ¥5,758 | ¥5,993 | ¥6,062 |
| ¥6,984 Jan 2026 | ¥5,266 | ¥5,636 | ¥5,825 | ¥6,062 | ¥6,132 |
| ¥7,337 Mar 2026 | ¥5,532 | ¥5,921 | ¥6,119 | ¥6,369 | ¥6,442 |
| ¥7,672 May 2026 | ¥5,785 | ¥6,191 | ¥6,398 | ¥6,659 | ¥6,736 |
Source: MetroEngines Research; compiled by the HotelBank Editorial Team (converted from values published in this article)
From end to end of the grid, the estimated RevPAR equivalent spans ¥5,038 to ¥6,736. What is worth noting is that the zone where raising occupancy by one step beats raising rate by one step, and the zone where the reverse holds, coexist within the same table. Starting from the June 2026 combination (¥5,758): step the rate down to the February trough (¥6,682) and, if occupancy is at the Thursday level (87.8%), the result is ¥5,867 — higher. Conversely, push the rate all the way up to the May peak (¥7,672) and, if occupancy is at the Sunday level (75.4%), it comes to only ¥5,785. How you handle the trough day is a decision of the same order of magnitude as a rate revision.
* This section is not a forward-looking outlook but a unit conversion of the measured values presented in this article. Because estimated OCC is based on OTA-listed inventory and reads higher than actual room occupancy, the estimated RevPAR equivalent should likewise be used for relative comparison across categories and days of the week rather than as an absolute level.
For revenue managers operating hotels and ryokan in Shiga — implications and an action plan
(1) Separate “the prefecture’s market is weak” from “my category is weak” first. Even within Shiga, the H1 2026 averages had business hotels up 4.8% and ryokan up 4.3% against the prior year, while city hotels were down 1.7% and resort hotels down 2.9%. Comparing your own property’s year-on-year change against the prefecture-wide average invites a mistaken assessment. Put the trend for your own category (the tables and charts in this article) on the yardstick first, and treat the deviation from that as your property-specific issue.
(2) The gap between the single-month decline and the H1 average tells you how “heavy” the decline is. Ryokan were at −14.7% in June against +4.3% for the H1 average, meaning the single-month drop points the opposite way from the full-year trend. Resort hotels, at −12.2% in June and −2.9% for the H1 average, show a single-month drop that is steadily eroding the average. Lining up the same two axes for your own property (year-on-year for the most recent finalized month / year-on-year for the H1 average) and checking whether the signs agree makes it easier to tell a one-off demand factor from a structural rate decline.
(3) Categories where occupancy stays high while rates fall are worth reviewing starting from how the price is being cut. Estimated OCC for June 10–30 was high at 89.1% for ryokan and 91.3% for resort hotels. Even at the weekly trough (Tuesday at 87.3% for ryokan, Tuesday at 88.8% for resort hotels) they sit in the high 80s. If even the trough day reaches that level, there is room to consider tightening the trigger conditions for discounts used to clear inventory. City hotels are the opposite case: at 70.1% on Sunday, 70.3% on Monday and 70.9% on Tuesday, the early week is clearly thin, and the structure is one where defending rate alone still leaves rooms unsold.
(4) The size of the day-of-week choppiness determines the granularity of your rate revisions. The peak-to-trough spread is 13.7 points for city hotels and 12.4 points for business hotels, versus 5.2 points for ryokan and 6.8 points for resort hotels. The choppier the category, the larger the day-to-day demand difference — and the larger the opportunity cost of keeping within-week settings uniform. In categories with shallow choppiness, effort is better spent on monthly or seasonal range design than on the day of week.
| Time horizon | Action | Decision trigger | Objective |
|---|---|---|---|
| Today–this week | Place your property’s June 2026 result alongside the finalized value for the same category (business ¥6,904 / city ¥10,404 / ryokan ¥12,050 / resort ¥16,698) and confirm where you stand | If your June rate falls below the finalized value for the same category | Separate “the whole market is weak” from “only my property is weak” at the outset |
| Today–this week | Line up the year-on-year change for the most recent finalized month and for the H1 average on two axes and check whether the signs agree | If the signs diverge, as with ryokan’s June −14.7% versus H1 +4.3% | Avoid confusing a single-month demand factor with a structural rate decline |
| Within two weeks | Map out the inventory-and-price combination for the thinnest day of the week | If your property has a day as thin as Sunday in the room-only categories (business 75.4% / city 70.1%) | Match the granularity of price and inventory to day-of-week demand differences |
| Within two weeks | Write out and take stock of the trigger conditions for discount measures (remaining-room thresholds, timing of activation) | If discounts fire automatically even at high clearance levels such as ryokan 89.1% or resort 91.3% | Confirm you are not applying unnecessary discounts to inventory that would fill anyway |
| Looking to next month | Mark “trough months” explicitly on the rate revision calendar and decide the floor range for the trough in advance | If June is also your property’s cheapest month in H1 (in the market, June is the H1 low for both city hotels and ryokan) | Prevent the shoulder-season floor from falling below the prior year before it happens |
| Looking to next month | Adopt the business-hotel pattern of “lifting the trough” (June 2026’s ¥6,904 sits 6.4% above June 2024’s ¥6,489) into the target setting for your own trough months | If your trough-month rate remains at or below the level of the same month two years earlier | Lift the full-year average through improvement in trough months rather than peak months |
Source: MetroEngines Research; compiled by the HotelBank Editorial Team
Note that settled ADR estimates for July 2026 onward are estimates based on the sales situation at the time of measurement, and rest on a different basis from finalized values. It is safer to avoid using them as evidence for year-on-year judgments and to wait for month-end finalization before evaluating them.
Summary — three yardsticks for reading Shiga
Yardstick 1: Do not mix categories. H1 2026 averages: business hotels +4.8%, ryokan +4.3%, city hotels −1.7%, resort hotels −2.9%. A prefecture-level “average” is nothing more than four series pointing in different directions, added up and divided. Set your evaluation axis on the series for your own category.
Yardstick 2: Always place the single month next to the H1 average. Ryokan: −14.7% in June versus +4.3% for H1. Resort hotels: −12.2% in June versus −2.9% for H1. Even for the same “double-digit negative June,” the relationship to the full-year trend is entirely different. Look at only one and you will choose the wrong move.
Yardstick 3: Read occupancy and rate as a set. Estimated OCC for June 10–30 was high at 91.3% for resort hotels and 89.1% for ryokan, while city hotels’ 76.8% left rooms unsold in the early week (Sun 70.1%, Mon 70.3%, Tue 70.9%). Even in a month when rates fell, the prescription is the exact opposite depending on whether the rooms are filling or not.
And one more thing: the fact that business hotels beat the prior year in all 12 of the most recent finalized months shows that in this market it is the lifting of trough months, not the surge of peak months, that moves the full-year average. June 2026’s ¥6,904 sits 6.4% above June 2024’s ¥6,489, and February’s ¥6,682 has been lifted 3.4% from February 2025’s ¥6,461 (though it still falls short of February 2024’s ¥6,837). The view that how far you can lift the trough determines next year’s average rate is worth considering regardless of category.
About the data
・Definition of estimated OCC (based on OTA-listed inventory): OTA-listed-inventory occupancy rate = 100 − 100 × number of rooms remaining on OTAs ÷ total rooms. It is an estimate based on the clearance of inventory sold on OTAs, and differs in definition from actual room occupancy (it reads higher). The month and observation window covered in this article are June 10–30, 2026 (21 days).
・Booking curve: based on observations from 90 days before the stay date up to the most recent point (the day before). The estimated OCC in this article uses the value at the final observation point for each stay date.
・Definition of settled ADR estimate: the estimated transacted rate level (pre-tax equivalent) derived from OTA and other sales data (lowest-plan level × category-specific coefficients, ensembled across multiple channels). Past months are finalized values; current and future months are estimates based on the sales situation at the time of measurement. Median error of 6.6% when reconciled against published operating results. All year-on-year comparisons in this article are made between finalized values.
・Breakdown of N: for settled ADR estimates, Shiga Prefecture city hotels N=12 properties (both June 2025 and June 2026); business hotels N=82 properties (June 2025) / N=83 properties (June 2026); ryokan N=56 properties (June 2025) / N=53 properties (June 2026); resort hotels N=11 properties (both June 2025 and June 2026). For estimated OCC, the number of properties observed over the same period was 70–75 for business hotels, 12 for city hotels, 37–46 for ryokan and 9–11 for resort hotels. The opening data covers the 10 properties confirmed to have opened in Shiga Prefecture in 2026.
・Data as of: August 1, 2026. Sales conditions and inventory change daily, so the figures in this article are a snapshot as of the time of retrieval.
References and sources
■ Data sources
Settled ADR estimates and the number of properties in each aggregate (N) come from monthly aggregates for each of the city hotel / business hotel / ryokan / resort hotel categories in Shiga Prefecture (January 2024 – June 2026, finalized values). Estimated OCC (based on OTA-listed inventory) comes from daily aggregates by category for the same prefecture (June 2026, using the 21 days from June 10 to June 30 where observation is stable). Opening counts come from new-opening data for Shiga Prefecture based on confirmed OTA listings (2026, 10 properties). All are compiled by MetroEngines Research. The reference for the construction-plan pipeline is MLIT’s “Statistical Survey on Building Construction” (statistics page).
■ Calculation assumptions
Year-on-year changes and H1 averages are calculated solely from combinations of finalized values (past months). The H1 average is the simple average of the monthly settled ADR estimates for January–June 2026 and January–June 2025 respectively. Day-of-week estimated OCC is the simple average of the 21 days covered, grouped by day of week. The estimated RevPAR equivalent in the section “Converting rate and occupancy onto a single yardstick” is calculated solely from the definitional identity settled ADR estimate × estimated OCC, and each rate and occupancy level is selected from within the measured values presented in the body text and tables of this article (no extrapolation beyond the range and no forecasting have been performed).
■ Limitations and caveats
Settled ADR estimates carry a median error of 6.6% when reconciled against published operating results and will not match the results of any individual property. Estimated OCC is based on OTA-listed inventory and therefore reads higher than actual room occupancy. Accordingly, the estimated RevPAR equivalent should be used for relative comparison across categories and days of the week rather than as an absolute level. The aggregation populations range from 11 to 83 properties depending on category, and in categories with small populations such as city hotels (N=12) and resort hotels (N=11), a change in an individual property’s sales policy is readily reflected in the aggregate. Opening counts are based on confirmed OTA listings; because only some properties are listed on OTAs before opening, counts for the second half of 2026 onward may increase. Figures are a snapshot as of August 1, 2026, and sales conditions and inventory change daily.