

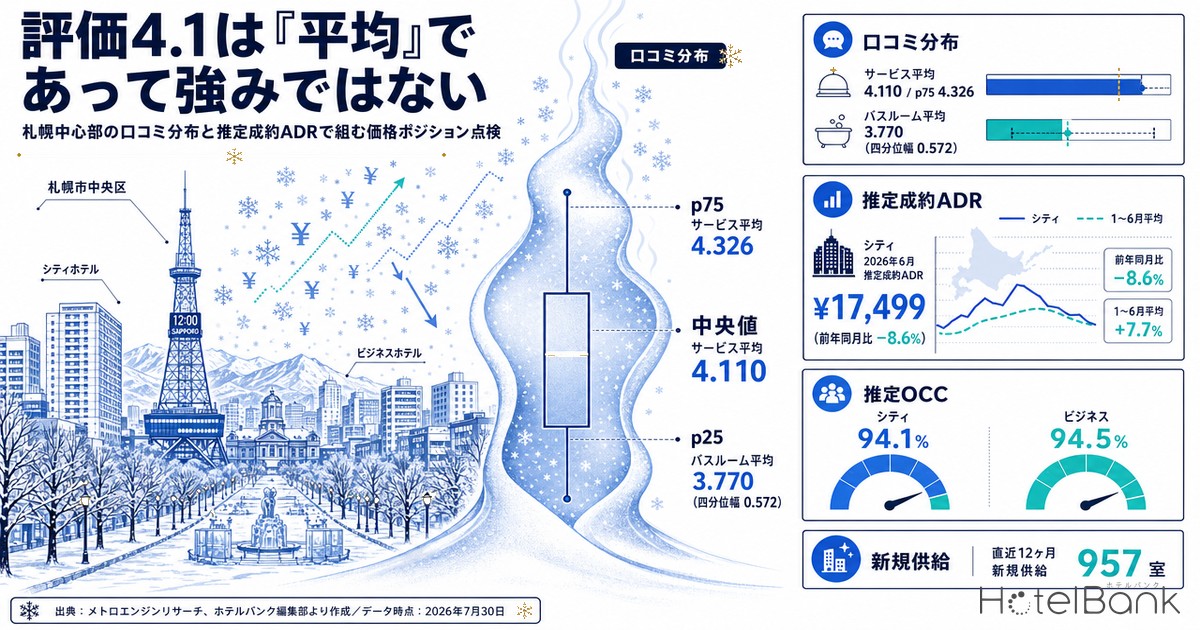
Cross-referencing the last 24 months of guest-review score distributions against estimated settled ADR for accommodations in central Sapporo (Chuo Ward, Sapporo) brings a familiar revenue-management problem into sharp focus: “our reviews are fine, so why can’t we raise rates?” In Chuo Ward, the Service category averages 4.110 with a median of 4.150 — but the top-quartile boundary (p75) sits at 4.326. In other words, “4.1” is the middle of this market, not the threshold for entering its upper tier. On the price side, city hotels posted an estimated settled ADR of ¥17,500 in June 2026 (N=26 properties), down 8.6% year on year, while business hotels came in at ¥13,300 (N=102 properties), down 3.5%. Yet averaged across January through June, city hotels are up 7.7% and business hotels up 8.4% against the prior year. Move price without first confirming where your property actually sits in the review distribution, and you will misread this two-faced pattern — positive across the first half, negative in the most recent months.
Scope: city hotels and business hotels in Chuo Ward, Sapporo, Hokkaido — N=26 properties (city) and N=102 properties (business); review distributions cover up to N=105 properties and 236,751 reviews in Chuo Ward. Price figures in this article are estimated settled ADR (a settled price level inferred from OTA and other sales data, tax-exclusive equivalent); occupancy is an estimate based on OTA-listed inventory. Full definitions appear at the end of the article. Data as of July 30, 2026.
- — A Service score of 4.110 is mid-pack in Chuo Ward, Sapporo. The top-quartile boundary (p75) is 4.326, so “4.1” is no basis for a price premium.
- — Bathroom averages 3.770, the lowest of the 10 categories. Its interquartile range of 0.572 is also the widest — the area where operator action moves your position in the distribution most.
- — City hotels in Chuo Ward saw June 2026 estimated settled ADR fall 8.6% year on year. Yet the January–June average is up 7.7% — the single month and the half-year total point in opposite directions.
- — Estimated OCC across Hokkaido that same month was 94.1% for city hotels and 94.5% for business hotels. Listed inventory is selling through, so the rate decline is not slack demand. That said, 957 rooms of new supply have entered over the last 12 months.
- — Prioritize weaknesses by level and dispersion together, not simply by lowest score. Staff, with an interquartile range of 0.296, is hard to move within the distribution even when it improves.
“4.1” Is the Average, Not a Strength — Reading Review Position Through the Distribution
When review scores come up in an operations meeting, most teams work from their own property’s average alone. Numbers line up — “Service 4.1,” “Room 4.0” — and the conversation turns on whether the figure rose or fell 0.02 from last month. What revenue management actually needs, however, is not the absolute value but the relative position: where the property stands within the distribution of the same trade area. Price is set by relative standing in a market. Whether a strong review score translates into guests feeling the room rate was justified is a separate question — and one that only becomes tractable once that relative position is clear.
Aggregating Chuo Ward review scores across 10 categories shows that the distance between the average and the top-quartile boundary (p75) varies widely by category. Service averages 4.110 with a median of 4.150, a p25 of 4.001 and a p75 of 4.326. Its interquartile range — the span from p25 to p75 — is 0.325, the second narrowest of the 10 categories after Staff (0.296). Service scores, in other words, are tightly bunched across the whole market: drop below 4.0 and you fall clearly into the bottom quartile, while clearing 4.33 is what it takes to reach the top quartile. Within that distribution, “4.1” is squarely the middle, and no basis for a price premium.
The categories where the gap to the top tier is widest — setting aside Bathroom (0.572), discussed below — are Meals (interquartile range 0.516), Facilities (0.507) and Breakfast (0.494). Execution differs sharply from property to property in these areas, so breaking into the upper tier creates a visible separation within the distribution. The highest-scoring categories in Chuo Ward are Location (average 4.242) and Staff (4.238), which reflects both the nature of a central Sapporo trade area and a degree of standardization in face-to-face service operations.
Source: MetroEngines Research; compiled by the HotelBank Editorial Team
| Review category | Average | Median | p25 | p75 | Interquartile range | Properties | Reviews |
|---|---|---|---|---|---|---|---|
| Location | 4.242 | 4.268 | 4.073 | 4.465 | 0.392 | 102 | 40,827 |
| Staff | 4.238 | 4.253 | 4.140 | 4.436 | 0.296 | 90 | 11,777 |
| Amenities | 4.165 | 4.238 | 4.000 | 4.385 | 0.385 | 64 | 4,270 |
| Cleanliness | 4.155 | 4.190 | 4.009 | 4.429 | 0.420 | 95 | 23,700 |
| Breakfast | 4.148 | 4.197 | 3.904 | 4.398 | 0.494 | 82 | 9,133 |
| Meals | 4.131 | 4.138 | 3.913 | 4.429 | 0.516 | 73 | 5,926 |
| Service | 4.110 | 4.150 | 4.001 | 4.326 | 0.325 | 104 | 48,750 |
| Room | 4.101 | 4.161 | 3.928 | 4.357 | 0.429 | 105 | 50,627 |
| Facilities | 4.013 | 4.071 | 3.778 | 4.285 | 0.507 | 90 | 19,841 |
| Bathroom | 3.770 | 3.812 | 3.506 | 4.078 | 0.572 | 94 | 21,900 |
Review aggregation for Chuo Ward, Sapporo over the last 24 months. Source: MetroEngines Research; compiled by the HotelBank Editorial Team
Bathroom Ranks Last — and Carries the Widest Dispersion
Of the 10 categories, Bathroom scores lowest in Chuo Ward, averaging 3.770 with a median of 3.812. The gap to the second-lowest category, Facilities (4.013), is more than 0.24. At the same time its interquartile range is the widest at 0.572, with p25 at 3.506 and p75 at 4.078. A 0.57-point spread between the bottom and top quartiles means this is the one category where the pattern is not “the whole market scores low” but rather “differences in execution between properties translate directly into score differences.”
The same shape holds across Hokkaido as a whole. For the prefecture (N=726 properties, 118,034 reviews), Bathroom averages 3.906 — last of the 10 categories — with an even wider interquartile range of 0.806. Chuo Ward sits slightly below the prefectural level (3.770) yet with less dispersion than Hokkaido overall, which reads as central-Sapporo properties converging on broadly similar facility specifications.
This is the crux of a price-position review. Categories that are both low-scoring and widely dispersed offer the largest movement within the distribution when improved. Conversely, in tightly bunched categories such as Service or Staff, the same effort barely shifts your position. Rather than the generic instruction to “fix your weaknesses,” the useful question is which weakness, once fixed, actually moves you within the distribution.
| Low dispersion (IQR 0.42 or below) | High dispersion (IQR above 0.42) | |
|---|---|---|
| High level (average 4.14 or above) |
Maintain Location 4.242 / 0.392; Staff 4.238 / 0.296; Amenities 4.165 / 0.385; Cleanliness 4.155 / 0.420 Prioritize holding the current level over additional investment. |
Extend the advantage Breakfast 4.148 / 0.494 Already on the upper side. Breaking higher creates clear separation within the distribution. |
| Low level (average below 4.14) |
Hard to move Service 4.110 / 0.325 The market is tightly bunched; effort here barely shifts your position in the distribution. |
Top priority for action Bathroom 3.770 / 0.572; Facilities 4.013 / 0.507; Room 4.101 / 0.429; Meals 4.131 / 0.516 Low scoring, and execution differences show up directly in the score. The largest movement per unit of improvement. |
Each cell shows “average / interquartile range.” Thresholds are the medians of the 10 Chuo Ward categories for average and interquartile range respectively (4.14 / 0.42). Source: MetroEngines Research; compiled by the HotelBank Editorial Team
Where Price Stands — Above Last Year for the Half, Below It for the Last Three Months
Viewed month by month, estimated settled ADR in Chuo Ward, Sapporo shows two faces across the first half of 2026. From January to March, city hotels ran well ahead of the prior year: +28.8% in January, +16.1% in February and +16.8% in March. Business hotels moved the same way at +26.1%, +5.6% and +17.0%. From April, the direction reversed: city hotels fell 8.9% in April, 2.8% in May and 8.6% in June. Business hotels held on at +6.3% in April and +4.4% in May before dropping to −3.5% in June.
Averaged over January to June, city hotels rose from ¥17,400 to ¥18,700, up 7.7%, and business hotels from ¥12,300 to ¥13,400, up 8.4%. As a summary of the period, that is ahead of last year. Take only the most recent three months, however, and the trend looks downward. That divergence is a product of Sapporo’s seasonal structure itself, which hinges on how strong the winter demand peak (January–February) turns out to be. Reading June’s year-on-year decline as “the market has weakened” means overlooking what was banked in the first half.
The shape of the season is worth confirming too. Among the finalized months of 2026, city hotels peaked at ¥29,400 in February and bottomed at ¥10,900 in April — a 2.7× spread within the same trade area and the same category, purely by month. That swing is the argument against running a pricing calendar as “the same procedure every month”: February and April call for entirely different decisions.
Source: MetroEngines Research; compiled by the HotelBank Editorial Team
Source: MetroEngines Research; compiled by the HotelBank Editorial Team
| Month | City 2025 | City 2026 | YoY | Business 2025 | Business 2026 | YoY |
|---|---|---|---|---|---|---|
| January | ¥16,628 | ¥21,424 | +28.8% | ¥11,199 | ¥14,120 | +26.1% |
| February | ¥25,294 | ¥29,374 | +16.1% | ¥19,211 | ¥20,286 | +5.6% |
| March | ¥14,093 | ¥16,461 | +16.8% | ¥10,045 | ¥11,756 | +17.0% |
| April | ¥11,998 | ¥10,926 | −8.9% | ¥7,802 | ¥8,296 | +6.3% |
| May | ¥17,269 | ¥16,782 | −2.8% | ¥11,990 | ¥12,519 | +4.4% |
| June | ¥19,155 | ¥17,499 | −8.6% | ¥13,832 | ¥13,342 | −3.5% |
| Jan–Jun average | ¥17,406 | ¥18,744 | +7.7% | ¥12,346 | ¥13,386 | +8.4% |
Chuo Ward, Sapporo — estimated settled ADR (finalized months compared with finalized months). City hotels N=25–26 properties; business hotels N=100–103 properties. Source: MetroEngines Research; compiled by the HotelBank Editorial Team
A wider comparison is worth adding. For Hokkaido as a whole, June 2026 estimated settled ADR was ¥14,800 for city hotels (N=75 properties) and ¥9,500 for business hotels (N=429 properties), putting Chuo Ward at roughly 1.2× and 1.4× those levels respectively. A central location is clearly being priced in — yet the Location review score in Chuo Ward (4.242) is barely different from the Hokkaido average (4.210). That reads as a location advantage already embedded in price: capturing any additional premium requires raising your position in the distribution in categories other than location.
How Tight Is Demand — Estimated OCC for June 2026
Reviewing a price position requires reading the demand side as well: is it loosening or tightening? For Hokkaido as a whole in June 2026, estimated OCC (based on OTA-listed inventory) averaged 94.1% for city hotels over the month (30 days covered, N=70–74 properties) and 94.5% for business hotels (30 days covered, N=372–391 properties). Restricting the average to days with observation coverage of 80% or higher gives 94.6% for city hotels (25 days) and 96.0% for business hotels (16 days) — high levels throughout either way.
June’s below-prior-year estimated settled ADR, then, was not the result of unsold inventory. Listed inventory was clearing at a high rate, and rates still fell short of the prior year. Occupancy holding up while rate fails to follow is, in textbook revenue-management terms, the classic signature of a market with room left to raise price. Whether that reading holds, however, depends on how much new inventory entered the market over the same period — the subject of the next section. Note also that this estimated OCC is an inference from how listed inventory is being consumed and is defined differently from actual room occupancy (it runs high). Treat it not as a direct comparison against your own actual occupancy, but as an indicator of whether market inventory is tightening or loosening.
Checking the Supply Side — Don’t Explain a Rate Decline by Demand Alone
When occupancy stays high but rate falls below the prior year, there is a second variable to check beyond slack demand: how many rooms of new inventory entered the same trade area. Over the last 12 months (July 2025 to June 2026), 10 properties totaling 1,270 rooms with “Sapporo” in the property name were observed opening. Of those, seven properties and 957 rooms fall into the two categories whose prices this article examines — city and business hotels (six business-hotel properties with 785 rooms, one city-hotel property with 172 rooms). The timing was not even: six properties and 847 rooms clustered into October–December 2025, with a further two properties and 221 rooms added in June 2026.
Against a base of N=26 city-hotel properties and N=102 business-hotel properties in Chuo Ward, the 957 rooms added over 12 months is not a negligible quantity. Even with listed inventory clearing at a high rate, a growing denominator pulls the market-wide average rate toward the price band of whatever has newly entered. The June 2026 picture — high occupancy, rate below the prior year — may therefore be as much a compositional shift driven by new supply as it is the flip side of room to raise price.
| Period | Properties | Rooms | Of which city/business |
|---|---|---|---|
| Jul–Sep 2025 | 1 | 84 rooms | 1 property / 84 rooms |
| Oct–Dec 2025 | 6 | 847 rooms | 5 properties / 698 rooms |
| Jan–Jun 2026 | 3 | 339 rooms | 1 property / 175 rooms |
| Last 12 months, total | 10 | 1,270 rooms | 7 properties / 957 rooms |
| July 2026 onward (including planned) | 3 | 560 rooms | 1 property / 223 rooms |
Source: MetroEngines Research; compiled by the HotelBank Editorial Team
In practice, the diagnostic goes like this. If your occupancy is as high as the market’s and only your rate trails the prior year, there is a good chance room to raise price remains. If your occupancy itself has fallen year on year, that is a sign new openings are taking room nights from you, and the first thing to address is not price but distribution channels and the rebuilding of your review position. With a further three properties and 560 rooms due from July 2026 onward, this distinction becomes more important heading into the second half.
For Revenue Managers Running City and Business Hotels in Central Sapporo — Implications and an Action Plan
(1) Benchmark your scores against p75, not against the average
In Chuo Ward, Service averages 4.110 with a p75 of 4.326; Room averages 4.101 with a p75 of 4.357. If your property is in the 4.1 range, you are in the middle of the market, not the upper tier. To position price in the upper part of the market, start by laying out on a single sheet whether each of your categories clears p75. Holding upper-tier pricing without a single category above that line suggests review-driven booking acquisition is under strain.
(2) Pick weaknesses by widest dispersion, not by lowest score
Bathroom is the lowest-scoring category in Chuo Ward at 3.770 — and simultaneously carries the widest interquartile range at 0.572. Wide dispersion means operator action shows up in the score. Staff (0.296) and Service (0.325), by contrast, are tightly bunched across the market, so improvement barely shifts your position in the distribution. Both metrics are worth reading side by side when sequencing improvement investment.
(3) Close weak categories with experience before price, in that order
Raising rate alone while Bathroom scores sit in the lower tier sends the gap between price and experience straight back into your reviews. Even where a full facility renovation is out of reach, operational variables — the quality of consumables, cleaning procedures, inspection frequency for hot water and plumbing — move faster than a pricing cycle. The order to hold: put the experience-side fixes in first, and consider an upward price revision once their effect begins to show in the review distribution. How a rate increase feeds back into review satisfaction is an empirical question worth testing on your own property rather than assuming.
(4) Don’t rewrite your annual view off a single weak June
City hotels in Chuo Ward were down 8.6% in June but up 7.7% on the January–June average; business hotels were down 3.5% in June but up 8.4% for the half. And estimated OCC across Hokkaido in June 2026 was high — 94.1% for city hotels and 94.5% for business hotels. A single soft month and slack demand are different things. Build the pricing calendar around the seasonal swing — ¥29,400 in February against ¥10,900 in April — rather than around month-to-month moves.
| Horizon | Action | Decision trigger (checked against figures in this article) | Objective |
|---|---|---|---|
| Today to this week | Build a one-page table overlaying your 10 category scores on the market’s three reference lines: p25, median and p75 | Service 4.001 / 4.150 / 4.326; Room 3.928 / 4.161 / 4.357; Bathroom 3.506 / 3.812 / 4.078. Three or more categories below all three lines warrants attention | Establish a shared view of relative position before opening the pricing discussion |
| Today to this week | Compare your recent actual ADR against the market level | If your June 2026 actuals fall below Chuo Ward’s estimated settled ADR (city ¥17,499 / business ¥13,342) and you hold at least one category above p75, an upward revision is worth examining | Identify room to raise price that your review scores actually support |
| Within two weeks | Inventory the operational variables that move Bathroom scores (consumables, cleaning procedures, plumbing inspection frequency) and start with whatever turns faster than the pricing cycle | Top priority if your Bathroom score sits below Chuo Ward’s p25 of 3.506. An interquartile range of 0.572 indicates operator action shows up in the score | Start where movement within the distribution is largest |
| Within two weeks | Put additional investment in Service and Staff on hold and switch to maintaining the current level | Interquartile ranges are narrow — Staff 0.296, Service 0.325. If you already clear the market medians (4.253 / 4.150), maintaining may beat adding | Limit effort spent on areas that won’t move |
| Looking to next month | Rebuild the pricing calendar around the seasonal swing | Chuo Ward city hotels ran ¥29,374 in February 2026 against ¥10,926 in April — a 2.7× spread within one trade area. Check whether you are applying the same revision rule to every month | Switch to different decisions for peak and trough |
| Looking to next month | Shift to evaluating your performance on a half-year cumulative basis rather than single-month year-on-year | The market was down 8.6% (city) and 3.5% (business) in June alone, yet up 7.7% and 8.4% on the January–June average. Check that you are not cutting price in reaction to a single month’s decline | Keep short-term noise from breaking the annual rate strategy |
Source: MetroEngines Research; compiled by the HotelBank Editorial Team
Summary — Three Yardsticks to Take Away
Yardstick 1: Read scores by percentile, not by average
Service in Chuo Ward, Sapporo averages 4.110, but p75 is 4.326. “4.1” is the middle of the market, not a strength. List where each of your categories sits against p25, the median and p75, and the debate over raising or cutting price shifts from intuition to relative position.
Yardstick 2: Select weaknesses on two axes — how low and how dispersed
Bathroom, the lowest category in Chuo Ward (average 3.770), also carries the widest interquartile range at 0.572, so operator action registers in your position within the distribution. Staff (0.296) and Service (0.325), by contrast, are densely packed markets where the same effort barely moves you.
Yardstick 3: Separate a single month’s year-on-year from the annual picture
City hotels in Chuo Ward were down 8.6% year on year in June 2026, yet up 7.7% on the January–June average. Estimated OCC across Hokkaido that month was high as well, at 94.1% for city hotels and 94.5% for business hotels. A market where occupancy is tight but rate trails the prior year is not a reason to cut price. Given that 957 rooms of new supply (city and business categories) entered over the last 12 months, however, use your own occupancy trend to separate room-to-raise-price from a compositional shift driven by new supply — then line up the review evidence before considering an upward revision.
About the Data
■ Data sources
All figures in this article are based on aggregated data from MetroEngines Research (observation series of publicly listed OTA prices and inventory, plus aggregated guest reviews). No third-party statistics or estimates are used. Counts of new openings and rooms were compiled from the same dataset, covering accommodations first observed in the relevant year whose property name contains “Sapporo.”
・Definition of estimated OCC (based on OTA-listed inventory): occupancy based on OTA-listed inventory = 100 − 100 × rooms remaining on OTA listings ÷ total rooms. It is an estimate derived from how inventory offered on OTAs is consumed, and is defined differently from actual room occupancy (it runs high). The scope in this article is Hokkaido as a whole for June 2026, broken out by city and business hotel category.
・Booking curve: based on observations from 90 days before the stay date up to immediately before the stay date (the estimated OCC in this article uses the value at the final observation point for each stay date).
■ Calculation assumptions
・Definition of estimated settled ADR: a settled price level (tax-exclusive equivalent) inferred from OTA and other sales data (lowest-plan price level × category-specific coefficient, ensembled across multiple channels). Past months are final; the current and future months are estimates based on present sales conditions. Cross-checking against published operating results gives a median error of 6.6%. All year-on-year comparisons in this article are finalized month against finalized month; values from July 2026 onward are estimates based on present sales conditions and may change. Wait for month-end finalization before comparing them directly with final values.
・Breakdown of N: estimated settled ADR — Chuo Ward, Sapporo city hotels N=25–26 properties (varies by month) and business hotels N=91–104 properties (varies by month; for June 2026, city N=26 properties and business N=102 properties); Hokkaido overall city N=75 properties and business N=429 properties (both as of June 2026). Review score distribution — Chuo Ward, Sapporo N=64–105 properties and 236,751 reviews in total; Hokkaido overall N=216–907 properties (varies by category), aggregating reviews from the last 24 months. Estimated OCC — Hokkaido overall city N=70–74 properties and business N=372–391 properties.
■ Limitations and caveats
Estimated OCC is an inference from how listed inventory is consumed and runs higher than actual room occupancy. Estimated settled ADR carries a median error of 6.6% when cross-checked against published operating results. Review scores are not adjusted for differences in respondent composition between properties, so they are better suited to reading relative position within the distribution than to comparing absolute levels across categories. No individual property is named. Note too that the geographic scope differs by metric: estimated settled ADR and the review score distribution cover Chuo Ward, Sapporo, while estimated OCC is aggregated for Hokkaido as a whole — estimated OCC for Chuo Ward alone is not calculated, given the granularity of the source data. Estimated OCC is used here to read the direction of whether market inventory is tightening or loosening, not to indicate the occupancy level of Chuo Ward itself. In addition, the tally of new openings is limited to properties whose name contains “Sapporo,” so properties that do not carry the city name are not counted, while re-observation caused by rebrands or category changes is included as new. Supply growth measured in actual rooms may therefore differ from these figures.
・Data as of July 30, 2026. Sales conditions and inventory change daily, so the figures in this article are a snapshot at the time of retrieval. Note also that the review score distribution covers the last 24 months as of the July 1, 2026 update, a different reference date from the price and inventory metrics.