

“Business travel picks up at the end of the fiscal first half, so you can price late-September weekdays aggressively.” This rule of thumb has circulated on hotel floors in Japan for years. The reasoning is that budget-spending trips cluster around the half-year close, and that year-end processing increases traffic between headquarters and regional offices. Yet few have tested the assumption against daily data. This article examines five business-travel cities — Sapporo, Sendai, Nagoya, Osaka and Fukuoka — to see whether a genuine demand peak actually forms on the final three business days of September, using observed 2024 and 2025 results alongside the in-progress booking pace for 2026.
Metric Definitions Used in This Article
- Listed price: the average selling price each property publishes on OTAs and similar channels (double occupancy, per room, tax included, averaged across all plans). It differs from the price actually transacted. All daily comparisons in this article are on this listed-price basis, not ADR.
- ADR (average daily rate): an estimated settled rate (tax-exclusive equivalent) calculated by applying category-specific adjustment coefficients to the lowest published plan level at each property (double occupancy, per room, tax included). Cross-checked against property-level disclosures from listed hotel REITs, the median error is roughly 7%. It is an estimate and differs from each property’s actual transacted prices and accounting figures. Area-level ADR is the median across the properties covered.
- OCC (occupancy rate): sold rooms as a share of total rooms in the area (an estimate based on OTA-published inventory). Used here only as a macro indicator at the prefecture level.
- LT (lead time): days remaining until the check-in date. LT0 = same day.
- Data source: MetroEngines Research
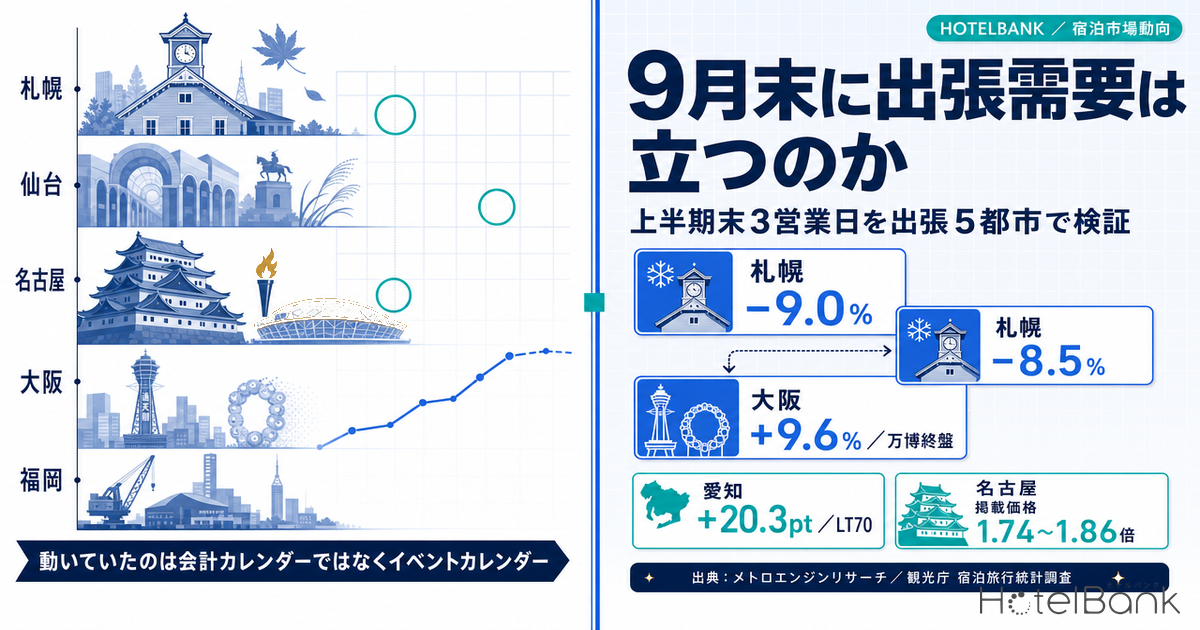
- — No fiscal half-end effect in four of five cities — comparing the final three business days of September with same-weekday ordinary weekdays on a paired same-property basis, no lift attributable to the accounting close was observed in either 2024 or 2025.
- — Sapporo was negative two years running (-9.0% in 2024, -8.5% in 2025). The seasonal structure of summer demand receding through the second half of September outweighs any half-end business demand.
- — The single upside case, Osaka 2025 at +9.6%, was the closing phase of the World Expo — it coincided with the last-minute visitor rush ahead of the October 13 closing, and needs to be recorded separately from any half-end effect.
- — Aichi in 2026 is +19.3 to +20.3pt (LT60/70/80 snapshots). Those dates fall inside the Asian Games window (September 19 – October 4), so the event and the fiscal close cannot be separated.
- — The primary input for pricing is the event calendar, not the accounting calendar — drop the assumption of a half-end premium and shift judgment to pace comparisons aligned on event window, day of week and lead time.
Start by questioning the calendar — September 28–30 is not a set of weekdays every year
Before any analysis, the calendar itself needs checking. If “the final three days of the half” is fixed as September 28–30, those dates are not even weekdays in some years. In 2024, September 28 was a Saturday and the 29th a Sunday, leaving Monday the 30th as the only weekday. In 2025, September 28 was a Sunday, the 29th a Monday and the 30th a Tuesday. The only year in which all three days line up as weekdays is 2026 (Monday the 28th, Tuesday the 29th, Wednesday the 30th).
A date-fixed comparison therefore does not hold. This article redefines the subject as “the final three business days of September” and aligns the control days to ordinary weekdays falling on the same day of the week. September contains Respect for the Aged Day and the Autumnal Equinox, and in 2026 September 21–23 forms a three-day weekend (Silver Week), so all control days were chosen from the first and second weeks to avoid that cluster of public holidays.
| Year | Final three business days of September (subject) | Control days (same weekday, ordinary weekday) | Public holidays in September |
|---|---|---|---|
| 2024 | Sep 26 (Thu), Sep 27 (Fri), Sep 30 (Mon) | Thu = Sep 5, 12 / Fri = Sep 6, 13 / Mon = Sep 2, 9 | Sep 16 Respect for the Aged Day, Sep 22 Autumnal Equinox, Sep 23 substitute holiday |
| 2025 | Sep 26 (Fri), Sep 29 (Mon), Sep 30 (Tue) | Fri = Sep 5, 12 / Mon = Sep 1, 8 / Tue = Sep 2, 9 | Sep 15 Respect for the Aged Day, Sep 23 Autumnal Equinox |
| 2026 | Sep 28 (Mon), Sep 29 (Tue), Sep 30 (Wed) | Mon = Sep 7, 14 / Tue = Sep 1, 8 / Wed = Sep 2, 9 | Sep 21 Respect for the Aged Day, Sep 22 Citizens’ Holiday, Sep 23 Autumnal Equinox |
Source: compiled by the HotelBank Editorial Team from the Cabinet Office, “National Holidays”
The comparison method also avoids a simple daily comparison of market averages. Because the set of properties publishing prices changes from day to day, movements in the average would reflect shifts in the supply mix rather than demand. Instead, a paired same-property comparison was used: for each property, the ratio of “the listed price on the subject day” to “the average listed price on the same-weekday control days” was calculated, and the median of those ratios serves as the representative value for the city. Coverage is accommodation within a 3km radius of each city’s main terminal station, aggregating only properties for which prices were observed on both the subject day and the control days.
Two years of observations — no price peak formed on the half-end business days
The conclusion first. In both 2024 and 2025, the only case in which the final three business days clearly exceeded the control weekdays was Osaka in 2025. In every other city-year combination, the ratio sits around 1.00 or below it.
Source: compiled from MetroEngines Research by the HotelBank Editorial Team
Sapporo came in 9.0% below the control weekdays in 2024 and 8.5% below in 2025 — two consecutive years in which the half-end business days were the weaker ones. This has nothing to do with the accounting close; it reflects the seasonal structure in Hokkaido, where the second half of September marks the transition from summer demand to the quieter autumn period. Indeed, Hokkaido’s estimated settled ADR declines from September into October every year, and the same force appears to operate within the month. Sendai was similarly, if mildly, negative: -3.4% in 2024 and -2.1% in 2025.
Nagoya was essentially flat at 0.0% in 2024 and -0.5% in 2025. Fukuoka likewise came in at -0.8% in 2024 and +0.6% in 2025, both within the margin of noise. In four of the five cities, the accounting event of the fiscal half-year close did not move listed price levels at all.
| City | Year | Subject day 1 | Subject day 2 | Subject day 3 | 3-day average | Properties covered |
|---|---|---|---|---|---|---|
| Sapporo | 2024 | 0.959 | 0.894 | 0.878 | 0.910 | 206-207 |
| 2025 | 0.868 | 0.960 | 0.918 | 0.915 | 195-197 | |
| Sendai | 2024 | 0.917 | 1.000 | 0.982 | 0.966 | 87 |
| 2025 | 0.995 | 0.994 | 0.948 | 0.979 | 85 | |
| Nagoya | 2024 | 1.000 | 1.002 | 0.998 | 1.000 | 175-181 |
| 2025 | 1.020 | 1.000 | 0.965 | 0.995 | 173-174 | |
| Osaka | 2024 | 1.004 | 1.000 | 1.008 | 1.004 | 265-266 |
| 2025 | 1.065 | 1.126 | 1.098 | 1.096 | 252-253 | |
| Fukuoka | 2024 | 1.000 | 0.977 | 0.998 | 0.992 | 358-360 |
| 2025 | 1.011 | 1.009 | 0.997 | 1.006 | 344-360 |
Figures are medians of the paired same-property comparison (1.00 = level with same-weekday ordinary weekdays). Subject days are listed in chronological order for each year’s final three business days. Source: compiled from MetroEngines Research by the HotelBank Editorial Team
The exception, Osaka in 2025, averaged 1.096 across the three days — 9.6% above the control weekdays. That year, roughly 80% of Osaka properties priced above their control level on the half-end business days (83.7% on September 29), so this was a market-wide movement. It is premature, however, to read it as an effect of the accounting close. September 2025 fell in the closing phase of the Osaka-Kansai World Expo, a period of concentrated last-minute visits ahead of the October 13 closing. According to the Expo association, cumulative attendance passed 20 million on September 5 and 25 million on September 27, meaning the pace of visits accelerated through the second half of the month. Osaka’s upside is therefore explained by the demand concentration at the end of the Expo, not by the fiscal half-end.
Where 2026 stands — reading an in-progress snapshot with lead times aligned
September 28, 2026 is more than 50 days beyond the time of writing, and bookings are still in progress. At this stage, assertions such as “sold out” or “selling through early” cannot be made. For 2026, therefore, only the booking pace as a snapshot is discussed. The design of the comparison matters here. If figures observed on the same day are simply placed side by side, the subject days (September 28–30) sit further out than the control days (September 1–14), so lead times do not line up. Later dates naturally have less booking progress, and comparing them directly is meaningless.
Occupancy (estimated) was therefore extracted for each check-in date at the same point in lead time. Subject days are matched against same-weekday control days across three snapshots: LT60, LT70 and LT80. Note that occupancy in this section is a macro indicator at the prefecture level, with Hokkaido, Miyagi, Aichi, Osaka and Fukuoka standing in for the respective cities.
Source: compiled from MetroEngines Research by the HotelBank Editorial Team
The results are consistent with the 2024 and 2025 observations. Osaka is +1.1 to +1.4pt and Fukuoka +0.4 to +1.2pt — differences of around one point regardless of the lead-time snapshot. Hokkaido is -3.6 to -5.4pt and Miyagi -2.0 to -3.5pt, meaning the control weekdays are in fact further along. Since both the sign and the magnitude hold roughly steady across all three lead-time snapshots, this reads as a stable tendency rather than noise from observation timing.
Aichi alone stands out at +19.3 to +20.3pt. This too is not an effect of the accounting close. The 20th Asian Games (Aichi-Nagoya 2026) runs from September 19 to October 4, 2026, placing the three half-end business days squarely inside the competition window. Laying out Nagoya’s daily listed prices for September makes the structure plain.
Within a 3km radius of Nagoya Station, n = 156–195 properties per day. Source: compiled from MetroEngines Research by the HotelBank Editorial Team
Listed prices tracked around ¥26,000–30,000 on weekdays through September 18, stepped up from the opening day on September 19, and returned to ¥29,500 on October 5, the day after the October 4 closing. The half-end levels (¥49,800 on September 28, ¥47,700 on the 29th and ¥46,200 on the 30th) are simply part of that competition-window plateau. On a paired same-property basis the ratios run 1.74 to 1.86, with more than 90% of properties pricing above their control level. As a subject for measuring the effect of the accounting close, Nagoya in 2026 cannot be separated out.
| Area | Properties covered | Rooms covered | LT60 diff. | LT70 diff. | LT80 diff. | Reading |
|---|---|---|---|---|---|---|
| Hokkaido | 1,357 | 93,552 | -5.4pt | -4.1pt | -3.6pt | Autumn demand transition dominates |
| Miyagi | 334 | 26,508 | -3.5pt | -2.1pt | -2.0pt | Same, but a narrower gap |
| Aichi | 536 | 54,211 | +19.3pt | +20.3pt | +19.9pt | Inside the Asian Games window |
| Osaka | 714 | 110,699 | +1.1pt | +1.4pt | +1.4pt | Marginal; post-Expo reaction phase |
| Fukuoka | 625 | 54,627 | +0.7pt | +1.2pt | +0.4pt | Marginal |
Difference = average occupancy (estimated) across the three half-end business days minus average occupancy (estimated) across the same-weekday control weekdays. Observed property counts in the LT60/70/80 snapshots range from 203 to 1,132 (the range across all lead-time snapshots is 1 to 1,368). Thin snapshots covering less than half of total rooms are excluded from the aggregation. Source: compiled from MetroEngines Research by the HotelBank Editorial Team
A note on observed property counts. Booking-pace data varies in how many properties can be observed at each snapshot, and across all lead-time snapshots the range swings widely, from 1 to 1,368 properties. In an extremely thin snapshot, occupancy can appear to jump simply because a property with large inventory happened to drop out. This article therefore uses only snapshots in which at least half of each area’s total properties were observed. Property counts in the adopted snapshots range from 203 to 1,132. Refusing to narrate peaks and troughs from thin snapshots is an indispensable step in this kind of analysis.
September is not a peak on a monthly view either — estimated settled ADR across five areas
If no half-end effect appears in the daily data, what about the monthly view? Lining up three years of September estimated settled ADR across the five areas makes it even clearer that the accounting calendar is not what drives demand.
Properties covered: Hokkaido 890–931, Miyagi 286–302, Aichi 476–515, Osaka 630–646, Fukuoka 457–462. September 2026 is an estimate based on listed levels as of the survey date. Source: compiled from MetroEngines Research by the HotelBank Editorial Team
For September 2026, Aichi stands out at ¥14,000, up 65.7% year on year — the influence of the Asian Games showing up here as well. Hokkaido is ¥14,000 (up 27.5% year on year), Miyagi ¥12,000 (up 33.5%) and Fukuoka ¥13,100 (up 23.9%), all showing solid growth. Osaka, by contrast, is ¥10,100, down 26.6% year on year, because the comparison base is September 2025 (¥13,800), the year the World Expo was held. Separating the fading Expo premium from the underlying trend is a question in its own right, and the two need to be read apart rather than treated as a single movement.
Macro corroboration is also worth having. According to the Japan Tourism Agency’s “Accommodation Travel Statistics Survey,” the room occupancy rate for business hotels in September 2025 was 76.8%, up 1.4pt year on year. Across all facility types the figure was 63.2%. Official statistics likewise confirm that September is not an unusually busy month, but rather an extension of year-round business demand.
Why the half-end effect rarely shows up in price
None of this means “there is no business travel at the fiscal half-end.” Trips for year-end processing and budget spending surely do occur. There are, however, several structural reasons why they are hard to observe as a peak in supply and demand.
First, scale matters. Even if additional business demand is added at the end of September, it is small relative to the total room count in a major city. Hokkaido covers 93,552 rooms and Osaka 110,699. An increase of a few hundred rooms is barely enough to move occupancy by a single point.
Second, what increases at the half-end may be less “new accommodation demand” than “existing trips pulled forward or pushed back.” If schedules merely cluster within the same month, the monthly total is unchanged, and on a daily view demand is drawn away from the control days, so the differences tend to cancel out.
Third, seasonal factors are larger. The negative readings on the half-end business days in Sapporo and Sendai suggest that the force of summer demand receding into late September outweighs half-end business demand. Hokkaido’s estimated settled ADR falls from September into October every year, and the same gradient operates within the month.
Fourth, the presence of events is overwhelming. The two cases in which a peak did form on the half-end business days — Osaka in 2025 during the closing phase of the Expo, and Nagoya in 2026 during the Asian Games — were both explained by a large-scale event. As a driver of weekday supply and demand in cities, the event calendar is far more powerful than the accounting calendar.
How to construct pricing for half-end weekdays
Taking all of the above together, several workable moves emerge for handling late-September weekdays. Each begins by dropping the premise that “it is the half-end, so raise the rate.”
1. Set a baseline that does not build in a half-end premium. Starting late-September weekdays from the same baseline as same-weekday ordinary weekdays is what the observations support. In areas such as Sapporo and Sendai that soften seasonally in the second half of the month, setting an initial value slightly below the ordinary weekday level — leaving room to raise it as pace develops — is less likely to leave opportunity on the table.
2. Make the event calendar the primary input to the pricing calendar. As Nagoya in 2026 shows, listed prices can run at more than 1.7 times normal levels on weekdays during a competition window — and revert to the previous level the day after it ends. Large-scale events, with host city, dates and scale all published in advance, are a far more predictable revenue opportunity than the accounting close.
3. Align lead times when judging pace. Observing two different dates on the same day and comparing them will always make the later date look behind. Switching to a practice of benchmarking against “what percentage last year’s same weekday had reached at LT60” and comparing it with the same lead-time snapshot this year makes the data usable as an input to pricing decisions. That is why this article aligned three snapshots at LT60, LT70 and LT80. Autumn booking lead times also vary by trip purpose and location — resort demand tends to book earlier for long weekends, while urban weekdays fill first — so holding the lead time constant is what makes the comparison meaningful.
4. Be rigorous about aligning days of the week. The date September 28 was a Saturday in 2024, a Sunday in 2025 and a Monday in 2026. Taking a year-on-year comparison by date misaligns the weekday and does not hold up as a comparison of business demand. The effort of aligning on a final-business-day and same-weekday basis translates directly into the precision of the judgment.
5. When an upside does occur, decompose the cause. Osaka in 2025 came in 9.6% above the control weekdays on the three half-end business days, but recording that as “the half-end is strong” would mean carrying the same settings into 2026, a year with no Expo. Records of upside should always be kept together with what was being held at the time.
Conclusion — what was moving was the event calendar, not the accounting calendar
Comparing the final three business days of September against same-weekday ordinary weekdays on a paired same-property basis across Sapporo, Sendai, Nagoya, Osaka and Fukuoka, no lift attributable to the fiscal half-year close was observed in either 2024 or 2025. Sapporo was negative two years running (-9.0% in 2024, -8.5% in 2025), Sendai mildly negative, and Nagoya and Fukuoka essentially flat.
The only substantial upside, Osaka in 2025 (+9.6%), came from the last-minute rush at the close of the Expo, while the +19.3 to +20.3pt pace gap observed in Aichi for 2026 comes from the Asian Games window — both explained by a large-scale event. Behind the rule of thumb that “the half-end moves,” what actually moved price and occupancy was the event, not the fiscal period.
This result does not mean there is nothing to be done about late-September weekdays. Quite the opposite: judgment can be shifted away from the vague rationale of the fiscal close and onto observable variables — events, day of week and lead time. If there is a reliable revenue opportunity at the end of September, it lies on the side of large-scale events whose dates are published in advance. For the Nagoya area, late September 2026 is precisely such a period.
For hoteliers: plan-name cues that work for half-end weekday product design
The most common appeal elements in publicly listed business-hotel plan names (N=1,078) —
Breakfast included 56%Buffet 24%Room only 24%Western room / twin 16%Early booking 13%Discount 10%
Examples of actual names (anonymized):
- [30-Day Advance Discount] Better value on 2+ consecutive nights ◆Eco Stay◆ Free breakfast buffet ◆◆ Children through elementary school stay free when sharing a bed
- Couples Plan [Semi-Double Room] — 24-hour long stay — ◆Breakfast buffet included◆
- [21-Day Advance Discount] Better value on 2+ consecutive nights ◆Earth-friendly Eco Stay◆ Free breakfast buffet
* A tendency derived from aggregated public plan names; it does not demonstrate that naming causes sales. At the half-end, building rate per guest through stay-value design — breakfast inclusions, multi-night discounts — fits the observations better than adding a premium to the base rate.
⚠ Note on the September 2026 data: September 28–30, 2026 falls more than 50 days beyond the survey date used here. Listed prices, estimated settled ADR and booking pace are all estimates based on the sales information published as of the survey date, and will change as the check-in date approaches. This article presents an in-progress snapshot for 2026; it does not assert sell-out or excess demand.
Further reading
References and sources
■ Data sources
Daily listed prices are the all-plan average published by each property on OTAs and similar channels (double occupancy, per room, tax included); occupancy (estimated) is a prefecture-level estimate based on OTA sales inventory; estimated settled ADR applies category-specific adjustment coefficients to each property’s lowest plan level — all compiled by MetroEngines Research (data snapshot as of August 2026). Official statistics are from the Japan Tourism Agency’s “Accommodation Travel Statistics Survey,” calendar verification from the Cabinet Office’s “National Holidays,” and event dates from official organizer announcements.
■ Assumptions
The subject is the final three business days of September in each year, with control days being ordinary weekdays on the same day of the week (first and second weeks of September, excluding the holiday cluster around Respect for the Aged Day and the Autumnal Equinox). City-level price comparisons use the median of a paired same-property comparison, covering accommodation within a 3km radius of each city’s main terminal station and including only properties for which prices were observed on both the subject and control days. Booking pace for 2026 is matched at identical lead-time snapshots of LT60, LT70 and LT80, adopting only snapshots in which at least half of each area’s total properties were observed.
■ Limitations and caveats
Listed prices are not transacted prices, and estimated settled ADR is an estimate carrying a median error of roughly 7% when cross-checked against property-level disclosures from listed hotel REITs. Occupancy (estimated) is a macro indicator at the prefecture level and does not match municipality-level or property-level actuals. Observed property counts in the booking-pace data swing from 1 to 1,368 by snapshot, so thin snapshots are excluded from the aggregation. The September 2026 figures are an in-progress snapshot more than 50 days ahead of the time of writing and do not assert sell-out or excess demand.
■ Market data
- MetroEngines Research — daily listed prices (paired same-property comparison, five cities, n = 85–360 properties), booking pace and occupancy (estimated) (five prefectures, 334–1,357 properties), estimated settled ADR (monthly, 286–931 properties)
■ Government and official statistics
- Japan Tourism Agency, “Accommodation Travel Statistics Survey” — September 2025: business hotel room occupancy 76.8%, all facilities 63.2%
- Japan Tourism Agency, “Accommodation Travel Statistics Survey (September 2025, second preliminary figures)” press release
- Cabinet Office, “National Holidays” — verification of Respect for the Aged Day and the Autumnal Equinox, 2024–2026
■ Primary event sources