

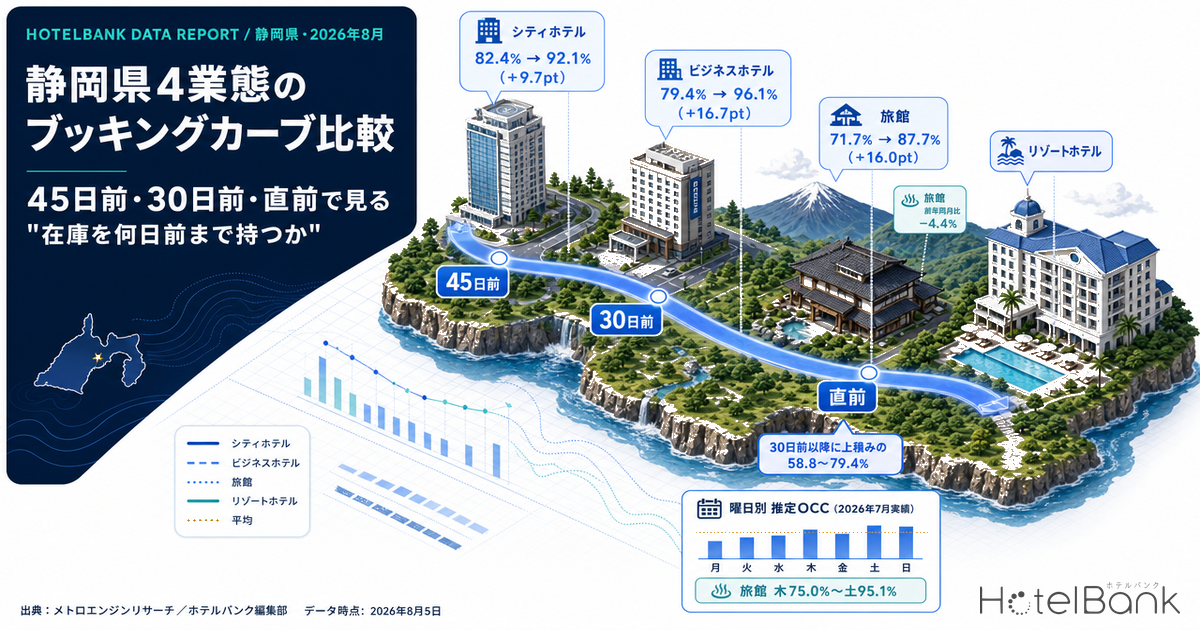
In Shizuoka, when a stay date fills up depends almost entirely on property type. Tracking Saturday 8 August 2026 from 45 days out to the latest observation, estimated OCC (based on OTA-listed inventory) built up from 82.4% to 92.1% (+9.7pt) at city hotels, 79.4% to 96.1% (+16.7pt) at business hotels, 71.7% to 87.7% (+16.0pt) at ryokan, and 73.7% to 89.7% (+16.0pt) at resort hotels. Even where the total is the same “+16pt,” the timing of that pickup differs sharply by type. This article lines up the booking curves of Shizuoka’s four property types at three fixed points — 45 days out, 30 days out, and the latest observation — and translates them into the practical question of how many days out you should keep holding inventory.
Scope: four property types in Shizuoka — city hotels, business hotels, ryokan, and resort hotels — N=787 properties (8 August 2026 arrival cross-section: city 30 properties / 3,603 rooms; business 211 properties / 22,401 rooms; ryokan 410 properties / 9,992 rooms; resort 136 properties / 7,953 rooms). The price metric in this article is estimated settled ADR (the settled price level inferred from OTA and comparable sales data, tax-exclusive equivalent); occupancy is an estimate based on OTA-listed inventory. Both definitions appear at the end of the article. Data as of 5 August 2026.
- — 58.8-79.4% of total pickup happens after the 30-day mark (Saturday 8 August 2026 arrival, four Shizuoka property types). Falling short at 45 days out is not a signal to discount; treat it as a coordinate for recording the size of the gap.
- — City hotels are the only type that decelerates in the close-in window. Daily pickup from 30 days out to 4 days out is 0.22pt/day for city hotels, against 0.46 for business hotels, 0.45 for ryokan, and 0.49pt/day for resort hotels.
- — The ranking at 45 days out is not the ranking at arrival. City hotels lead at 45 days out with 82.4%, but business hotels finish highest at 96.1% (estimated OCC, OTA-listed inventory basis, 8 August 2026 arrival).
- — Day-of-week swing is 1.3-1.8x wider for the lodging-led types than for the hotel types. July 2026 actuals show 20.1pt for ryokan and 15.2pt for resorts, against 11.2pt for city and 11.4pt for business hotels.
- — Pricing is below last year at the two lodging-led types. Year-on-year estimated settled ADR is −3.6% / −4.4% for ryokan and −7.2% / −8.9% for resorts (June and July 2026 confirmed figures). There is room to check whether occupancy is being built up at the cost of pushing price down.
From 45 days out to now — the four curves are shaped differently
First, all four curves from 45 days out to the latest observation are overlaid on a single chart. The target is arrival on Saturday 8 August 2026. This stay date has reached the point of 4 days remaining, making it the only Saturday for which all four types share an identical observation window (45 days out to 4 days out). As a basis for comparison, conditions do not get better than this.
Source: compiled by the HotelBank Editorial Team from MetroEngines Research data
Looking at the four lines, both the starting height and the way the slope develops differ by type. At 45 days out, city hotels are the highest at 82.4% and ryokan the lowest at 71.7%. Yet the final landing point is highest for business hotels at 96.1%, with city hotels overtaken at 92.1%. City hotels trace a curve that is high early but adds little afterwards; business hotels look like laggards but close the gap in a rush at the end.
Ryokan and resort hotels share a similar level in the low 70s at 45 days out, but behave differently in between. Resort hotels stall through the run-up to 30 days out, then their slope steepens from around 25 days remaining. Ryokan climb gently and consistently from 45 days out, then jump once more in the final 5 days. Both can be described as types where inventory keeps moving right up to arrival.
Reading the three fixed points — 58-79% of pickup happens after 30 days out
Rather than the whole curve, we now isolate three fixed points: 45 days out, 30 days out, and the latest observation. The four August Saturdays (8/8, 8/15, 8/22, 8/29) have all passed the 30-day cross-section, and their latest observations sit at 4, 11, 18, and 25 days remaining. The two September Saturdays (9/5, 9/12) have not yet reached 30 days out, so only two points — 45 days out and the latest observation — are shown for them.
| Stay date | Type | 45 days out | 30 days out | Latest obs. | 45 days out → latest |
|---|---|---|---|---|---|
| Sat 8/8 latest = 4 days out | City | 82.4% | 86.4% | 92.1% | +9.7pt |
| Business | 79.4% | 84.1% | 96.1% | +16.7pt | |
| Ryokan | 71.7% | 76.0% | 87.7% | +16.0pt | |
| Resort | 73.7% | 77.0% | 89.7% | +16.0pt | |
| Sat 8/15 latest = 11 days out | City | 74.3% | 78.4% | 83.0% | +8.7pt |
| Business | 72.0% | 75.7% | 80.2% | +8.2pt | |
| Ryokan | 63.2% | 67.0% | 74.8% | +11.6pt | |
| Resort | 67.7% | 73.2% | 82.5% | +14.8pt | |
| Sat 8/22 latest = 18 days out | City | 87.5% | 91.2% | 91.4% | +3.9pt |
| Business | 88.2% | 89.8% | 91.0% | +2.8pt | |
| Ryokan | 70.0% | 75.6% | 80.0% | +10.0pt | |
| Resort | 75.2% | 82.3% | 86.1% | +10.9pt | |
| Sat 8/29 latest = 25 days out | City | 85.2% | 86.8% | 87.2% | +2.0pt |
| Business | 82.0% | 84.2% | 85.4% | +3.4pt | |
| Ryokan | 68.8% | 73.8% | 75.4% | +6.6pt | |
| Resort | 76.0% | 82.1% | 83.5% | +7.5pt | |
| Sat 9/5 latest = 32 days out | City | 77.9% | — | 77.4% | −0.5pt |
| Business | 73.0% | — | 74.5% | +1.5pt | |
| Ryokan | 66.3% | — | 68.1% | +1.8pt | |
| Resort | 70.5% | — | 74.4% | +3.9pt | |
| Sat 9/12 latest = 39 days out | City | 79.5% | — | 80.3% | +0.8pt |
| Business | 71.6% | — | 72.9% | +1.3pt | |
| Ryokan | 64.8% | — | 67.0% | +2.2pt | |
| Resort | 71.6% | — | 73.3% | +1.7pt |
Source: compiled by the HotelBank Editorial Team from MetroEngines Research data
Two structural findings emerge from this table. First, averaging the pickup accumulated over the 15 days from 45 days out to 30 days out across the four August Saturdays gives +3.4pt for city, +3.1pt for business, +4.7pt for ryokan, and +5.5pt for resorts — meaning resort hotels and ryokan move the most in this window. The two hotel types barely move over these 15 days.
Second, for the 8 August arrival (45 days out to 4 days out, the window shared by all four types), the share of total pickup that occurred after the 30-day mark is 58.8% for city, 71.9% for business, 73.1% for ryokan, and 79.4% for resorts. In other words, for every type, the majority of pickup — up to roughly 80% — arrives only after the 30-day mark has passed. Judging “we’re behind, so cut price” from the 45-day cross-section alone is premature for all four Shizuoka property types.
Converting to daily pickup pace makes the difference even clearer. Over the 15 days from 45 to 30 days out the types are level — city 0.27pt/day, business 0.31pt/day, ryokan 0.29pt/day, resort 0.22pt/day — but over the 26 days from 30 days out to 4 days out, city hotels run 0.22pt/day against business 0.46pt/day, ryokan 0.45pt/day, and resort 0.49pt/day. City hotels are the only type that decelerates in the close-in window; the other three actually accelerate. This single point is what splits the answer to “how many days out should I hold inventory” by property type. The same question — whether types that reach a higher level at 45 days out have less headroom left close in — is tested against a different prefecture’s data in Tochigi Booking Curves by Type: Resort 81.1% at T-45, Only +2.6pt Left.
The estimated share of properties with no listed inventory points the same way. Restricting to cross-sections within 30 days of the stay date, the 22 August arrival shows business 42.7%, city 30.0%, ryokan 27.6%, and resort 21.3% at the latest observation. For the 8 August arrival at 4 days remaining, the figures are business 46.0%, ryokan 39.0%, resort 21.3%, and city 20.0%. Business hotels see high occupancy and a high sold-out share rise together, whereas resort hotels still have listed inventory at nearly 80% of properties even with occupancy up at 89.7%. The difference in rooms per property and in how inventory is released shows through here.
How inventory depletes by day of week — the July 2026 actual cross-section
The shape of the curve also changes with the day of week of the stay date. Using daily actuals for the completed month of July 2026, estimated OCC was averaged by day of week for each property type.
Source: compiled by the HotelBank Editorial Team from MetroEngines Research data
Saturday reaches the 90s for every type (city 92.9%, business 93.3%, ryokan 95.1%, resort 94.0%). The differences show up on weekdays. The gap between the highest and lowest day of week is 11.2pt for city hotels (Sat 92.9% to Mon 81.7%) and 11.4pt for business hotels (Sat 93.3% to Sun 81.9%), against 20.1pt for ryokan (Sat 95.1% to Thu 75.0%) and 15.2pt for resorts (Sat 94.0% to Wed 78.8%). The two lodging-led types swing roughly 1.3-1.8x wider by day of week than the hotel types.
Business hotels are strong Tuesday through Thursday at 88.4-90.1% and weakest on Sunday at 81.9% — the weekly rhythm of business travel demand feeding straight through into inventory depletion. Ryokan and resorts are strong Friday, Saturday, and Sunday, with a trough on Wednesday and Thursday. Put differently, the same “70% at 45 days out” carries a very different amount of remaining headroom depending on whether the stay date is a Thursday or a Saturday.
The price axis — confirmed year-on-year estimated settled ADR and the seasonal shape
Deciding how to hold inventory requires looking at where the price level is landing as well. Below is the year-on-year comparison of estimated settled ADR for Shizuoka’s four property types for June and July 2026, using confirmed figures on both sides.
| Type | June 2025 (confirmed) | June 2026 (confirmed) | YoY | July 2025 (confirmed) | July 2026 (confirmed) | YoY |
|---|---|---|---|---|---|---|
| City hotels | ¥12,708 N=31 | ¥12,741 N=30 | +0.3% | ¥13,341 N=31 | ¥13,252 N=30 | −0.7% |
| Business hotels | ¥6,608 N=218 | ¥6,589 N=221 | −0.3% | ¥7,151 N=219 | ¥7,324 N=221 | +2.4% |
| Ryokan | ¥15,978 N=457 | ¥15,409 N=449 | −3.6% | ¥17,479 N=449 | ¥16,702 N=457 | −4.4% |
| Resort hotels | ¥15,754 N=132 | ¥14,622 N=148 | −7.2% | ¥17,860 N=132 | ¥16,269 N=151 | −8.9% |
Source: compiled by the HotelBank Editorial Team from MetroEngines Research data
The two hotel types are close to flat year on year (city +0.3% and −0.7%, business −0.3% and +2.4%), while the two lodging-led types came in below last year in both June and July (ryokan −3.6% and −4.4%, resort −7.2% and −8.9%). As the previous section showed, ryokan and resorts are exactly the types that build occupancy hardest in the close-in window — so the combination is one of an occupancy curve steepening while price sits below last year. For the product side of how Shizuoka ryokan actually present and sell themselves, Shizuoka Ryokans: What “Full” Inns Name Differently (N=409) works through real examples from the top and bottom quartiles.
For reference, estimated settled ADR for August 2026, based on current sales conditions, is ¥16,600 for city (N=30), ¥9,500 for business (N=218), ¥19,600 for ryokan (N=452), and ¥21,800 for resorts (N=150). Because these move with in-month sales conditions, a simple comparison against confirmed prior-year figures should wait for month-end confirmation.
The seasonal shape is worth holding on to as well. For Shizuoka ryokan, estimated settled ADR is plotted year over year below.
Source: compiled by the HotelBank Editorial Team from MetroEngines Research data
The gap between the August peak (2025 confirmed ¥22,428, N=439) and the June trough (2026 confirmed ¥15,409, N=449) is the widest amplitude anywhere in the year, with a second peak in December and January. Across the confirmed portion of 2026 (January to July), the first half ran above the prior year and the trend fell below it from May onward. In building a pricing calendar, these three markers — the June trough, the August peak, and the second peak around year-end and New Year — are the natural starting points.
For revenue managers running hotels and ryokan in Shizuoka — implications and an action plan
1. Do not treat “behind at 45 days out” as a signal to discount. In the 8 August arrival cross-section, the share of pickup from 45 days out to the latest observation that occurred after the 30-day mark was 58.8% for city, 71.9% for business, 73.1% for ryokan, and 79.4% for resorts. Even if your own booking curve is not reaching the market level at 45 days out (city 82.4%, business 79.4%, ryokan 71.7%, resort 73.7%), the market itself still has the majority of its pickup ahead of it at that stage. An across-the-board discount at this point risks selling off demand that is still to come at a lower price.
2. City hotels are the only type that slows down. Daily pickup from 30 days out to 4 days out is 0.22pt/day for city hotels, against 0.46pt/day for business, 0.45pt/day for ryokan, and 0.49pt/day for resorts. Compared with the 45-to-30-day window (city 0.27, business 0.31, ryokan 0.29, resort 0.22), only city hotels ease off. This reads as city hotels having a 30-day level that is close to their effective landing point, while ryokan, resorts, and business hotels get relatively more value from holding inventory right up to arrival.
3. Price and occupancy are pointing in different directions by type. On confirmed-versus-confirmed year-on-year comparisons, the hotel types are roughly flat (city +0.3% / −0.7%, business −0.3% / +2.4%) while ryokan run −3.6% / −4.4% and resorts −7.2% / −8.9%. At the same time, ryokan and resorts build the most occupancy in the close-in window. There is room to check where your own settings for the month in question sit within the market’s estimated settled ADR range, and whether the build-up in occupancy is coming in exchange for pushing price down.
4. The amount of inventory worth holding back differs by day of week. The day-of-week swing in estimated OCC for July 2026 actuals is 20.1pt for ryokan and 15.2pt for resorts, against 11.2pt for city and 11.4pt for business hotels. For the two lodging-led types, there is little reason to handle Thursday (ryokan 75.0%) and Saturday (ryokan 95.1%) under the same inventory control. A design that carries separate “45-days-out targets” by day of week is worth considering.
| Horizon | Action | Decision trigger (figures from this article) | Purpose |
|---|---|---|---|
| T-45 (45 days out) | Compare your own 45-day attainment against the market level for your type, and record only the size of the gap (do not move price at this point) | Market at 45 days out = city 82.4% / business 79.4% / ryokan 71.7% / resort 73.7% (8 August arrival). If the gap is small, consider holding rates steady | Avoid an early discount at a stage where most of the pickup is still ahead |
| T-45 | For ryokan and resorts, set separate attainment targets by day of week | July 2026 actuals: ryokan range Thu 75.0% to Sat 95.1% (20.1pt spread); resorts Wed 78.8% to Sat 94.0% (15.2pt spread) | Reduce the error of judging weekdays and Saturdays against a single benchmark |
| T-30 (30 days out) | For city hotels, treat this cross-section as the effective landing forecast and concentrate pricing decisions here | City runs 0.22pt/day from 30 days out to 4 days out, slower than the 0.27pt/day from 45 to 30 days out. The 8/22 arrival went from 91.2% at 30 days out to 91.4% at the latest observation (+0.2pt) | Avoid holding inventory on hopes pinned to a window where growth is slowing |
| T-30 | For business hotels, ryokan, and resorts, assume inventory will be held and look first at adjusting selling conditions (multi-night stays, cancellation terms) rather than the size of the discount | From 30 days out to 4 days out, pickup of +12.0pt for business, +11.7pt for ryokan, and +12.7pt for resorts was observed | Avoid cannibalising close-in demand at a low price |
| Close-in (within 2 weeks) | Weekly, line up your remaining inventory against the market’s sold-out share and decide the order of release | At 4 days remaining for the 8 August arrival, the share of properties with no listed inventory was business 46.0% / ryokan 39.0% / resort 21.3% / city 20.0% | Vary release speed between types where supply is thinning and types where it is not |
| Looking to next month | Fix the review dates for the pricing calendar in advance, aligned to the seasonal markers | Shizuoka ryokan trough in June (2026 confirmed ¥15,409, N=449), peak in August (2025 confirmed ¥22,428, N=439), second peak in December | Create room to start preparing revisions ahead of the trough |
Source: compiled by the HotelBank Editorial Team from MetroEngines Research data
Summary — the number of days to hold inventory differs by type
Lining up Shizuoka’s four property types at three fixed points — 45 days out, 30 days out, and the latest observation — yields three yardsticks worth taking away.
Yardstick 1: 45 days out is a place to record, not a place to decide. Across all four types for the 8 August arrival, 58.8-79.4% of pickup occurred after the 30-day mark. The 45-day figure is a coordinate for measuring the gap between your property and the market — not a signal to move price.
Yardstick 2: Separate the types that decelerate from the types that accelerate. Daily pickup after the 30-day mark is 0.22pt/day for city hotels, against 0.46 for business, 0.45 for ryokan, and 0.49pt/day for resorts. The Shizuoka data points to an operational split: treat 30 days out as the effective landing point for city hotels, and hold inventory to the end for the other three types.
Yardstick 3: Apply different day-of-week target levels by type. The day-of-week swing in July 2026 actuals is 20.1pt for ryokan, 15.2pt for resorts, 11.2pt for city, and 11.4pt for business hotels. The lodging-led types have far more scope to be designed as a different product for each day of the week.
A booking curve is an average picture of a property type; the shape shifts with your own location, room count, and channel mix. The market curves shown here are realistically used as background lines to overlay your own curve against, in order to measure where the divergence lies.
About the data
| Item | Detail |
|---|---|
| Definition of estimated OCC | Occupancy on an OTA-listed inventory basis = 100 − 100 × rooms still listed on OTAs ÷ total rooms. It is an estimate based on how listed inventory is being taken up on OTAs, and is defined differently from true room occupancy (it reads higher). This article labels it “estimated OCC (based on OTA-listed inventory).” |
| Booking curve | Based on observations from 45 days before the stay date to the latest observation. Target stay dates are 8, 15, 22 and 29 August and 5 and 12 September 2026 (all Saturdays). The latest observation is as of 4 August 2026 (4, 11, 18, 25, 32 and 39 days remaining to each stay date respectively). |
| Definition of estimated settled ADR | The settled price level (tax-exclusive equivalent) inferred from OTA and comparable sales data (lowest-plan level × type-specific coefficients, ensembled across multiple channels). Past months are confirmed figures; the current and future months are estimates based on present sales conditions. Median error against published operating results is 6.6%. |
| N breakdown (booking curve) | Shizuoka. City hotels 30 properties / 3,603 rooms; business hotels 211-212 properties / 22,401-22,633 rooms; ryokan 409-410 properties / 9,992-10,007 rooms; resort hotels 135-136 properties / 7,925-7,953 rooms (varying by stay date). Observed property counts at the three fixed points (including the latest-observation column) are city 19-30, business 98-207, ryokan 226-405, and resort 101-135 properties. |
| N breakdown (estimated settled ADR) | Shizuoka. July 2026 confirmed figures: city hotels N=30, business hotels N=221, ryokan N=457, resort hotels N=151. August 2026 current estimates: city N=30, business N=218, ryokan N=452, resort N=150. |
| Estimated OCC by day of week | Daily actuals for July 2026 averaged by day of week. Limited to days with observation coverage of 70% or higher (city 31 days, business 31 days, ryokan 29 days, resort 28 days). Property counts covered are city 25-30, business 200-212, ryokan 334-412, and resort 124-136. |
| Sold-out share | Estimated share of properties for which no listed inventory can be confirmed on OTAs and comparable channels. Reported only for cross-sections within 30 days of the stay date. |
| Data as of | Data as of 5 August 2026. Because sales conditions and inventory change daily, the figures in this article are a snapshot at the time of collection. |
Source: compiled by the HotelBank Editorial Team from MetroEngines Research data
■ Data sources
Daily history of OTA-listed inventory and prices in Shizuoka, collected and aggregated by MetroEngines Research & Consulting. Booking curves track listed remaining rooms for each target stay date from 45 days before the stay date to the latest observation; estimated OCC by day of week averages July 2026 daily actuals by day of week (limited to days with observation coverage of 70% or higher). Estimated settled ADR is the monthly settled price level inferred from the same data, confirmed through July 2026 with August as a current estimate. Data as of 5 August 2026.
■ Calculation assumptions
Estimated OCC = 100 − (rooms still listed on OTAs ÷ total rooms) × 100. Property types are classified from property attributes into four categories: city hotels, business hotels, ryokan, and resort hotels. The three fixed points are 45 days out, 30 days out, and the latest observation (as of 4 August 2026); September stay dates have not yet reached 30 days out, so only the two points of 45 days out and the latest observation are shown. “Daily pickup” is the simple average of the estimated OCC difference over a window divided by the number of days in that window. “Share after the 30-day mark” is the ratio of pickup from 30 days out to the latest observation against total pickup from 45 days out to the latest observation. Year-on-year comparisons are calculated only between confirmed figures; estimates and confirmed figures are not compared.
■ Limitations and caveats
Estimated OCC is an estimate based on how OTA-listed inventory is being taken up; it is defined differently from true room occupancy and reads higher. Direct bookings, group business, and corporate contract volume are not captured. The number of observed properties varies by stay date and cross-section (across the three fixed points: city 19-30, business 98-207, ryokan 226-405, resort 101-135 properties), and on thin cross-sections the curve may swing more than actual market conditions. The sold-out share may be overstated because a delisting is treated the same way as a sell-out. Estimated settled ADR has a median error of 6.6% against published operating results. The figures in this article are averages at the prefecture and property-type level, and do not directly represent the curve of an individual property with a different location, room count, or channel mix.
Related reading
- Tochigi Booking Curves by Type: Resort 81.1% at T-45, Only +2.6pt Left
- Kyoto Obon 2026 Booking Curves: Ryokan Add the Most Close In, +11.4pt
- Nagano Late-Summer Booking Curve 2026: Ryokan -11.8pt at 45 Days Out
- Hokkaido City Hotels: Only Aug 15 Trails at 78.7% OCC, 45 Days Out
- Okinawa Late-Summer Booking Curve 2026: Sep 5 Beats Obon, City +4.7pt
- Shizuoka Ryokans: What “Full” Inns Name Differently (N=409)