

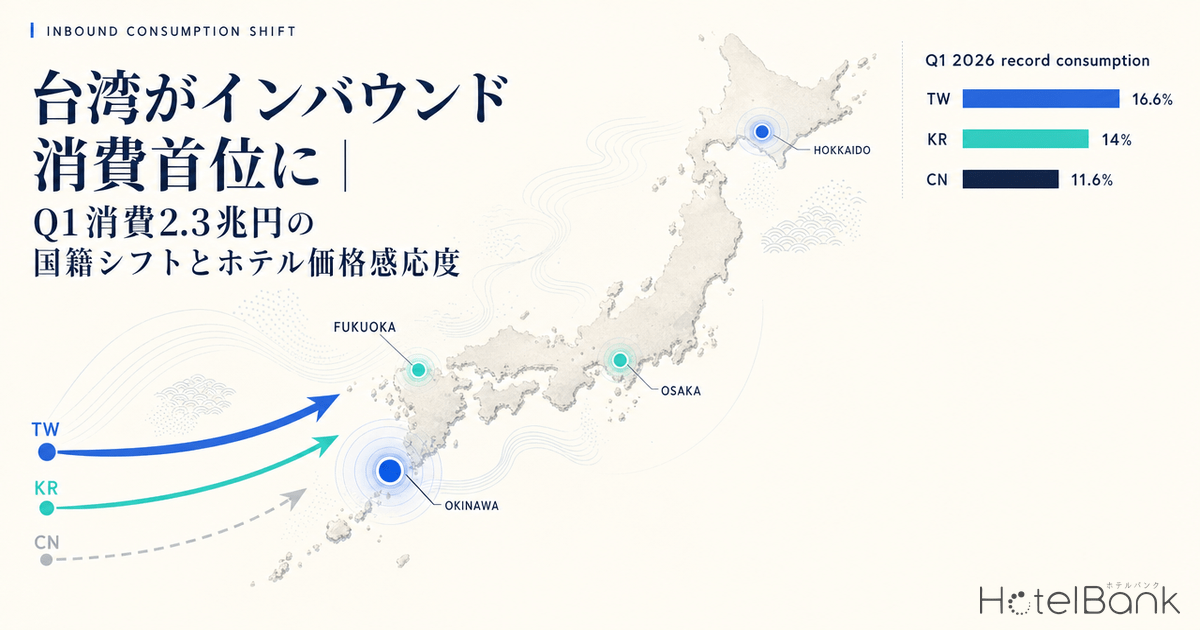
According to the first preliminary report on the Inbound Consumption Trend Survey released by the Japan Tourism Agency on April 15, 2026, foreign visitor travel spending in Japan for January–March 2026 reached ¥2.3378 trillion, up 2.5% year-on-year and once again setting a new quarterly record. But what matters most is what lies beneath the headline number. Taiwan reached ¥388.4 billion (16.6% share, +22.5% YoY) and took the top spot in spending for the first time, while China — long the leader — fell to third place at ¥271.5 billion (11.6% share, -50.4% YoY), roughly half its previous level.
When the composition of demand changes, the demand curve for accommodation itself gets rewritten. This article focuses on “spending” rather than “headcount,” and examines how hotel average daily rates (ADR) are responding in regions experiencing this shift in nationality mix, drawing on publicly listed price data from MetroEngines Research.
Metric Definitions Used in This Article
- ADR (Average Daily Rate): The average of listed prices on OTAs and similar platforms. This differs from actual transacted prices. Per-room rate (tax included) for two-person, one-room occupancy, averaged across all plans (room-only through plans with meals).
- Spending: Quarterly preliminary figures from the Japan Tourism Agency’s “Inbound Consumption Trend Survey” (travel spending by nationality).
- YoY: Year-on-year. Monthly comparisons are standardized to same-month-prior-year.
- Data Sources: MetroEngines Research, Japan Tourism Agency, JNTO, monthly operating data from each REIT
Q1 2026: A Tectonic Shift in Spending Share
First, let’s confirm how the composition of spending has changed. According to the Tourism Agency’s preliminary report, Taiwan added ¥71.1 billion from the previous year to take the top position, and Korea also moved up to second place with a +12.7% YoY gain. Meanwhile, China dropped from ¥547.8 billion in the same period of 2025 to ¥271.5 billion. This is attributed to the impact of the Chinese government’s travel advisory regarding Japan and reduced flight services (Source: Japan Tourism Agency, JNTO).
Source: Compiled by HotelBank Editorial Team from Japan Tourism Agency “Inbound Consumption Trend Survey” Q1 2026 first preliminary report
Looking at foreign visitor arrivals (JNTO preliminary data) for the same period, March alone saw 796,000 from Korea (+15.0% YoY), 653,000 from Taiwan (+24.9% YoY), 376,000 from the US (+9.7% YoY), and 292,000 from China (-55.9% YoY), bringing the cumulative total to 10.68 million in three months. Notable is that Taiwan’s spending growth rate (+22.5%) closely mirrors its visitor growth (+24.9%), indicating that Taiwanese visitors represent straightforward demand where headcount gains translate directly into spending gains. By contrast, China showed nearly identical declines in both visitor count (-50.3%) and spending (-50.4%), confirming that the share erosion is not merely a unit price fluctuation. The impact of the China market’s sharp slowdown on regional accommodation demand is examined from another angle in China Down 60%: The Q1 2026 Inbound Mix Shift Reshaping Japan’s Hotel Market.
Why Taiwan’s Top Position Is Also a Warning Sign for Hotel Revenue
That said, the share reshuffle itself cannot simply be interpreted as a tailwind for the hotel industry. The reason lies in differences in per-capita travel spending. Sorting Tourism Agency data by nationality, Western and Australian visitors exceed ¥400,000 per person — France ¥408,000, Australia ¥404,000, Germany ¥399,000 — while Korea sits at the lowest level at ¥104,000, and Taiwan stays in the middle. Even China was at ¥259,000.
In other words, while East Asian visitors who are easier to win in volume are growing their spending share, the average unit price itself is structurally subject to downward pressure. By expense category, accommodation costs reached ¥857.1 billion (36.7% share, up 3.2pt from 33.5% the prior year), gaining presence — but this figure was earned through a combination of hotel price increases and longer stays. Whether each region’s hotels can decouple per-night unit prices from headcount-dependent revenue models is the biggest theme for 2026.
Nationality Concentration Map: Where Are Taiwanese and Korean Visitors Staying?
To translate this spending shift into hotel revenue, we need to grasp where these visitor segments are concentrated within Japan. Cross-referencing multiple municipal and transport bureau publications — Japan Tourism Agency accommodation travel statistics, Fukuoka City tourism statistics, Hokkaido Transport Bureau figures — the following picture emerges.
| Region | Main Concentrated Nationalities | Nationality Share (Reference) | Demand Structure Characteristics |
|---|---|---|---|
| Okinawa | Taiwan, Korea | Taiwan + Korea ≈ 60% of foreign visitors | Short-haul LCC, family travel, multi-night resort stays |
| Fukuoka | Korea (Taiwan, Hong Kong) | Korean entries to Fukuoka City: 57.3% | Weekend short trips, ferry routes, regional tour gateway |
| Hokkaido | Taiwan, Korea, China | Q4: Taiwan 20.9%, Korea 21.1% | Snow demand + summer resort, long-haul high-spend |
| Osaka | Korea, Taiwan, China | Asian visitors dominate | Wide-area tour hub, post-Expo demand reshuffle |
Source: Compiled by HotelBank Editorial Team from Japan Tourism Agency, Fukuoka City Tourism Statistics, Hokkaido Transport Bureau, and Okinawa Prefecture statistics
Okinawa’s foreign visitor base is anchored by Taiwan + Korea, Fukuoka City is dominated by Korean visitors, and Hokkaido shows a balanced three-way distribution with Taiwan and Korea. The greater the presence of Taiwanese and Korean visitors, the easier it is to benefit from the spending shift — but the more visible the ceiling on unit prices becomes, creating a dual-edged dynamic.
Price Sensitivity Map: Q1 ADR YoY Reveals an East-West Divide
So how much did ADR actually move in these regions during Q1 compared to the prior year? Below are the aggregated results for major prefectures tracked by MetroEngines Research where occupancy could be confirmed.
Source: Compiled by HotelBank Editorial Team from MetroEngines Research (N=Tokyo 1,630 properties, Kyoto 1,530, Hokkaido 1,409, Okinawa 1,659, Osaka 863, Fukuoka 700)
Tokyo (+18.4%) and Kyoto (+18.3%) posted overwhelming gains, while Fukuoka stayed at the lowest growth rate of +2.7%. Okinawa was +6.7% and Osaka +6.1% in the middle, with Hokkaido at +11.8%. A clear divergence in “unit-price upside” is emerging between the Golden Route (Tokyo, Kyoto) — heavy with Western, Australian, and high-spend inbound travelers — and regional areas (Fukuoka, Okinawa) populated by short-haul East Asian visitors.
Fukuoka has a Korean share of about 57% of foreign visitors, and maintains visitor volumes that rank among Japan’s largest in actual numbers — yet unit-price growth appears limited. This isn’t weak demand: it reflects a regional characteristic where the median willingness-to-pay among the visitor mix is relatively stable, making the area highly responsive to abrupt price increases.
Monthly Trends: ADR Trajectories of Four Regions
Quarterly averages cannot capture the full picture, so we track monthly. The chart below overlays ADR trends from 2024 through April 2026 by year, comparing regions concentrated with Taiwanese and Korean visitors (Okinawa, Fukuoka, Hokkaido) and a region with high Western/Australian share (Kyoto).
Source: Compiled by HotelBank Editorial Team from MetroEngines Research
Source: Compiled by HotelBank Editorial Team from MetroEngines Research
Source: Compiled by HotelBank Editorial Team from MetroEngines Research
Source: Compiled by HotelBank Editorial Team from MetroEngines Research
Okinawa shows unit prices stepping up cleanly from 2024 through 2026, but with moderate gains and a narrow monthly range. Taiwanese visitors support multi-night resort stays, producing a smoothed annual price curve. Fukuoka shows even stronger flatness, with virtually no upward movement from 2025 levels into Q1 2026. Hokkaido, on the other hand, has clear seasonality — unit prices spike in winter (January–February) on Niseko-area snow demand, then decelerate into April. Kyoto shows step-wise gains across all months from 2024 → 2025 → 2026, vividly illustrating the structure where high-spend foreign visitors push the unit-price ceiling upward.
REIT Cross-Check: Occupancy Holds Firm, but ADR Follows the Nationality Mix
OTA listing prices are demand signals, but actual transacted levels are best confirmed through monthly REIT data. Japan has seven hotel J-REITs: Ichigo Hotel REIT (3463), Invincible Investment Corporation (8963), Japan Hotel & Residential Investment Corporation (3472), Japan Hotel REIT Investment Corporation (8985), Hoshino Resorts REIT (星野リゾート・リート, 3287), Mori Trust Hotel REIT (8961), and Kasumigaseki Hotel REIT (401A) — each publishes monthly operating updates.
As representatives with portfolios spanning regional resorts (Okinawa, Fukuoka, Hokkaido) and urban hotels, we look at the latest monthly figures (from official IR releases) for Japan Hotel REIT Investment Corporation (JHR, 8985) and Hoshino Resorts REIT (3287).
| REIT | Latest Month | Occupancy | ADR YoY | RevPAR YoY |
|---|---|---|---|---|
| Japan Hotel REIT (8985) | 2026/3 | 85.1% (+3.1pt) | +5.0% | +9.0% |
| Hoshino Resorts REIT (3287) | 2026/2 | 76.5% (+1.9pt) | +8.6% | +10.5% |
| Invincible Investment (8963) | 2026/3 | 87.6% (+2.8pt) | +6.0% | +9.0% |
Source: Compiled by HotelBank Editorial Team from each REIT’s monthly operating data
All three REITs maintained occupancy gains versus the prior year, holding 85–88% — and even the resort-heavy Hoshino secured 76.5%. Occupancy resilience confirms that “underlying demand itself is healthy.” Meanwhile, ADR growth came in at +5% to +8.6%, milder than the +18%-class listing-price gains in Kyoto and Tokyo. This is consistent with this article’s argument: J-REITs hold mixed portfolios across regional resorts, regional cities, and suburban locations, and unit-price growth curves flatten in regions weighted toward East Asian visitors.
Implications for Hotel Operators: Rate Strategy Is Tested in Volume-Driven Regions
To summarize so far, the inbound spending shift in Q1 2026 has produced a three-tier structure.
| Tier | Example Regions | Characteristics | 2026 Revenue Opportunities |
|---|---|---|---|
| Rate-Driven Tier | Kyoto, Tokyo | High share of Western/Australian high-spend inbound; Q1 +18% | Premium plans, room category expansion for further upside |
| Mixed Tier | Hokkaido, Osaka | Strong seasonality, diverse mix; Q1 +6 to +12% | High-season-focused dynamic pricing |
| Volume-Driven Tier | Okinawa, Fukuoka | High Taiwan/Korea share; central battleground for spending shift; Q1 +3 to +7% | Maintain occupancy stability + expand ancillary revenue (breakfast, experiences) |
Source: Compiled by HotelBank Editorial Team and MetroEngines Inc.
In the volume-driven tier, raising room rates to Golden Route levels easily exposes price elasticity. In regions where mid-tier Taiwanese and Korean repeat visitors form the core, rather than significantly raising ADR itself, leveraging stable room occupancy to expand ancillary revenue (breakfast, dinner, experience programs, spa, local sake bars, etc.) is likely to offer greater upside in total revenue. The Tourism Agency data show that food & beverage (22.9%) and shopping (25.2%) still account for substantial shares beyond accommodation, supporting this direction.
Meanwhile, in rate-driven tier areas like Kyoto and Tokyo, premium pricing aimed at capturing high-spend Western/Australian demand is already functioning. The next phase calls for finer room-category segmentation, investment in suites and connecting rooms, and differentiation through dedicated services — extending the upper end of the price range to unlock further revenue opportunities.
Checkpoints for Q2 2026 and Beyond
The data in this article point to three issues worth monitoring. First, the return of Chinese visitors. If flight services recover or government policies change, headcount and spending could rebound sharply in tandem, with room for further acceleration in Golden Route ADR growth. Second, the post-Expo demand transition in Osaka. Osaka’s ADR — which benefited from Expo demand in 2025 — settled at +6.1% in Q1 2026, easing back to ¥26,800 in April alone. The landing into normalized demand after the Expo will be a touchstone for Kansai hotel operations. How Osaka’s ADR moved during the Expo period across REIT and OTA data is examined in detail in Osaka Expo’s Impact on Hotel ADR: REIT and OTA Data Analysis. Third, summer peak (July-August) pricing. ADR typically jumps in Q3 in Okinawa and Hokkaido, and we’ll continue to monitor how seasonal intensity is reflected in OTA listings for future check-in dates.
Note on future-dated ADR: The monthly ADR data in this article includes actuals through April 2026, while prices for May onward are OTA-listed values at the time of survey, which fluctuate as check-in dates approach. Prices set high at this point may drop closer to the date through last-minute discounting, and post-Expo demand reversion risk persists in Kansai. For booking pace and FX sensitivity in three resort regions (Niseko, Okinawa, Karuizawa), Summer Resort Comparison 2026: Niseko, Okinawa, Karuizawa provides supplemental area-level resolution.
Summary
The essence of Q1 2026’s ¥2.3 trillion inbound spending figure lies in the share reversal that put Taiwan in the top spot, and the regional differences in unit-price sensitivity that underpin it. Volume-driven regions like Okinawa and Fukuoka benefit from the spending shift but show only mild unit-price growth — for hotel operators here, expanding ancillary revenue and customer LTV is the next move. By contrast, rate-driven regions like Tokyo and Kyoto have posted +18% surges on the back of Western/Australian visitor share, with further upside available through range expansion.
Reframing demand by “visitor segment × price sensitivity” rather than by “headcount” is the perspective that will differentiate hotel revenue design in 2026. While monitoring three ongoing dynamics — China’s recovery, post-Expo reversion, and summer peak intensity — operators are called upon to refine the precision of unit-price strategies tailored to their target customer segments.
Related Articles & References
- Japan Tourism Agency: Inbound Consumption Trend Survey Q1 2026 (First Preliminary Report)
- JNTO: Foreign Visitor Arrivals (March 2026 Estimates)
- HotelBank: Market Trends Top
Related Reading
- Tokyo, Nagoya, Osaka, Fukuoka Weekday ADR Analysis: Visualizing the Return of Business Demand
- Osaka Expo’s Impact on Hotel ADR: REIT and OTA Data Analysis
- China Down 60%: The Q1 2026 Inbound Mix Shift Reshaping Japan’s Hotel Market
- May 2026 Inbound Booking Trends: Western and Southeast Asian Visitors Lift Regional ADR
- Summer 2026: Okinawa, Hokkaido, Kyoto Hotel Price Comparison — When Is the Best Time to Book?
- Policy vs. Real Demand: Tokyo, Osaka, and Fukuoka Nightlife District Hotel Comparison
- Summer Resort Comparison 2026: Niseko, Okinawa, Karuizawa — ADR, Booking Pace, FX Sensitivity
- China Labour Day 5/1-5/5 Holiday: Will “Labour Day Bookings” Grow Despite -60% Visitor Decline? An OTA Price Analysis