

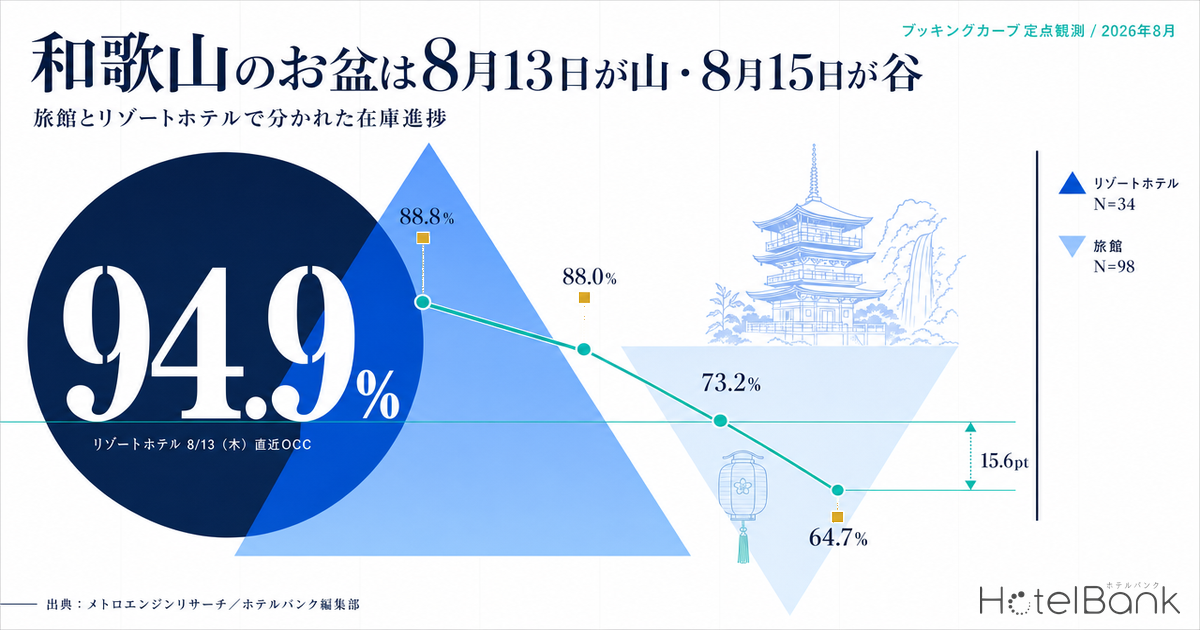
Looking at the inventory pace for Wakayama’s four Obon nights (August 13–16) from 45 days before each stay date through the latest observation, the shape that emerges differs from the “August 14–15 peak” most people assume. For resort hotels (N=34 properties, 2,223 rooms), estimated OCC is strongest on Thursday, August 13 — 73.1% at 45 days out, 79.0% at 30 days out, and 94.9% at the latest reading — with a sold-out property rate of 64.7%. Saturday, August 15, by contrast, runs 62.8% at 45 days out, 68.4% at 30 days out and 88.0% most recently, with a sold-out property rate of just 23.5%. Ryokan (N=98 properties, 3,644 rooms) show an even wider spread: August 13 has reached 88.8%, while August 15 went from 65.3% at 45 days out to 65.0% at 30 days out — effectively flat — and stands at 73.2% even now. Obon in Wakayama peaks on August 13 and troughs on August 15, and the depth of that trough, along with how it fills, moves in opposite directions for ryokan and resort hotels.
Scope: Wakayama ryokan N=98 properties (3,644 rooms) and resort hotels N=34 properties (2,223 rooms). Price figures in this article are estimated settled ADR (the transaction price level inferred from OTA and other sales data, on a pre-tax equivalent basis); occupancy is an estimate based on OTA-listed inventory. Both definitions appear at the end of the article. Data as of August 4, 2026.
- — Thursday, August 13 is the peak — resort hotels (N=34 properties) are at 94.9% estimated OCC with a 64.7% sold-out property rate. Saturday, August 15 sits at 88.0% and 23.5%, the trough of the four nights.
- — Ryokan were flat on August 15 until 30 days out — 65.3% at 45 days out, 65.0% at 30 days out, and only 73.2% at the latest reading. Movement starts around 25 days out.
- — The peak-to-trough gap moves in opposite directions by category — resort hotels narrowed it from 10.3pt to 6.9pt; ryokan widened it from 9.1pt to 15.6pt.
- — The late window carries different upside — pickup from 30 days out to the latest reading is +10.3 to +19.6pt for resort hotels versus +4.9 to +11.0pt for ryokan.
- — The usual day-of-week shape is inverted — in July 2026 Saturday was strongest in Wakayama (resorts 95.2%, ryokan 92.8%), but over Obon Thursday is strongest and Saturday weakest.
Booking Curves Across the Four Obon Nights — Aug 13 Peaks, Aug 15 Troughs
Start with the four resort-hotel nights, overlaid as booking curves running from 45 days before the stay date to the latest observation. The X axis is days remaining until the stay date (45 days out at the left, the latest reading at the right); the Y axis is estimated OCC (OTA-listed inventory basis).
Source: MetroEngines Research; compiled by the HotelBank Editorial Team
The ranking among the four lines is already set at 45 days out: Thursday, August 13 leads at 73.1%, followed by Friday, August 14 at 70.3%, Sunday, August 16 at 68.8% and Saturday, August 15 at 62.8%. That is the inverse of the normal weekend shape, in which Saturday is strongest — for Wakayama resort hotels, the Saturday of Obon had the weakest starting point of the four nights. And that order holds almost unchanged across the full 45 days. The slope at the right edge, however, differs by night: August 15 turns up sharply from roughly 20 days out to reach 88.0%, while Sunday, August 16 climbs most gently, ending at 84.4%. Saturdays turning into the trough over Obon is not unique to Wakayama — the same three-checkpoint comparison shows that among Hokkaido city hotels, August 15 alone dips below the other August Saturdays.
Draw the same picture for the 98 ryokan and the outline changes considerably.
Source: MetroEngines Research; compiled by the HotelBank Editorial Team
Ryokan start August 13 at 74.4% at 45 days out — higher than resort hotels — but finish at 88.8%, short of the resorts’ 94.9%. August 15 is the more distinctive case: 65.3% at 45 days out to 65.0% at 30 days out, a decline of 0.3 points over 15 days, with no upward movement at all. In fact the series rises to 66.8% within that window before falling back into the 64% range — a pattern that requires either booked rooms being returned or new inventory being released. Ryokan’s August 15 only begins to move around 25 days out, adding roughly eight points from there to reach 73.2% at the latest reading.
The table below summarizes the four nights and two categories at three checkpoints: 45 days out, 30 days out, and the latest reading.
| Category / stay date | 45 days out | 30 days out | Latest | 45 days out → latest | Sold-out property rate (latest) |
|---|---|---|---|---|---|
| Resort hotels (N=34 properties, 2,223 rooms) | |||||
| Aug 13 (Thu) | 73.1% | 79.0% | 94.9% | +21.8pt | 64.7% |
| Aug 14 (Fri) | 70.3% | 74.2% | 93.3% | +23.0pt | 41.2% |
| Aug 15 (Sat) | 62.8% | 68.4% | 88.0% | +25.2pt | 23.5% |
| Aug 16 (Sun) | 69.9%* | 74.1% | 84.4% | +14.5pt | 11.8% |
| Ryokan (N=98 properties, 3,644 rooms) | |||||
| Aug 13 (Thu) | 74.4% | 77.8% | 88.8% | +14.4pt | 41.8% |
| Aug 14 (Fri) | 72.3% | 74.2% | 83.4% | +11.1pt | 31.6% |
| Aug 15 (Sat) | 65.3% | 65.0% | 73.2% | +7.9pt | 20.4% |
| Aug 16 (Sun) | 67.0%* | 69.5% | 74.4% | +7.4pt | 14.3% |
Estimated OCC (OTA-listed inventory basis). “Latest” = the observation as of August 2, 2026 (11–14 days before the stay date). Because the most recent observation date covered too few properties, the prior day’s reading was used. *For August 16 only, the observation date corresponding to 45 days out covered too few properties, so the reading at 44 days out was used. Observed property counts range as follows: the 45-days-out column covers 30–31 resort hotels and 77–84 ryokan; the 30-days-out column covers 30–31 resort hotels and 82–89 ryokan; the latest column covers 34 resort hotels and 95 ryokan. Sold-out property rate = the share of properties with no listed inventory identifiable on OTAs and similar channels (estimate).
Source: MetroEngines Research; compiled by the HotelBank Editorial Team
Did the Trough Fill In? Resorts Narrowed the Gap, Ryokan Widened It
The three-checkpoint table reveals a deeper difference: how the gap between the peak (August 13) and the trough (August 15) moved across those 45 days. For resort hotels it ran 10.3 points at 45 days out, 10.6 points at 30 days out, and 6.9 points at the latest reading — narrowing over the final two weeks. That is the shape of chasing the trough night after the fact, with some success. Ryokan went the other way: 9.1 points at 45 days out, 12.8 points at 30 days out, 15.6 points at the latest reading — the gap widened as time passed. The trough stayed a trough while only the peak night accumulated bookings.
The same difference shows up in the size of the pickup itself. Over the roughly 15 days from 30 days out to the latest reading, resort hotels added +15.9 points on August 13, +19.1 points on August 14, +19.6 points on August 15 and +10.3 points on August 16. Ryokan added +11.0, +9.2, +8.2 and +4.9 points over the same window — roughly half the absolute pickup. Resort hotels carry substantial upside in the final two weeks, while for ryokan the position at 45 days out largely carries through to where the night lands. How the level at 45 days out relates to remaining late-window upside is also examined side by side across categories in our analysis of Tochigi booking curves by property type for August–September 2026.
By sold-out property rate, August 13 currently stands at 64.7% for resort hotels and 41.8% for ryokan. August 15, meanwhile, is at 23.5% for resort hotels and 20.4% for ryokan, and August 16 at just 11.8% and 14.3% — one to two properties in ten. In other words, even over Obon, inventory in Wakayama is genuinely exhausted only on August 13 (and, for resort hotels, August 14); on August 15 and 16 most properties still hold rooms.
It is worth layering in day-of-week context here. The table below sets estimated OCC by day of week for July 2026 — the most recently completed month, excluding one day with thin observation coverage, so 30 days in total — against the latest snapshot for the four Obon nights. Note that July represents settled actuals while the four Obon nights are an unsettled snapshot with nearly two weeks still to run; even so, the distance from the level a given weekday would normally command is visible.
| Day of week | July actual Resorts |
July actual Ryokan |
Corresponding Obon night | Latest snapshot Resorts |
Latest snapshot Ryokan |
|---|---|---|---|---|---|
| Thursday | 77.9% | 81.2% | Aug 13 | 94.9% | 88.8% |
| Friday | 86.7% | 85.6% | Aug 14 | 93.3% | 83.4% |
| Saturday | 95.2% | 92.8% | Aug 15 | 88.0% | 73.2% |
| Sunday | 85.4% | 87.1% | Aug 16 | 84.4% | 74.4% |
| Monthly average | 83.0% | 83.9% | — | — | — |
July actual = the day-of-week average of daily estimated OCC for July 2026 (30 days, excluding one day with observation coverage below 50%; 31–34 resort hotels and 77–98 ryokan observed). Latest snapshot = observed values as of August 2, 2026, still unsettled. Because the two rest on different bases (settled actuals versus in-progress pace), they should be read as directional reference rather than as a straight comparison of levels.
Source: MetroEngines Research; compiled by the HotelBank Editorial Team
July in Wakayama shows the classic leisure-market weekday shape, with Saturday strongest for both resort hotels and ryokan (95.2% and 92.8%). Held against that yardstick, Thursday, August 13 sits unusually high for a Thursday, while Saturday, August 15 has yet to reach the level a Saturday would normally command. Ryokan’s 73.2% on August 15 is a long way from July’s Saturday figure of 92.8%. It may of course fill over the remaining two weeks — but the assumption that “it’s a Saturday over Obon, so it will fill on its own” is not supported by the data as it stands.
August Estimated Settled ADR and the Shape of Wakayama’s Year
The price side is worth checking too. Overlaying Wakayama’s monthly estimated settled ADR for 2025 and 2026, August stands out clearly for resort hotels, while ryokan take a somewhat different, twin-peaked shape.
Source: MetroEngines Research; compiled by the HotelBank Editorial Team
Comparing settled figures year over year, July 2026 — the most recent settled month — came in at ¥13,400 for ryokan (N=106 properties) against ¥13,000 a year earlier (N=107 properties), up 2.7%, and ¥16,000 for resort hotels (N=34 properties) against ¥14,500 (N=37 properties), up 11.0%. The resort-hotel increase far outpaces ryokan. The preceding month, June 2026, ran the other way for ryokan: ¥11,000 (N=110 properties) against ¥12,400 a year earlier (N=108 properties), down 11.3%, while resort hotels posted ¥13,500 (N=34 properties) against ¥13,100 (N=38 properties), up 2.9%. Ryokan swing widely month to month; resort hotels sit consistently above the prior year.
For August 2026, estimates based on current sales conditions put ryokan at ¥15,500 (N=103 properties) and resort hotels at ¥18,800 (N=34 properties). For reference, settled figures for August 2025 were ¥16,000 for ryokan (N=105 properties) and ¥21,600 for resort hotels (N=36 properties) — though comparing settled values directly against a current estimate requires waiting for the month to close. Across the year, ryokan are close to twin-peaked, with August and December nearly level (2025 settled: August ¥16,000, December ¥16,200), while resort hotels concentrate sharply in August (2025 settled: August ¥21,600, well above the second-place December at ¥17,200). Within the same prefecture, in other words, ryokan carry a second peak around the year-end holidays while resort hotels cluster their year into the summer. Current estimates for September are ¥13,800 for ryokan (N=100 properties) and ¥16,200 for resort hotels (N=34 properties) — both a steep drop from August. The supply mix behind this seasonality differs between the two categories as well: Wakayama’s inventory is weighted toward ryokan by property count, while resort hotels hold the higher price band and the more concentrated summer demand.
For Revenue Managers Running Ryokan and Resort Hotels in Wakayama — Implications and Action Plan
(a) Operational insights
1. Break the “Obon as one four-night block” design back down by date. At the latest snapshot, market estimated OCC runs 94.9% on August 13 versus 88.0% on August 15 for resort hotels, and 88.8% versus 73.2% for ryokan — a wide spread within the same holiday period. Lay your own four Obon nights out on a single page and check whether you are applying the same inventory policy and the same minimum-stay conditions to the 13th and the 15th. The market’s sold-out property rate differs by more than a factor of two as well: the 13th (resorts 64.7%, ryokan 41.8%) versus the 15th (23.5% and 20.4%).
2. Read your own booking pace by asking which market curve it is tracking. The two booking curves here show how the market progresses at three checkpoints — 45 days out, 30 days out and the latest reading. Overlaying your own booked position at those same three points separates “we are behind” from “this is simply how this date behaves in Wakayama.” Resort hotels in particular add +10.3 to +19.6 points between 30 days out and the latest reading, so judging on the 30-days-out number alone tends to understate where the night will land.
3. For ryokan, August 15 is a date where 45 days out and 30 days out should not lead to the same decision. Ryokan ran flat on August 15 — 65.3% at 45 days out to 65.0% at 30 days out — and only began moving around 25 days out. Concluding from an unmoving market at 45 days out that demand is absent means missing the later ramp. Conversely, if the flat line is still flat at 30 days out, that is within the market’s normal shape, and the difference will come from how the final window is designed — how inventory is released and what stay conditions apply.
4. Keep July actuals as your day-of-week yardstick. In July, Saturday was strongest in Wakayama (resorts 95.2%, ryokan 92.8%) and Thursday among the weakest (77.9% and 81.2%). Obon inverts that normal shape, so applying year-round day-of-week pricing and inventory rules unchanged makes the opposite error easy — selling the 13th cheap and holding the 15th expensive. On monthly estimated settled ADR, August is either the annual peak (resorts) or one of two peaks (ryokan), and the drop from August to September is steep as well (current estimates: ryokan ¥13,800, resorts ¥16,200).
5. Use a monthly yardstick for price and a daily one for inventory. Estimated settled ADR is a monthly measure; day-level price differences cannot be read from market data. If you want to benchmark your August rates against the market, check where your own August outlook sits relative to the monthly average picture (ryokan ¥15,500, resort hotels ¥18,800, both current estimates), and make date-level calls on the inventory-pace side. That division of labor is the realistic one.
(b) Action plan: with limited time left before Obon itself, the horizons below are organized in three tiers — “today through this week,” “the final week,” and “September onward and next year’s setup.”
| Time horizon | Move | Decision trigger | Objective |
|---|---|---|---|
| Today through this week | Consider room to relax consecutive-night requirements and minimum-stay conditions on August 15 and 16 down to single nights | If your booked position for the 15th and 16th sits below the market’s latest snapshot (ryokan 73.2% / 74.4%, resorts 88.0% / 84.4%) | Open the door to capturing the two trough nights on their own |
| Today through this week | Re-check how remaining August 13 inventory is being sold (any rooms left closed, or blocked by conditions) | If the market’s sold-out property rate for the 13th has reached 64.7% for resorts and 41.8% for ryokan while you still hold rooms | Avoid leaving demand on the table on the most concentrated night |
| Today through this week | Shift exposure weighting by date, moving messaging centered on the 13th toward the 15th and 16th | If you are running the same message and the same listing conditions across all four nights | Redirect exposure from the nights that are full to the nights that are not |
| The final week | For resort properties, price in late-window pickup and phase any easing of conditions rather than moving too early | Because resort hotels in the market added +10.3 to +19.6 points between 30 days out and the latest reading — and if your own property is seeing comparable pickup | Preserve late demand while easing only as much as needed |
| The final week | For ryokan properties, set a calendar deadline in advance for the decision to ease conditions on remaining August 15 inventory | If the market’s ryokan figure for August 15 has moved from 65.0% at 30 days out to only 73.2%, a pickup of just +8.2 points | Avoid drifting into the arrival date still “waiting and seeing” |
| September onward and next year’s setup | Rebuild the Obon date calendar on the premise that the 13th is the peak and the 15th and 16th are troughs, and reflect that in inventory design at 45 days out | If you are planning to apply year-round day-of-week rules (July actuals put Saturday strongest) unchanged to the same period next year | Improve the accuracy of the initial allocation at 45 days out |
| September onward and next year’s setup | Lock the September rate-revision calendar early, assuming the step down from August | If current market estimates put September at ¥13,800 for ryokan and ¥16,200 for resorts, clearly below August (¥15,500 and ¥18,800) | Avoid carrying summer peak settings forward |
Because estimated settled ADR is a monthly measure, the price-related decision triggers above should likewise be used as positions relative to a monthly level. No outcome is guaranteed.
Summary — Three Yardsticks to Take Away
Yardstick 1: Break Obon down by date. At the latest snapshot, Wakayama’s four Obon nights span 94.9% to 84.4% for resort hotels and 88.8% to 73.2% for ryokan — a wide day-to-day spread. The ordering, with Thursday, August 13 as the peak and Saturday, August 15 as the trough, is the inverse of the normal weekend shape. Any design that treats the four nights as a single block starts out less accurate than it needs to be in this market.
Yardstick 2: The checkpoint that matters differs by category. Resort hotels add +10.3 to +19.6 points between 30 days out and the latest reading, while ryokan add only +4.9 to +11.0 points over the same window. Using the 30-days-out number as a landing forecast understates resort properties; for ryokan, the position at 45 days out carries through. Even with the same three checkpoints — 45 days out, 30 days out and the latest reading — which one anchors the decision should change by category.
Yardstick 3: Watch whether the peak-to-trough gap is narrowing or widening over time. The gap between August 13 and August 15 went 10.3pt → 10.6pt → 6.9pt for resort hotels, narrowing, and 9.1pt → 12.8pt → 15.6pt for ryokan, widening. Because that trajectory compares observations taken on the same dates, it stays readable regardless of how the overall market level moves. Whether the gap between your own peak and trough nights is narrowing or widening over time is the simplest and most reliable signal of whether your moves on the trough night are working.
About the Data
| Item | Detail |
|---|---|
| Definition of estimated OCC | Occupancy on an OTA-listed inventory basis = 100 − 100 × rooms still listed on OTAs ÷ total rooms. It is an estimate based on how listed inventory is being absorbed and is defined differently from actual room occupancy (it reads higher). This article labels it “estimated OCC (OTA-listed inventory basis).” |
| Booking curve | Based on observations from 45 days before the stay date through the latest reading. Scope is the four stay dates of August 13, 14, 15 and 16, 2026, with an observation window running from 45 days before each stay date to August 2, 2026. |
| Day-of-week actuals | Day-of-week averages of daily estimated OCC for July 2026 (a completed month), aggregated over 30 days after excluding one day with observation coverage below 50%. |
| Definition of estimated settled ADR | A transaction price level (pre-tax equivalent) inferred from OTA and other sales data (lowest-plan levels × category-specific coefficients, ensembled across multiple channels). Past months are settled values; the current and future months are estimates based on present sales conditions. Median error against published operating results is 6.6%. |
| Breakdown of N | Inventory pace: Wakayama ryokan N=98 properties, 3,644 rooms; resort hotels N=34 properties, 2,223 rooms. Observed property counts vary by day, ranging from 77 to 98 ryokan and 30 to 34 resort hotels. Estimated settled ADR: ryokan N=97–112 properties (varying by month; N=103 for August 2026), resort hotels N=34–38 properties (N=34 for August 2026). |
| Sold-out property rate | The share of properties with no listed inventory identifiable on OTAs and similar channels (estimate). |
| Data as of | Data as of August 4, 2026. Because sales conditions and inventory change daily, the figures in this article are a snapshot at the time of retrieval. |
Source: MetroEngines Research; compiled by the HotelBank Editorial Team
■ Data sources
Daily observation of OTA-listed inventory for Wakayama ryokan N=98 properties (3,644 rooms) and resort hotels N=34 properties (2,223 rooms) (stay dates August 13–16, 2026, with an observation window from 45 days before each stay date to August 2, 2026); monthly estimated settled ADR by category for the same prefecture (January 2025 to September 2026); and daily estimated OCC for July 2026. All figures are data aggregated by MetroEngines Research & Consulting. Data as of August 4, 2026.
■ Calculation assumptions
Estimated OCC = 100 − 100 × rooms still listed on OTAs ÷ total rooms. The three checkpoints are 45 days out, 30 days out and the latest reading, with “latest” taken as the observation as of August 2, 2026 (11–14 days remaining). Because the most recent observation date covered too few properties, the prior day’s reading was used; for August 16 only, the observation date corresponding to 45 days out covered too few properties, so the reading at 44 days out was used. Day-of-week actuals are aggregated over 30 days of July 2026, excluding one day with observation coverage below 50%. Estimated settled ADR is a monthly measure: past months are settled values, and August 2026 onward are estimates based on present sales conditions. Year-over-year comparisons were calculated only between settled values.
■ Limitations and caveats
Estimated OCC is an estimate on an OTA-listed inventory basis and is defined differently from actual room occupancy (it reads higher). Because observed property counts vary by day (77–98 ryokan, 30–34 resort hotels), comparisons between snapshots may embed differences in observation depth. The four Obon nights are an unsettled in-progress snapshot with nearly two weeks still to run, resting on a different basis from July 2026’s settled actuals, so they should not be used for a straight comparison of levels. Day-level price levels cannot be read from monthly estimated settled ADR, and this article does not address day-level listed prices. The sold-out property rate is the share of properties with no listed inventory identifiable on OTAs and similar channels (estimate), and does not distinguish between a property being sold out and having stopped selling.
Related Reading
- Hokkaido City Hotels: Only Aug 15 Trails at 78.7% OCC, 45 Days Out
- Tochigi Booking Curves by Type: Resort 81.1% at T-45, Only +2.6pt Left
- Nagano Late-Summer Booking Curve 2026: Ryokan -11.8pt at 45 Days Out
- Okinawa Late-Summer Booking Curve 2026: Sep 5 Beats Obon, City +4.7pt
- Osaka Obon 2026 Booking Curve: Aug 14 at 74.9%, Aug 16 Stuck at 64.1%