

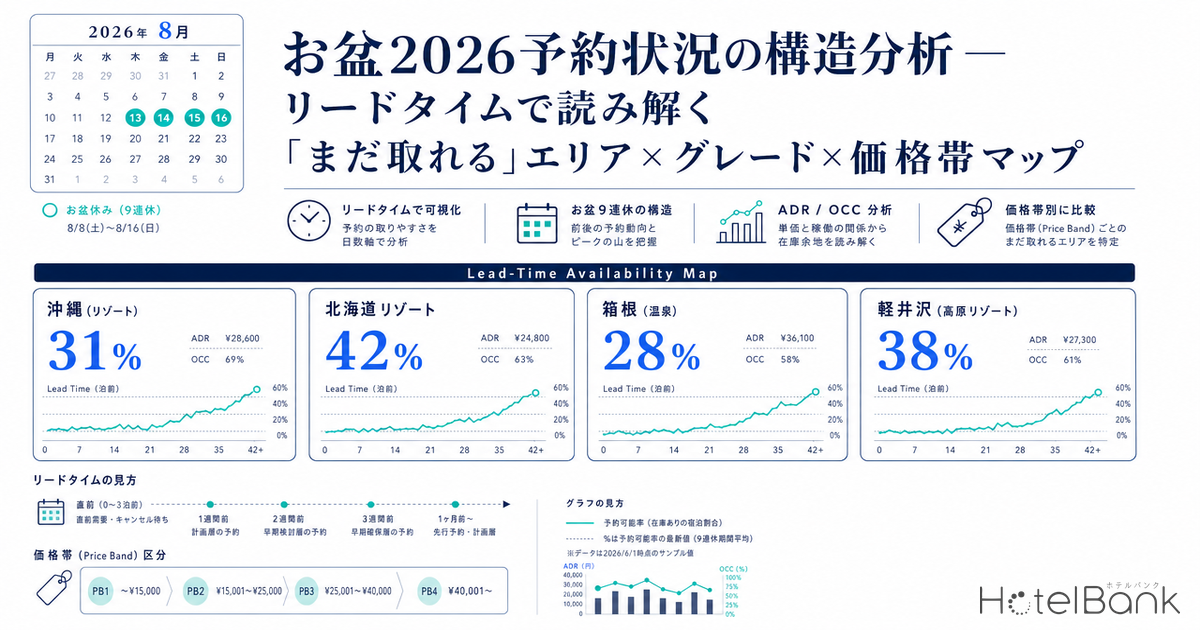
The 2026 Obon holiday falls in a rare year where the calendar alignment makes a 9-day consecutive break possible. With the weekend of August 8 (Sat) – 9 (Sun), paid leave on August 10 (Mon), the Mountain Day holiday on August 11 (Tue), and another paid day off on August 12 (Wed), travelers can string together the Obon core days of August 13–16 and August 17 (Mon) for a total 9-day long vacation. In this article, we use MetroEngines Research’s nationwide OTA public price data to analyze, at the survey snapshot (May 11, 2026 — 3 months out from check-in), the booking status of the four major resort areas (Okinawa Prefecture / Hokkaido resort municipalities / Hakone / Karuizawa) through a lead-time lens. Reading the “OCC at LT-94 days” snapshot in isolation leads to misjudgment, so this article jointly examines the pickup curve over the past three weeks (Apr 19 → May 12) and the velocity (pp/day) during the five days after Golden Week (May 7 → May 12), reframing the structure not by “how full” but by “how fast it is filling.” Before giving up with “we can’t get a room anymore,” we use quantitative data to surface the structural difference between the early sell-out tier and the late-availability tier — which area × grade × price band still has runway.
Metric Definitions Used in This Article
- ADR (Average Daily Rate): Average of the public selling prices listed on OTAs. Differs from actual transacted prices (cross-referenced with REIT disclosure data, public OTA ADR runs about +25 to +30% above transacted ADR). Per-room price for 2-person occupancy (tax included), averaged across all plans (room-only through meal-included). N=2,146 properties
- OCC (Occupancy): Ratio of sold rooms to total rooms in the area (estimate based on OTA inventory). In this article, calculated as the share of sold-out plans for a given check-in date. N=2,146 properties
- Lead Time (LT): Days remaining until check-in. From the survey snapshot date (May 11, 2026), an August 13–14 check-in is approximately 94–95 days out.
- Pickup Curve: How OCC for a given check-in date evolves over snapshot dates. In this article, we track daily OCC from 2026/4/19 to 5/12 (using only days with coverage ≥85%). April 19 was used as the starting point because scraping coverage for the four areas (especially Hokkaido) was unstable before then; we therefore limit the window to the 23 days from April 19 onward when coverage stabilized. N=626 properties (inventory-history tracked subset)
- Pace (pp/23 days, pp/day): OCC point change over Apr 19 → May 12 (23 days), and the daily velocity over the 5 days after Golden Week (May 7 → May 12). A metric that captures “speed” independently of the absolute OCC level. N=626 properties (same set as the pickup curve)
- Data Source: MetroEngines Research
Sample Size Detail (Area × Metric)
| Metric / Aggregation Scope | Okinawa | Hokkaido Resort | Hakone | Karuizawa | 4-Area Total |
|---|---|---|---|---|---|
| Snapshot OCC / ADR (chart1–5, as of 2026/5/11) | 1,484 | 263 | 235 | 120 | 2,146 |
| Pickup Curve / Velocity (chart_pickup, 2026/4/19 → 5/12) | 406 | 75 | 104 | 41 | 626 |
| Pace Index by Grade (chart_pace, segments with ≥15 properties) | 402 | 48 | 73 | 18 | 541 |
Pace Index Segment N (chart_pace legend)
- Karuizawa Luxury: N=18
- Hokkaido Luxury: N=28
- Okinawa Luxury: N=66
- Hakone Luxury: N=73
- Okinawa Upper: N=126
- Okinawa High-Grade: N=39
- Okinawa Economy: N=47
- Okinawa Budget: N=124
- Hokkaido Upper: N=20
* The snapshot aggregation (N=2,146) is based on sold-out plan share, while the pickup / pace aggregation (N=626) is based on the hotel-level sold-out ratio of the inventory-history tracked subset. Because the denominators differ, the two absolute levels should not be directly compared — read them respectively as the “current position” and “speed” indicators.
The 2026 Obon Calendar and the Structure of Booking Behavior
The core of the 2026 Obon holidays falls on August 13 (Thu) through August 16 (Sun). Combining the prior weekend (Aug 8–9), paid leave on August 10 (Mon), the Mountain Day holiday on August 11 (Tue), and paid leave on August 12 (Wed) yields a maximum 9-day consecutive break; a longer break starting from August 6 (Thu) is also feasible. HIS and JTB summer travel feature pages urge early booking with messages like “popular ryokans sell out fast,” and domestic tour and lodging plans typically begin full-scale sales 3 to 6 months in advance. In other words, the survey snapshot of this article (mid-May) sits between the “starting to fill” stage and the “just before the final push” stage for Obon peak-day inventory.
Moreover, according to JNTO (Japan National Tourism Organization) inbound visitor statistics released in April 2026, inbound arrivals reached 3.61 million in March 2026 — a record high for the month of March — and the cumulative January–March total reached 10.68 million, surpassing 10 million by April for the second consecutive year. The structure is one in which growth from Korea, Taiwan, Southeast Asia, and the U.S. offsets the halving of the China market, and summer inbound demand is expected to remain high. Meanwhile, since airfares peak in the July–September window, long-distance travel by families is suppressed, and domestic lodging demand concentrating in mid-range resorts is expected to continue this year as well.
The Four Major Resort Areas — Current Snapshot for the Obon Peak Days (8/13–14)
First, the big picture. Aggregating August 13–14 check-ins for the four target areas in MetroEngines Research, there is a pronounced gap in OCC across areas. The most advanced booking absorption is in Hakone at OCC 46.3%, followed by Hokkaido Resort (Niseko, Kutchan, Furano, Lake Toya) at 39.9%, Karuizawa at 30.3%, and Okinawa at 26.4%. At the same time, average ADRs are also high at ¥143,000 in Karuizawa and ¥127,400 in Hakone, clearly showing that the traditional summer-retreat destinations with easy access from the Tokyo metro area fill up earliest. For the structural summer comparison centered on Niseko, Okinawa, and Karuizawa, we have analyzed it from the three axes of ADR, booking pace, and FX sensitivity in Summer Resort Three-Region Comparison 2026: Niseko, Okinawa, Karuizawa.
Source: MetroEngines Research, compiled by HotelBank Editorial Team (2026/8/13–14 check-ins, N=2,146 properties, survey date 2026/5/11)
Compared with the same period last year (August 13–14, 2025 check-ins), ADR is up across all areas: Hakone +20.1%, Okinawa +16.9%, Karuizawa +8.7%, and Hokkaido Resort +7.6%. The fact that Hakone’s ADR increase stands out is particularly noteworthy. The absorption capacity of the same-day-trip-range Tokyo metro market combined with the supply lock-in of high-grade ryokans has structurally pushed prices upward.
Source: MetroEngines Research, compiled by HotelBank Editorial Team (2025/8/13–14 vs 2026/8/13–14 ADR comparison)
Reading OCC by “Pace” Rather Than Absolute Level — The Sharp Acceleration in the 5 Days After Golden Week
Looking only at the snapshot values above (Hakone 46.3%, Hokkaido 39.9%, Karuizawa 30.3%, Okinawa 26.4%) and concluding that “Hakone is nearly full / Okinawa is still wide open” misreads the lead-time structure. For the same four areas, OCC moved roughly sideways from April 19 to May 7 (three weeks), then sharply accelerated by +35 to +60 pp over the five days after Golden Week (from Friday May 8). Booking consumption for Obon peak days hardly progressed during Golden Week itself; the shape transformed once a wave of post-holiday bookings concentrated. Separating “current OCC level” from “speed at which the last 5 days sold” is essential.
Source: MetroEngines Research, compiled by HotelBank Editorial Team (OCC trajectory for 2026/8/13 check-ins, 4 areas × 12 days, only days with coverage ≥85% included, hotel-level sold-out ratio, N=678 properties; note: absolute levels differ from the sold-out-plan-share values used elsewhere in the article)
From April 19 to May 7 (19 days), all four areas were roughly flat — Okinawa 7–9%, Hokkaido 4–7%, Karuizawa 11–20%, Hakone 13–15% — fluctuating within the band, but the trend was stagnant. This suggests that travelers in the run-up to and during Golden Week were not yet thinking about Obon plans. The change began on May 8 (the Friday two days after the final day of Golden Week), and over those five days Karuizawa gained +50.9 pp (20.5 → 71.4%), Hakone +50.3 pp (14.4 → 64.7%), Okinawa +38.8 pp, and Hokkaido +35.9 pp. This is a textbook demand pattern: “the moment a 3-month-out plan comes into view, families and groups rush to lock in their Obon hotels at once.”
| Area | 5/7 OCC (pre-post-GW) |
5/12 OCC (snapshot date) |
5-day Δ (pp) |
pp/day | Reading |
|---|---|---|---|---|---|
| Karuizawa | 20.5% | 71.4% | +50.9 | +10.2 | Fastest → maximum room for raising residual inventory prices |
| Hakone | 14.4% | 64.7% | +50.3 | +10.1 | Mid OCC × fastest → immediate price-raise window |
| Okinawa | 7.0% | 45.8% | +38.8 | +7.8 | Rapid rise from a low base → classic “looks empty” misread |
| Hokkaido Resort | 4.1% | 40.0% | +35.9 | +7.2 | Late-bloomer → moved sharply after Golden Week |
The 5-day velocity is based on raw daily readings (coverage ≥85%) on 5/7 (immediately post-GW, before booking activity resumed) and 5/12 (snapshot date). It uses a different aggregation method from the snapshot OCC values in the main text (46.3% etc.), but the pace comparison is denominator-independent.
Taking Okinawa as an example: OCC stagnated around 8% during the three weeks April 19 → May 7, then jumped +38.8 pp in the five days after Golden Week to reach 45.8%. If this pace (7.8 pp/day) were to continue linearly, OCC would exceed 90% by LT-80 days (around May 26). (However, since demand traces an S-curve rather than continuous acceleration, the realistic outcome is more likely 80% by late June, with the pace easing from July onward.) Conversely, Hakone’s 46.3% — already “high” — also progressed from 14% to 65% over the same 5 days, suggesting that the post-Golden-Week wave, not the early-booking wave, ultimately decided the outcome.
Within-Area Lead-Time Structure — Daily OCC Curves Across 8/8 to 8/17
Next, we track the daily OCC over the Obon period (August 8–17). The “fill mountain” differs distinctly by area. Hakone peaks at 47.9% on August 14 (Fri, Obon core day); Karuizawa and Hokkaido Resort maintain a plateau at high levels in the early-Obon span (August 10–13); Okinawa gently declines from the core day (August 14); from August 16 (Sun) onward, all areas drop sharply, and by August 17, Hakone falls to 32%.
Source: MetroEngines Research, compiled by HotelBank Editorial Team (8/8–17 daily OCC, 4 areas, N=2,146 properties)
This daily curve offers important insights to both consumers and booking managers. Competition peaks on the Obon core days (Aug 13–15) when families can naturally combine going home and travel; meanwhile, August 16 (Sun) night and August 17 (Mon), the first day after Obon, are surprisingly relaxed. With remote work having become widespread, “staying through August 16–17” has become a realistic option for those who can delay returning to the office until midweek. For empirical analysis of ADR fluctuations by lead time in the run-up to long weekends, see our GW 2026 study (details in GW 2026 Last-Minute Rush Demand: ADR Movement Analysis by Lead Time).
Early Sell-Out Structure by Grade — High-Grade Ryokans and Luxury Lead the Way
Decomposing into grade (hotel tier) reveals structure invisible in the area-level average. The highest OCC is Hakone High-Grade (the mid-band of high-end hotels and ryokans) at 75.2%, followed by Hakone Luxury at 41.2% and Hokkaido Resort Luxury at 45.3%. Conversely, the lowest OCC (= still available) tiers are Okinawa Budget at 18.7%, Okinawa Economy at 20.0%, and Hokkaido Resort Budget at 22.5%.
Source: MetroEngines Research, compiled by HotelBank Editorial Team (4 areas × 6 grades, 2026/8/13–14 aggregation)
Particularly notable is the standout 75.2% for Hakone High-Grade ryokans. This segment includes only 24 properties within Hakone — a “scarce resource” with a small denominator. By contrast, Okinawa Luxury (156 properties, ADR ¥122,700, OCC 30.0%) has so many absolute properties that even at 30% OCC, the absolute remaining inventory far exceeds Hakone. “OCC (occupancy)” and “absolute remaining inventory” are different metrics, and from the consumer’s perspective the latter is what directly translates to perceived choice.
Pace Index — The Acceleration Gap by Grade: “Luxury Sprints in All Areas, Budget Stagnates”
Re-evaluating segments not by absolute OCC level but by “how much sold over the 23 days from Apr 19 to May 12” (ΔOCC pp), a strong synchronized pattern emerges along the grade axis rather than the area axis. The Luxury tier is extreme in all four areas at +56 to +83 pp / 23 days, High-Grade to Upper is medium pace (+44 to +46 pp), Economy is +32 pp, and Budget is virtually stagnant at +6 pp. The structural insight invisible in absolute OCC is this: “for Obon peak days, the Luxury tier was absorbed all at once across areas in the three weeks around the post-Golden-Week window.”
Source: MetroEngines Research, compiled by HotelBank Editorial Team (OCC pp change over 2026/4/19 → 5/12; only segments with ≥15 properties on both 4/19 and 5/12 included)
Three implications follow from this pace ranking. First, the Luxury tier (Karuizawa +83pp, Hokkaido +71pp, Okinawa +66pp, Hakone +56pp) is absorbed intensively in the LT 80–95 days window. The high-rate segment moves all at once at the timing when early-booking benefits, anniversary plans, and the post-Golden-Week “summer holiday locked in” moment overlap. Second, the Budget tier (Okinawa Budget +6pp, Hokkaido Upper +4pp) has barely moved over 23 days — these are segments waiting for last-minute LT-30 demand, and booking managers currently holding inventory will likely have to lower prices to fill it. Third, Okinawa High-Grade (+44pp) and Upper (+46pp) move at equivalent pace — Okinawa’s mid-tier segments selling at the same speed as the Luxury tier should prompt an update of the conventional view that “Okinawa is primarily a last-minute market.”
Category-Level Extremes — Ryokans and Resort Hotels Lead, Vacation Rentals and Glamping Show a Different Structure
By hotel category, even more extreme patterns appear. Hakone’s “business hotel” segment (only 2 properties) is nearly sold out at OCC 98.7%; Karuizawa’s “city hotel” (2 properties) is at 54.4%; Hokkaido Resort’s “resort hotel” at 53.3%; Hakone’s “ryokan” at 47.7%; and Karuizawa’s “ryokan” at 44.1% — these make up the early-sell-out tier. Vacation rentals, on the other hand, vary widely by area: Hakone 6.6%, Karuizawa 38.7%, Okinawa 10.0%, Hokkaido Resort 10.9%. Glamping and cottage categories still have headroom in Hokkaido and Okinawa.
Source: MetroEngines Research, compiled by HotelBank Editorial Team (4 areas × main categories, 2026/8/13–14 aggregation)
The small denominator of two business hotels in Hakone and two city hotels in Karuizawa means that “standard hotels absorbing business demand” are structurally scarce in these areas. It is logical that they are absorbed early as low-rate options for the Obon peak. Conversely, shared/distributed lodging formats such as vacation rentals, cottages, and guesthouses — where families and groups book at scattered timings — tend to retain inventory even on peak days.
The “Still Available — Area × Grade × Price Band” Map
Integrating the data above, we present a practical matrix for both consumers and booking managers. The table below aggregates the number of properties with “on-sale (not sold out)” plans for August 13–14 check-in, by area × grade × price band. The larger the number, the more choice remains and the higher the probability of getting a room.
| Area | Grade | ~¥25k | ¥25–50k | ¥50–100k | ¥100k+ |
|---|---|---|---|---|---|
| Okinawa | Luxury | 12 | 47 | 110 | 106 |
| Upper / High-Grade | 149 | 233 | 161 | 75 | |
| Economy / Budget | 350 | 156 | 61 | 20 | |
| Hokkaido Resort | Luxury | 14 | 29 | 34 | 29 |
| Upper / High-Grade | 11 | 29 | 21 | 9 | |
| Economy / Budget | 23 | 12 | 3 | 0 | |
| Hakone | Luxury | 2 | 9 | 62 | 71 |
| Upper / High-Grade | 5 | 24 | 28 | 9 | |
| Economy / Budget | 3 | 9 | 5 | 1 | |
| Karuizawa | Luxury | 0 | 2 | 15 | 22 |
| Upper / High-Grade | 3 | 22 | 22 | 12 | |
| Economy / Budget | 10 | 7 | 3 | 1 |
Source: MetroEngines Research, compiled by HotelBank Editorial Team (number of properties with on-sale plans, 2026/8/13–14 aggregation, N=2,146 properties)
Three important patterns emerge from this map. First, Okinawa retains thick choice across all price bands and all grades. In the Upper to High-Grade ¥25–50k band, 233 properties remain on sale — an order-of-magnitude advantage in absolute choice over other areas. Second, Hokkaido Resort (Niseko and Kutchan in particular) is bimodal: the Upper mid-tier is thin relative to Luxury, polarizing the offering. Third, in Hakone and Karuizawa, practical choices exist only above the ¥50k mid-to-high price tier. Only five properties remain bookable in Hakone under ¥25k. Combined with the pace analysis above, however, Okinawa Luxury (+66pp/23 days, post-GW concentration) is likely to lose more than half its current remaining inventory by the end of June, despite seeming abundant today.
Consumer Perspective — A Practical Guide to “Still Available” Areas
The assumption that “Obon is sold out” is wildly off depending on area and price band. With 3 months still remaining, the following segments have relative slack. Okinawa’s Upper to High-Grade tier (ADR ¥25,000–50,000) has 233 properties on sale. For families of 3–4 booking a resort hotel, there is still a strong chance of securing their first choice. However, the pace analysis shows that “Okinawa High-Grade accelerated sharply by +44pp (11% → 56%) in the 5 days after Golden Week”, and unless action is taken by early June, available choices will likely be halved. For more on Okinawa’s structural demand depth, our analysis Will the Junglia Okinawa Opening Shift the Northern Market to a Year-Round Model? verifies post-Junglia year-round demand with ADR and occupancy across 6 areas. For Hokkaido Resort as well, by looking outside Niseko/Kutchan’s luxury zone toward the Lake Toya / Furano area, 34 properties in the Luxury tier (ADR ¥50k–100k) still hold inventory.
On the other hand, if you’re looking for the under-¥25k reasonable tier in Hakone or Karuizawa, choices are already down to the fingers of one hand. To target Obon in these areas, the realistic option is either to raise the budget above ¥50k or to push the check-in date back to August 16–17 (post-Obon). Daily data show Hakone’s OCC on August 17 falling to 32%, easing significantly from the 48% peak. Note also that Karuizawa Luxury has the fastest pace (+83pp/23 days, 5.6% → 88.9%, essentially on the verge of sell-out), so if undecided, this week is the decision point.
Booking Manager / RM Perspective — Building Strategy on the “OCC × Velocity” Matrix
For room-sales managers and revenue managers, this data shows “where the upside lies” along not absolute OCC but the two axes of “OCC × velocity”. The table below organizes strategy by the combination of “current OCC level” and “recent pace.” Even at the same “low OCC,” high pace means it is a price-raise window, whereas low pace means it is a wait-for-last-minute window (with possible discounting).
| High Pace (≥+50pp / 23 days) |
Medium Pace (+20 to +50pp / 23 days) |
Low Pace (+0 to +20pp / 23 days) |
|
|---|---|---|---|
| High OCC (40%+) |
Top priority: raise prices Hakone Luxury (+56), Hokkaido Luxury (+56) |
Stepwise price increases + sell-out plan design Hakone High-Grade, Hakone Ryokan |
Hold inventory and observe (few cases) |
| Mid OCC (20–40%) |
Prepare immediate price hike Karuizawa Luxury (+83), Okinawa Luxury (+66), Okinawa High-Grade (+44), Okinawa Upper (+46) |
Gradual price increases Okinawa Economy (+24) |
Hold price + prepare last-minute stimulus (few cases) |
| Low OCC (below 20%) |
N/A (high pace × low OCC is structurally rare) |
Observe + test price elasticity (few cases) |
Wait for last-minute demand Okinawa Budget (+6), Hokkaido Upper (+4) |
Source: MetroEngines Research, compiled by HotelBank Editorial Team (parentheses show 23-day OCC pp change from 4/19 → 5/12)
Adding resolution: Okinawa High-Grade to Upper (+44 to +46pp / 23 days) looks “still relaxed” at current OCC levels (around 30%), but is the textbook case of concentrated acceleration in the 5 days after Golden Week, and is likely to reach 50–60% by mid-June. Stepwise price increases on remaining inventory — especially in the ¥25–50k range, where price hikes this month present the largest revenue opportunity — are the right play. Rather than waiting for “the segment that couldn’t lock in airfare,” the faster move is to lift the ceiling on the segment already buying.
Hakone’s ryokans and resort hotels are already at high OCC (47.7% and 41.2%), and from the pickup standpoint the Luxury tier is moving at a fast +56 pp/23 days pace. Stepwise price increases on residual inventory are the largest revenue opportunity. The August 13 ADR of ¥127,000 at the snapshot date is, by historical pattern, likely to push further upward in the final 2–4 weeks. Channel-mix reweighting and final-week sell-out plan design become important at this stage.
Conversely, Okinawa Budget (+6pp/23 days) and Hokkaido Upper (+4pp/23 days) have been left behind even by the post-Golden-Week wave, failing to absorb high-rate demand for Obon peak days. These are segments waiting for LT-30 last-minute demand, and a design that holds current ADR levels through end-June, then injects flexible discount plans (consecutive-night discounts, family plans, etc.) from mid-July onward, works well. The Okinawa Economy / Budget tier — with OCC under 20% and a large absolute property count — is positioned to absorb inflows from “guests who couldn’t lock in other areas” and “guests who secured airfare.”
Source: MetroEngines Research, compiled by HotelBank Editorial Team (distribution of properties with on-sale plans, by price band, 2026/8/13–14)
Structural Differences Between the Early Sell-Out Tier and the Late-Availability Tier
To frame the spine of this analysis: the 2026 Obon booking picture should be read not as a “price story” centered on ADR absolute level or YoY changes, nor as a “current-position story” centered on absolute OCC snapshots, but as a “pace × residual inventory” structural story of which tier fills at what speed, and which tier remains until close-in. The early-sell-out tier shares four conditions: (1) small absolute property count (scarce resource), (2) good access from the Tokyo metro area, (3) traditional symbolic Obon destinations (Hakone ryokans, Karuizawa Luxury), and (4) sharp acceleration of +50pp or more in the 5 days after Golden Week.
Conversely, segments where inventory remains until close-in share four common traits: (1) many distributed properties, (2) medium- to long-distance travel required, (3) year-round demand structure distinct from ski / summer-retreat, and (4) low 23-day pace (+10pp or less). Okinawa Budget and Hokkaido Resort Upper fit this structure. By contrast, Okinawa Luxury to High-Grade is the rare zone where “current OCC is moderate, but post-GW pace is at the top speed level” — being fooled by the apparent slack risks “irreversible” by LT-60 days. Note also that the pickup analysis here shows Obon hotel bookings concentrating not during Golden Week itself but in the first weekend after it (May 8 onward) — both booking managers and consumers can use this as a benchmark for prediction timing in future years.
Understanding this structural difference allows consumers to segment their searches into “segments to give up on,” “segments still attainable but moving fast,” and “segments that can wait until close-in.” Booking managers can similarly distinguish “OCC-decision-already-made windows,” “ADR-pursuit windows,” and “hold-price-wait-for-last-minute windows” in building strategy. The observation at the single time point of 2026 Obon provides a baseline that can also serve forecasting models for subsequent years.
⚠ Note on Future-Date ADRs: ADRs in this article are averages of OTA-listed selling prices at the survey snapshot (May 11, 2026) and will fluctuate as check-in approaches. Please note that prices set high at present may drop with last-minute discounting, and OCC may also progress further from current levels — both directions are possible.
📊 Note on OCC Aggregation Methods: The snapshot OCC values used in the main text (46.3% etc.) are based on the sold-out plan share (plan-level across N=2,146 properties), whereas the pickup curve, velocity, and Pace Index (chart_pickup, chart_pace, the velocity table) are based on hotel-level sold-out ratios across the N=678 inventory-history tracked subset, aggregated as raw daily readings (only days with coverage ≥85% included). The aggregation window is limited to the 23 days of 2026/4/19 → 5/12 — earlier dates were excluded because scraping coverage for the four areas was unstable (Hokkaido in particular had only 3 properties tracked as of 3/15). Since the absolute levels of the two methods differ, please do not directly compare them — read them as gauges for the relative trend (pace).
Related Reading
- Summer Resort Three-Region Comparison 2026: Niseko, Okinawa, Karuizawa — ADR, Booking Pace, and FX Sensitivity
- Summer 2026 Hotel Price Comparison: Okinawa, Hokkaido, Kyoto — When Is the Best Time to Book?
- GW 2026 Hokkaido Hotel Price Analysis: Niseko +29%, the Background to the Sell-Out Surge and Inbound
- 2026 Summer Festival OTA Price and Sell-Out Daily Analysis Across the 3 Major Areas: Fuji Rock and Summer Sonic
- Tohoku’s Three Great Festivals 2026 Booking Pace: Early-August ADR and Sell-Out Rates in Aomori, Akita, and Sendai
- Will the Junglia Okinawa Opening Shift the Northern Market to a Year-Round Model? — Verified With ADR and Sell-Out Across 6 Areas
- GW 2026 Last-Minute Rush Demand: ADR Movement Analysis by Lead Time
- GW 2026 Fastest-Selling Family Hotels: The Background to 6,106 Properties Disappearing by March and Booking Timing for Next Year
- Silver Week 2026, the First 9-Day Break in 11 Years — ADR Analysis and Price Strategy via the Booking Curve
- Hokkaido in June, the Rainy-Season-Free Month — How Do Hotel Prices Move? 6-City ADR Comparison 2026
References and Sources
- MetroEngines Research — OTA public price data (August 2026 check-ins, N=2,146 properties, survey date May 11, 2026)
- Pickup curve and Pace Index aggregation — inventory-history tracked N=678 properties, daily raw readings over 2026/4/19 to 5/12 (23 days), only days with coverage ≥85% included
- JNTO (Japan National Tourism Organization) “Foreign Visitors to Japan (Provisional Figures for March 2026)”
- 2026 (Reiwa 8) Obon Holiday Period and How to Take a 9-Day Break
- HIS “Summer / Obon Travel and Tour Recommended Feature 2026”
- JTB “Summer / Obon Recommended Domestic Travel Feature 2026”
- JTB “2026 (January–December) Inbound Travel Market Trend Forecast”
- Yamatogokoro.jp “March 2026 Inbound Visitors: 3.61 Million, Cumulative Over 10 Million”